Behavior of accumulation functions
Every single AP Calculus exam has featured a free-response question centered on a graph of and a corresponding accumulation function. Suppose we define it as:
The absolute first thing you must write on your paper is the Fundamental theorem of calculus link:
Treat these problems like the ones from section 5.4: given the graph of the derivative , what can you conclude about the original function ?
Review of derivative relationships
This table summarizes how F behaves based on the sign of its derivative f. It shows when F is increasing or decreasing, where relative extrema occur, and how concavity and inflection points relate to f and its derivative.
| Property of | where |
|---|---|
| Increasing | |
| Decreasing | |
| Relative min | Changes from to |
| Relative max | Changes from to |
| Concave up | Increasing |
| Concave down | Decreasing |
| Inflection point | Has a local min/max |
Example 1: Standard problem
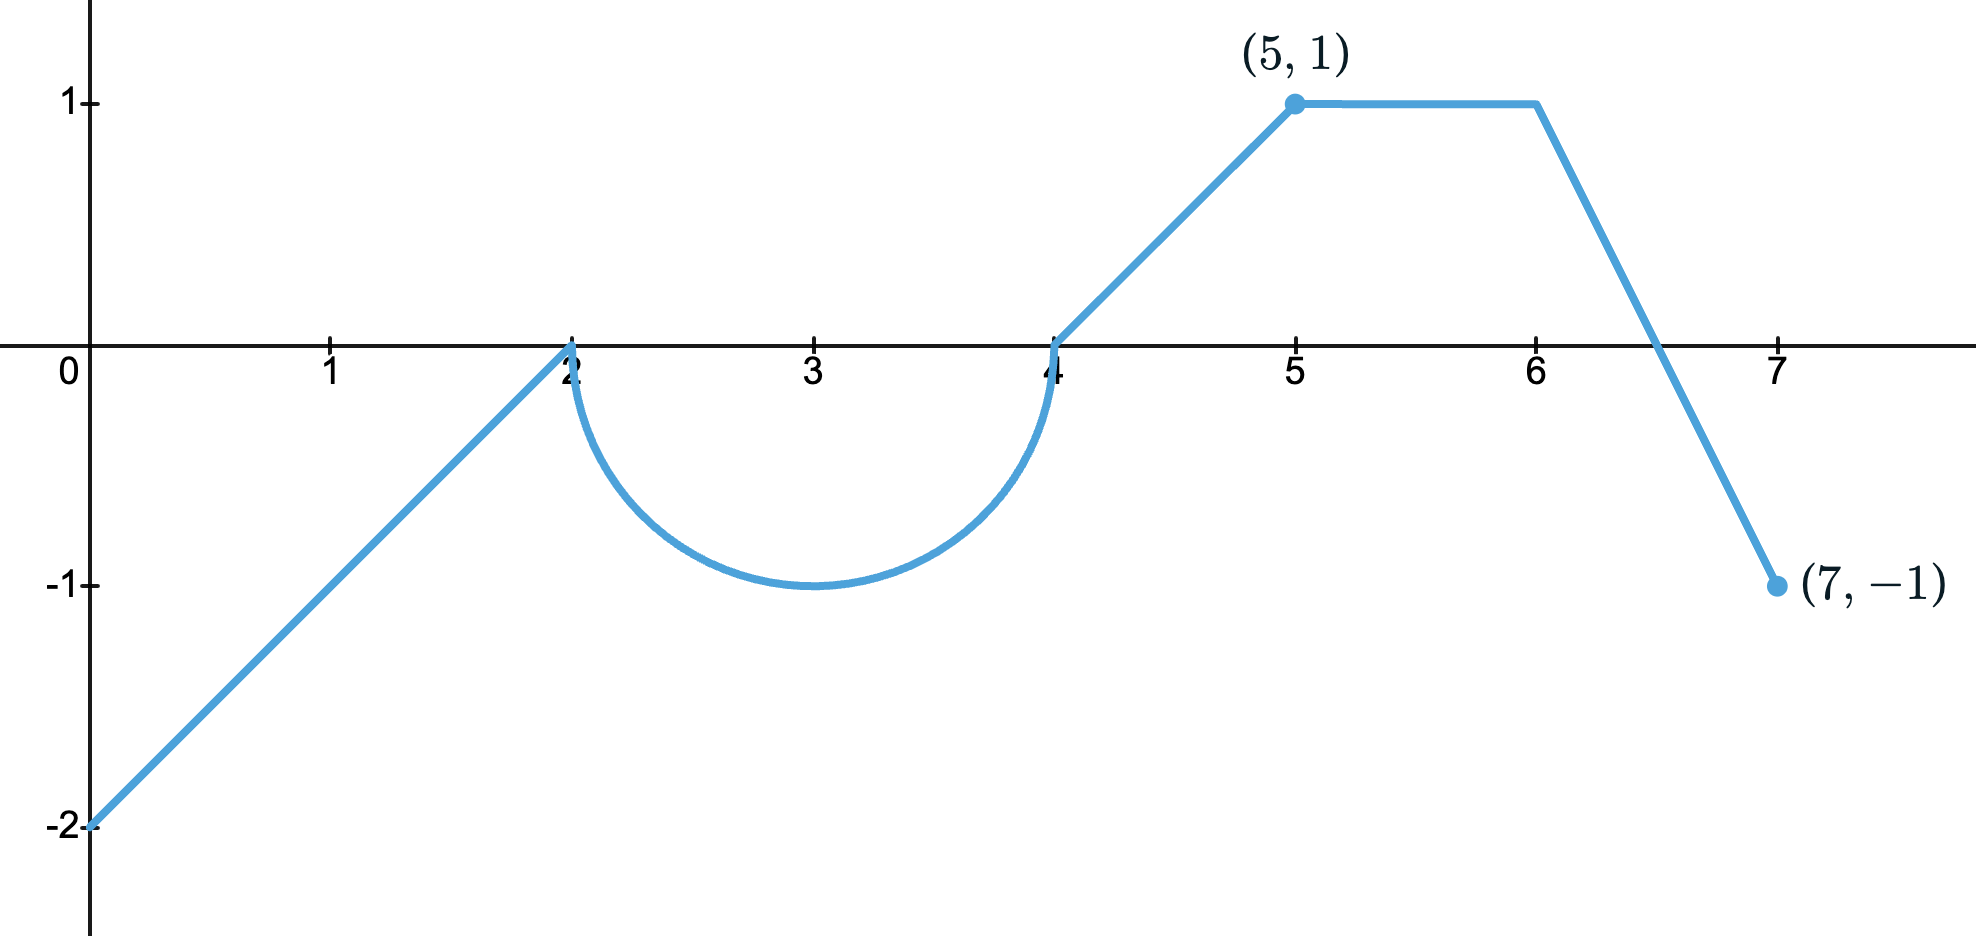
Shown below is the graph of :
Let be the function defined by
Use the graph of to complete the table describing the behavior of . Give interval(s) or ordered pair(s) as appropriate.
The table below asks you to describe five properties of F using the graph of f. These properties are increasing and decreasing intervals, relative extrema, absolute extrema, concavity, and inflection points.
| Interval or ordered pair | |
|---|---|
| Increasing & decreasing | |
| Relative extrema | |
| Absolute extrema | |
| Concavity | |
| Inflection point(s) |
increasing/decreasing
-
Increasing:
-
Decreasing:
Why? Because , increases where (above the -axis) and decreases where (below the -axis).
Relative extrema of
- Relative minimum:
- Justification: changes from to at .
For the -value, calculate signed area for definite integral:
- Relative maximum:
- Justification: changes from to at .
Calculation:
Absolute extrema of
Because the interval is closed, compare the function’s value at both endpoints and at each critical point. The largest value occurs at the left endpoint, x equals 0. The smallest value occurs at the critical point x equals 4.
- Absolute max:
- Absolute min:
Because of the closed interval, use the Extreme value theorem and compare endpoints () and relative extrema values:
- Left endpoint ():
- Critical point ():
- Critical point ():
- Right endpoint ():
Comparing values,
- Absolute max:
- Absolute min:
Concavity of
Since ,
- Concave up: (where )
- Concave down: (where )
Inflection point(s) of
Answers: and
Inflection point of changes sign.
Since , look for where:
- (occurs at ).
- is undefined (occurs at sharp corners: ).
Check signs of using slopes of .
This table checks each candidate x-value for a sign change in f prime. Check marks appear at x equals 2 and x equals 3, so both are inflection points. There is no sign change at x equals 4, 5, and 6, so those are not inflection points.
| Sign change in | Inflection point? | |
|---|---|---|
| None | ||
| None | ||
| None |
Note: The last 3 are "none* because going from to and vice versa is not a sign change.
Lastly, calculate the -values:
For :
For :
Inflection points:
Example 2: FTC with chain rule
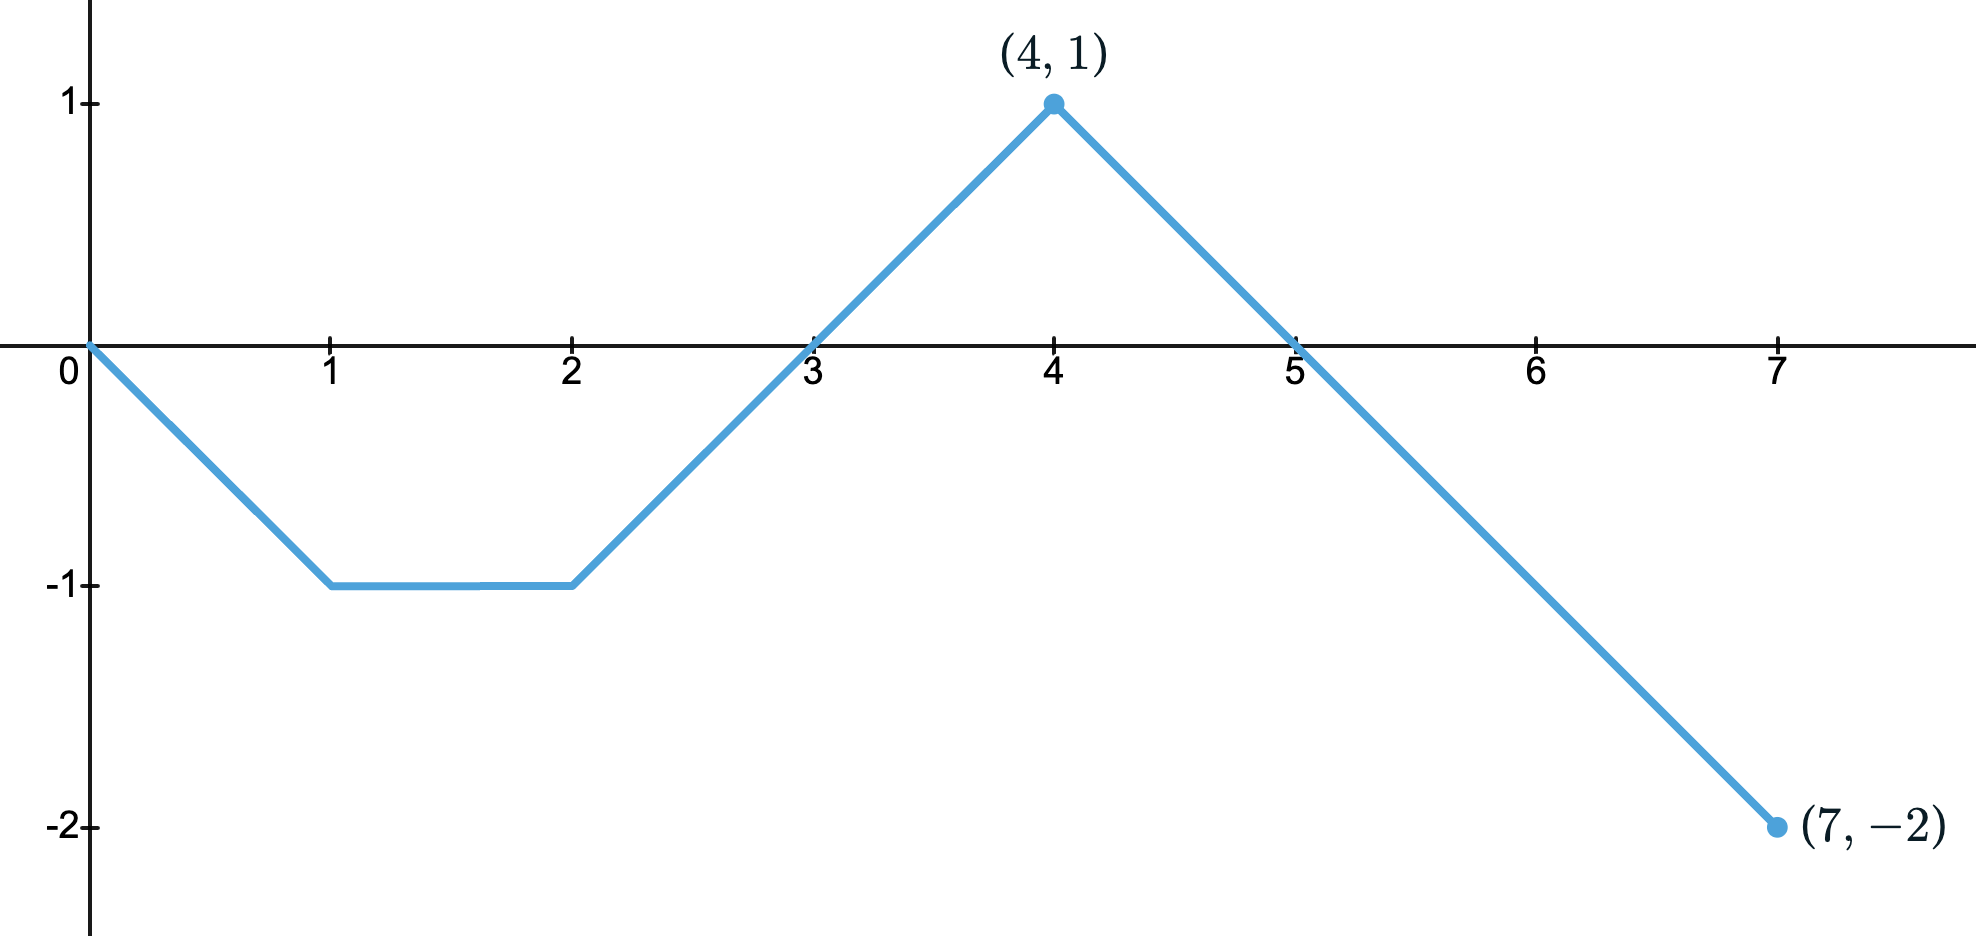
The graph of is shown below:
Let
Find:
a) The -value at which has a relative max.
b)
c)
d)
Solutions
a) Where has a relative max
Relative max of changes from to .
Find by using FTC with chain rule:
Set :
From the graph of , the zeros occur at:
- input : changes from to relative min.
- input : changes from to relative max.
Now convert back to :
So has a relative maximum at .
b)
Evaluate h of 3 by finding the signed area under f from 0 to 5. Break the region into a trapezoid and a triangle. The total signed area is negative 1.
Evaluate the accumulation function:
by adding up the signed areas on .
c)
From part a),
So
This matches the fact that is a relative extremum of .
d)
Differentiate again. Since
we get
Then
is the slope of the graph of at input . At , the graph lies on the line segment between and , so the slope is
Therefore , and