Accumulation of change
In the first part of AP Calculus, derivatives were used to find rates of change from a function that describes an amount.
The second part of AP Calculus reverses this process. Given a rate of change, such as speed, a growth rate, or an inflow/outflow rate, you can determine the accumulated change of a quantity, or how much it has increased or decreased over a specific interval.
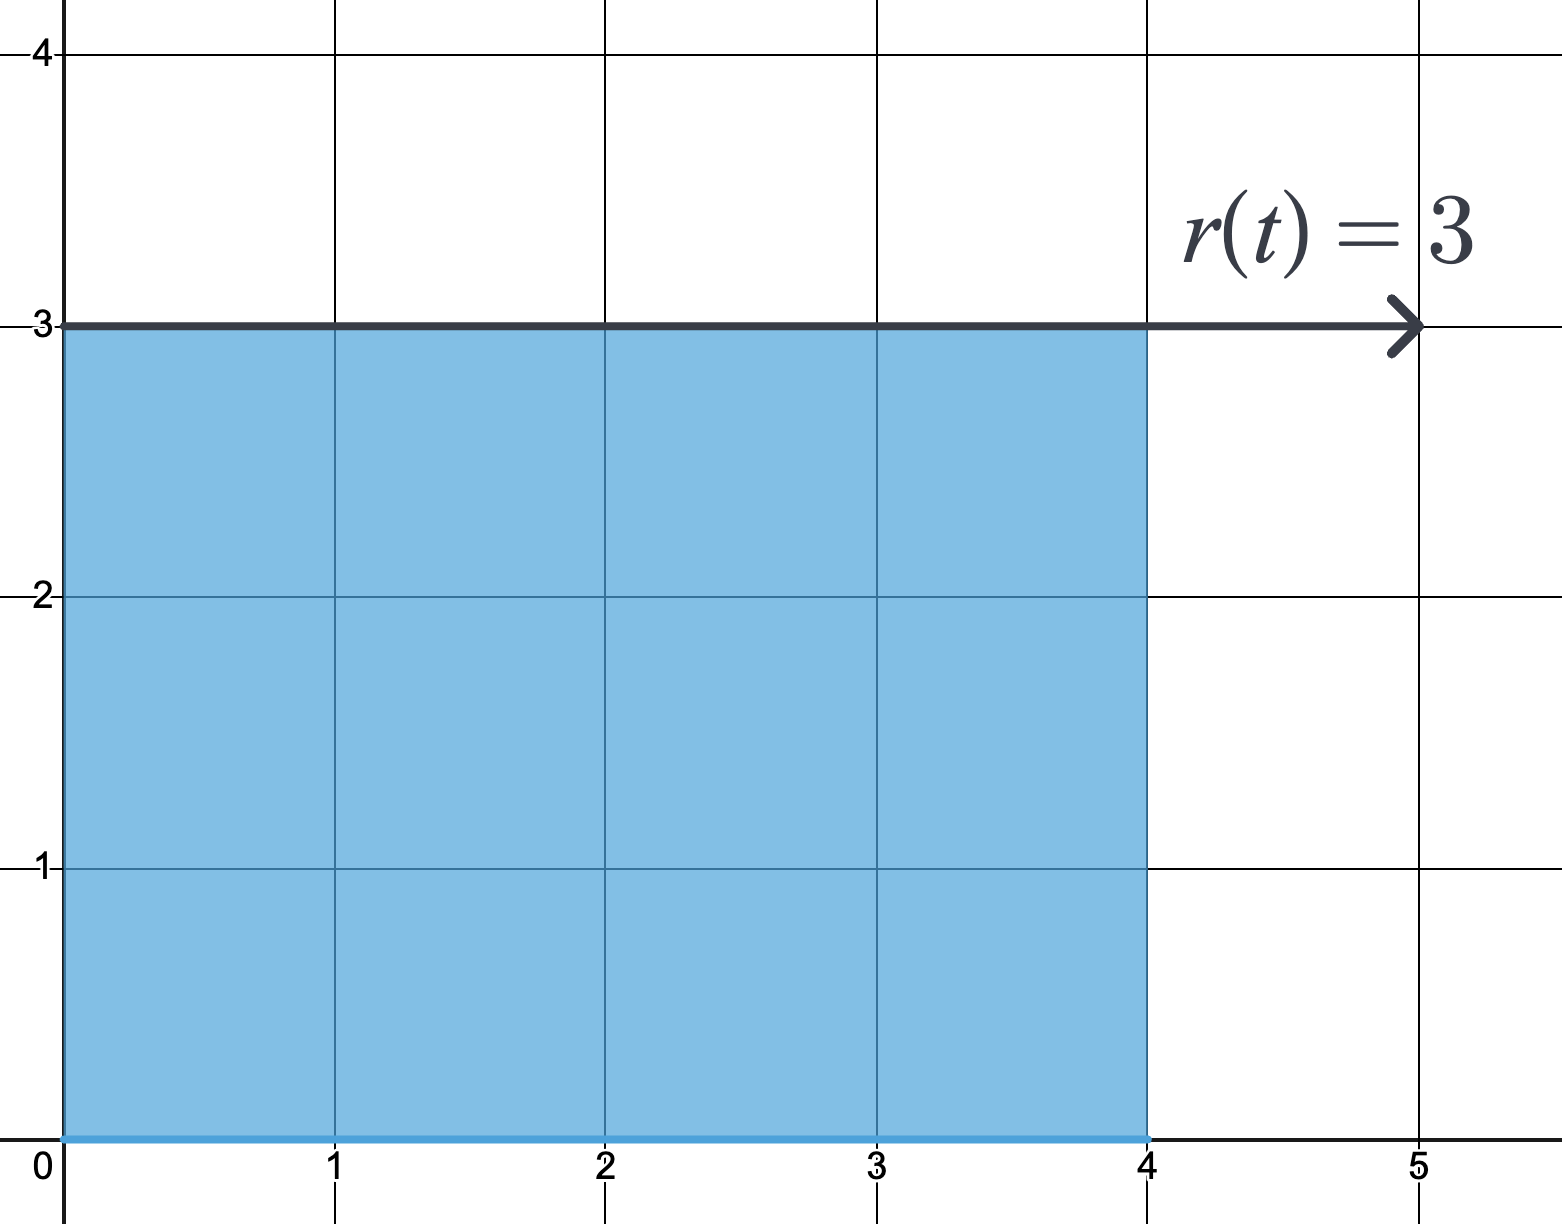
Accumulation under a constant rate
When a rate of change is constant, total accumulation is simply the rate the time. For example,
Water is flowing into a bucket at a steady rate of liters per minute. How much water has accumulated after minutes?
At a constant rate of liters per minute, the total amount of water added after minutes is
Graphically, the constant rate forms a horizontal line. The total accumulation corresponds exactly to the area of the rectangle between , the -axis, and the time interval . Accumulated change is represented by the area under the rate curve.
Accumulation under a variable rate
Even for rates that aren’t constant, the same idea still applies: the accumulation of change over an interval is the area between the graph of the rate function and the -axis over that interval.
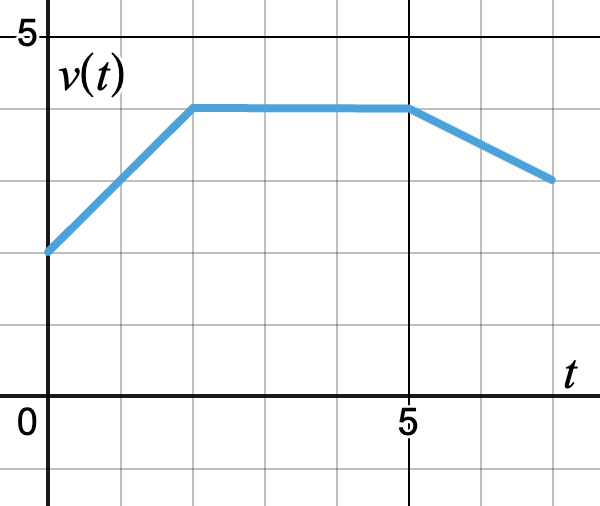
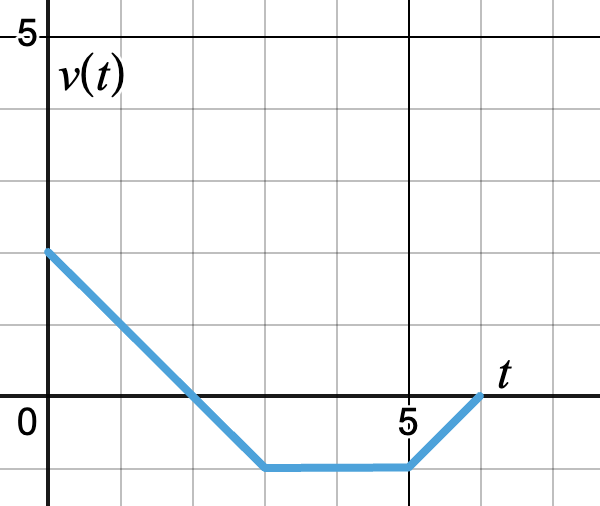
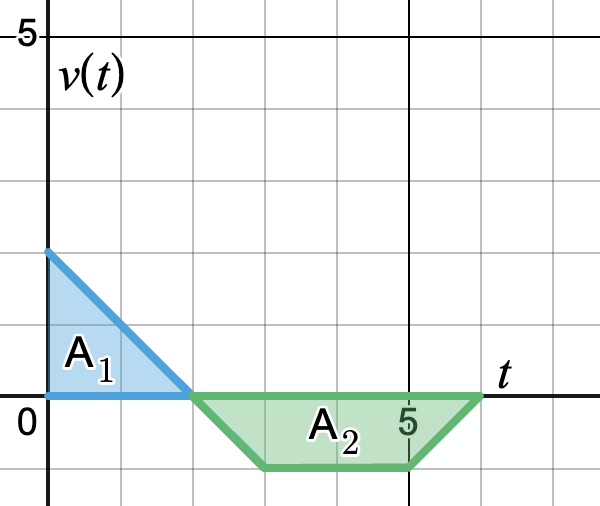
A particle’s velocity, in meters per second, is modeled by and shown in the graph below.
a) How far is the particle from its starting position after the first seconds?
b) How far has the particle traveled between and seconds?
Solutions
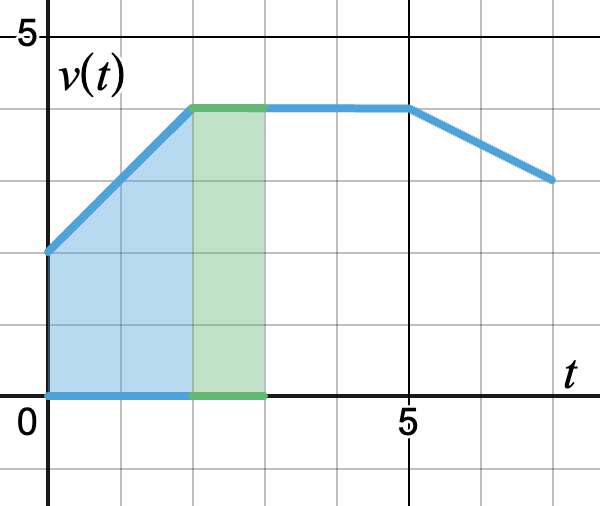
a) The distance traveled after seconds
This is the area under the graph from to , as shown below.
Use geometry to calculate the areas of the trapezoid (in blue) and the rectangle (in green), then sum the areas. The area of a trapezoid is
So the total area, or the distance accumulated over the first seconds, is
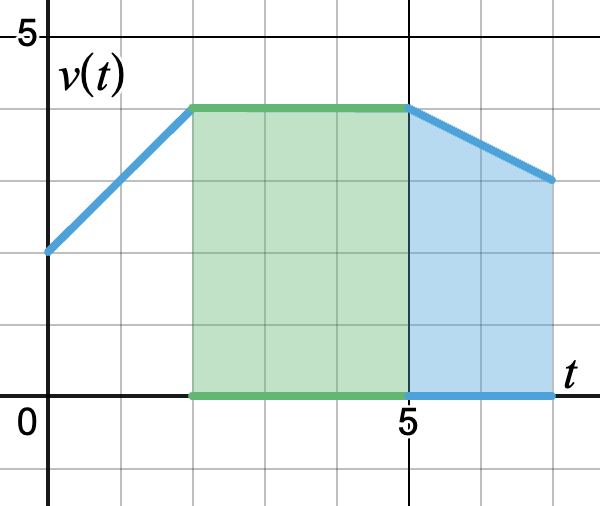
b) The distance traveled from to seconds
This is the area under the graph on as shown:
Then the distance traveled is
Area “under” a curve
In calculus, “area under a curve” specifically means the bounded area between the graph of a function and the -axis over a given interval. When a region is:
- Above the -axis: Total amount increases (positive accumulation)
- Below the -axis: Total amount decreases (negative accumulation)
Consider the velocity graph below over the interval , where velocity is measured in meters per second. The second figure shows the same graph with the relevant regions shaded.
Recall from section 4.2.1 that the sign of velocity indicates the direction of motion.
- Positive accumulation: Over seconds, . The particle travels to the right (position increases) for a distance of:
- Negative accumulation: Over seconds, . The particle moves left after changing direction at seconds. The signed area of the trapezoid is:
The net change in position (displacement) is the net signed area, while the total distance traveled is the sum of the magnitudes of the changes.
| Displacement | Total distance |
|---|---|
This means the particle ends up meter to the left of its starting position but traveled a total distance of meters.