Technical analysis
In the previous chapter, you learned about fundamental analysis, which involves evaluating a company by examining its financial condition. Now we’ll shift to a different approach.
Technical analysis focuses on identifying and forecasting trends in the market by studying trading activity - especially price and volume. Technical analysts typically pay little to no attention to a company’s fundamentals (such as expenses, revenues, or balance sheet items). Instead, they look for recurring price patterns and try to profit if those patterns appear again.
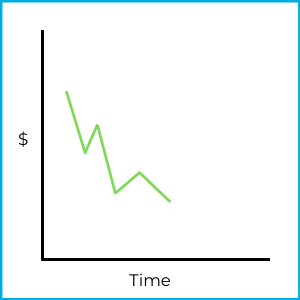
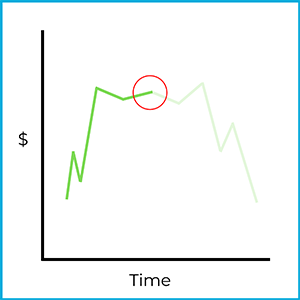
A core idea in technical analysis is that market behavior tends to repeat over time. To see what that means in practice, look at this stock chart:
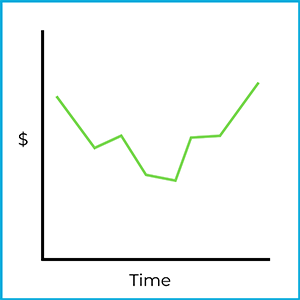
This may look like a basic price chart, but a technical analyst would recognize it as a specific pattern: a head and shoulders bottom formation. Even though the price movement in the chart has already happened, the pattern can be used as a clue about what might happen next.
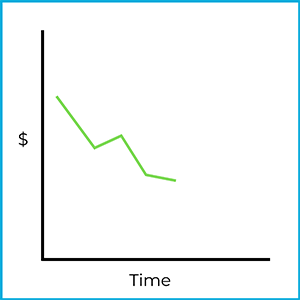
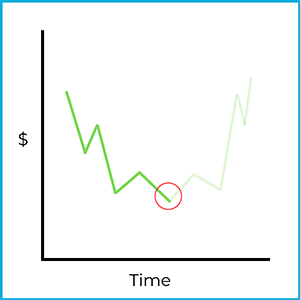
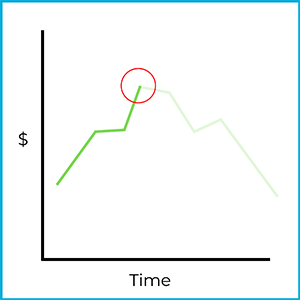
For example, imagine that a few days later the same stock begins fluctuating like this:
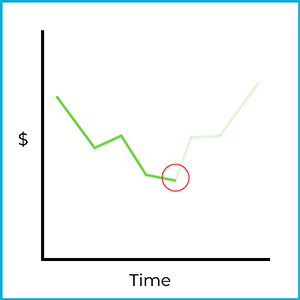
There’s no guarantee the price will move the same way again, but real markets do sometimes show repeating trends. If this stock follows the same trajectory as before, buying at this point could be profitable:
The key limitation is that the market can always move the other way. Technical analysis is a tool for making predictions, not a way to eliminate uncertainty. Because this approach relies heavily on reading charts, technical analysts are often called chartists (short for “chart artists”).
Saucers
Saucer formations are market patterns that include a reversal (a change in direction). There are two types of saucer formations: saucer bottom formations and saucer top formations.
A saucer bottom formation looks something like this:
The price declines, levels off, and then begins rising. Even if the price starts and ends in roughly the same area, the important feature is the shift from falling prices to rising prices. This is a reverse downward trend: the stock was moving down, then reversed and moved up.
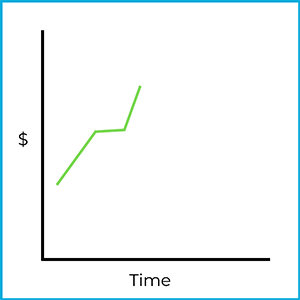
Chartists try to spot the early stage of a saucer bottom formation, such as:
If a chartist correctly identifies this as the beginning of a saucer bottom formation, they might try to profit by going long (buying) the stock at this point:
Of course, the market could still move in a different direction. The idea is that trends can be predictable at times, but any trade based on a pattern is still a risk.
If you flip the previous charts upside down, you get a saucer top formation:
Here, the price rises, levels off, and then begins falling. This is a reverse upward trend: the stock was moving up, then reversed and moved down. Chartists watch for the early stage of a saucer top formation:
If it’s correctly identified as the beginning of a saucer top formation, an investor might try to profit by going short (short selling) the stock at this point:
Again, the market could move in a different direction. Selling short also involves unlimited risk, so a trade based on this pattern can be especially risky. If the downward trend continues, however, the investor could profit.
Head & shoulders
Head & shoulders formations are also reversal patterns. There are two types of head & shoulder formations: head & shoulders top formations and head & shoulder bottom formations.
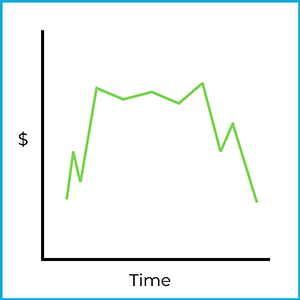
A head and shoulders top formation looks something like this:
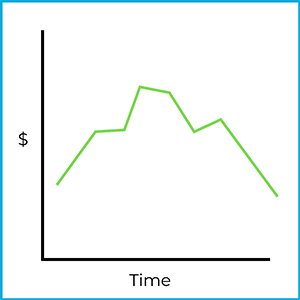
The shape resembles a person’s head and shoulders. In this pattern, the price rises, pauses, rises again, pauses again, then falls, pauses, and falls again. The overall message is that an upward trend has reversed and turned downward - this is a reverse upward trend.
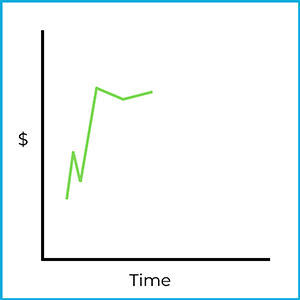
Technical analysts look for the early stage of a head & shoulders top formation, such as:
Early on, the pattern may not be obvious. But if a chartist correctly identifies it, they might try to profit by going short (selling short) the stock:
Borrowing shares and selling them at this point could produce a profit if the price falls. However, the trade carries considerable risk. Short selling (discussed in detail in a future chapter) exposes investors to unlimited potential losses.
A head & shoulders bottom formation is essentially the upside-down version of the top formation:
You can think of it as a person hanging upside down. In this pattern, the price falls, pauses, falls again, pauses again, then rises, pauses, and rises again. The overall message is that a downward trend has reversed and turned upward - this is a reverse downward trend.
Chartists watch for the early stage of a head & shoulders bottom formation:
If a chartist correctly identifies the pattern, they might try to profit by going long (buying) the stock:
As with any chart pattern, the price isn’t guaranteed to move as expected. But if the market rises after the purchase, the investor can profit as the price continues upward.
Fundamental vs technical analysis
Fundamental and technical analysis are two different approaches to evaluating investments.
Fundamental analysis focuses on what to buy by examining a company’s financial health and economic conditions. Investors look at factors like earnings, revenue, price-to-earnings (P/E) ratio, dividends, and balance sheets to estimate a stock’s intrinsic value. This method is often used by long-term investors who want to find undervalued companies with strong growth potential. For example, an investor might buy a stock because it has consistent earnings growth and a low P/E ratio compared to its industry.
Technical analysis focuses on when to buy by analyzing price trends, charts, and market patterns. It relies on the idea that price behavior can repeat over time. This method is mostly used by short-term traders but can also be used for longer-term decisions when the goal is to capitalize on price fluctuations. For instance, a trader might buy a stock because it has broken above a key resistance level, signaling potential upward momentum.
In practice, fundamental analysis helps you decide whether a stock appears attractive based on financial and economic information, while technical analysis is often used to time entries and exits based on market trends. Many investors combine both methods.