Solving and graphing linear equations
Points from linear equations
If you’re given a linear equation, you can find points on its graph by choosing values and calculating the corresponding values. Each pair is a coordinate point you can plot on the coordinate plane.
Let’s try an example.
Using the following linear equation, find two points of its corresponding graph.
Any point on this line must satisfy the equation, so you can choose convenient values and compute . Let’s use and .
Now pair each value with its value to form points on the graph: and .
Connecting points
Once you have points from a linear equation, you can draw the line that represents its graph. Because linear graphs are straight lines, you only need two points.
- Plot each point on the coordinate plane.
- Draw a straight line through the two points.
- Extend the line in both directions to show it continues infinitely.
Lines from slope
The slope of a line tells you how quickly the line rises or falls as you move from left to right. It’s often described as “rise over run,” and it can be calculated using
If you know one point on the line and the slope, you can find additional points by using the slope as a set of moves.
For instance, suppose you start at the point and the slope is . Interpreting as “rise over run” means:
- rise unit (increase by )
- run units (increase by )
Starting from , moving up and right gives the next point .
After you have two points, draw a straight line through them to graph the linear function.
Solving linear equations
The solution to a single linear equation is the point where it crosses the -axis. In other words, it’s the -intercept, which you can find by setting and solving for .
The solution to two linear equations is the point where the two lines intersect. You can find this point by graphing both lines and locating the intersection, or by setting the two equations equal to each other and solving.
Find the solution to the following linear equations:
If you use a graph, you can graph both lines using the methods above and find the point where they intersect:
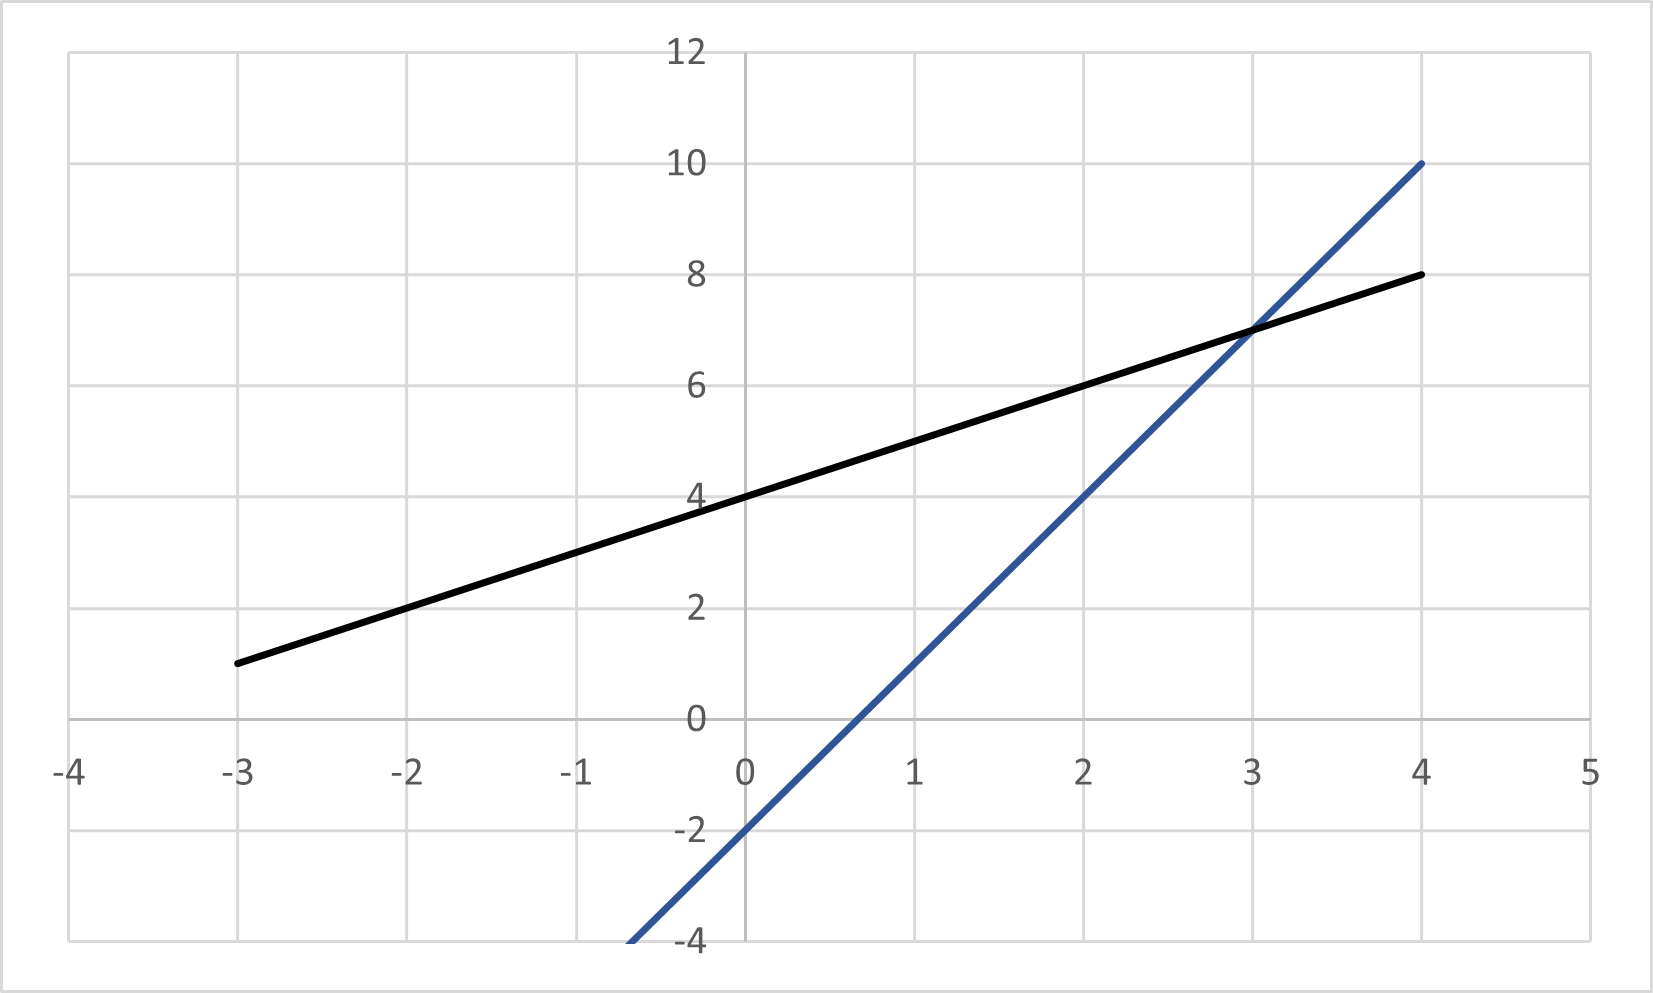
From the graph, the lines intersect at . That point is the solution to the system of linear equations.
Alternatively, you can solve algebraically by setting the two expressions for equal to each other:
Now, plug into one of the original equations to find :
So the point of intersection is .