A quadratic equation can be written in a way that makes the vertex easy to see. The vertex is the turning point of a parabola (or the point of the “V” on an absolute value graph). It’s where the graph reaches a maximum or minimum value.
This way of writing a quadratic is called vertex form:
A similar form works for absolute value functions:
Here’s what each parameter means:
The key benefit of vertex form is that the vertex is immediately visible: the vertex is at the point . This also helps you picture the graph as a transformation of the parent function (like or ) without graphing from scratch.
You may be given a graph and asked to find the equation that matches it. The main idea is:
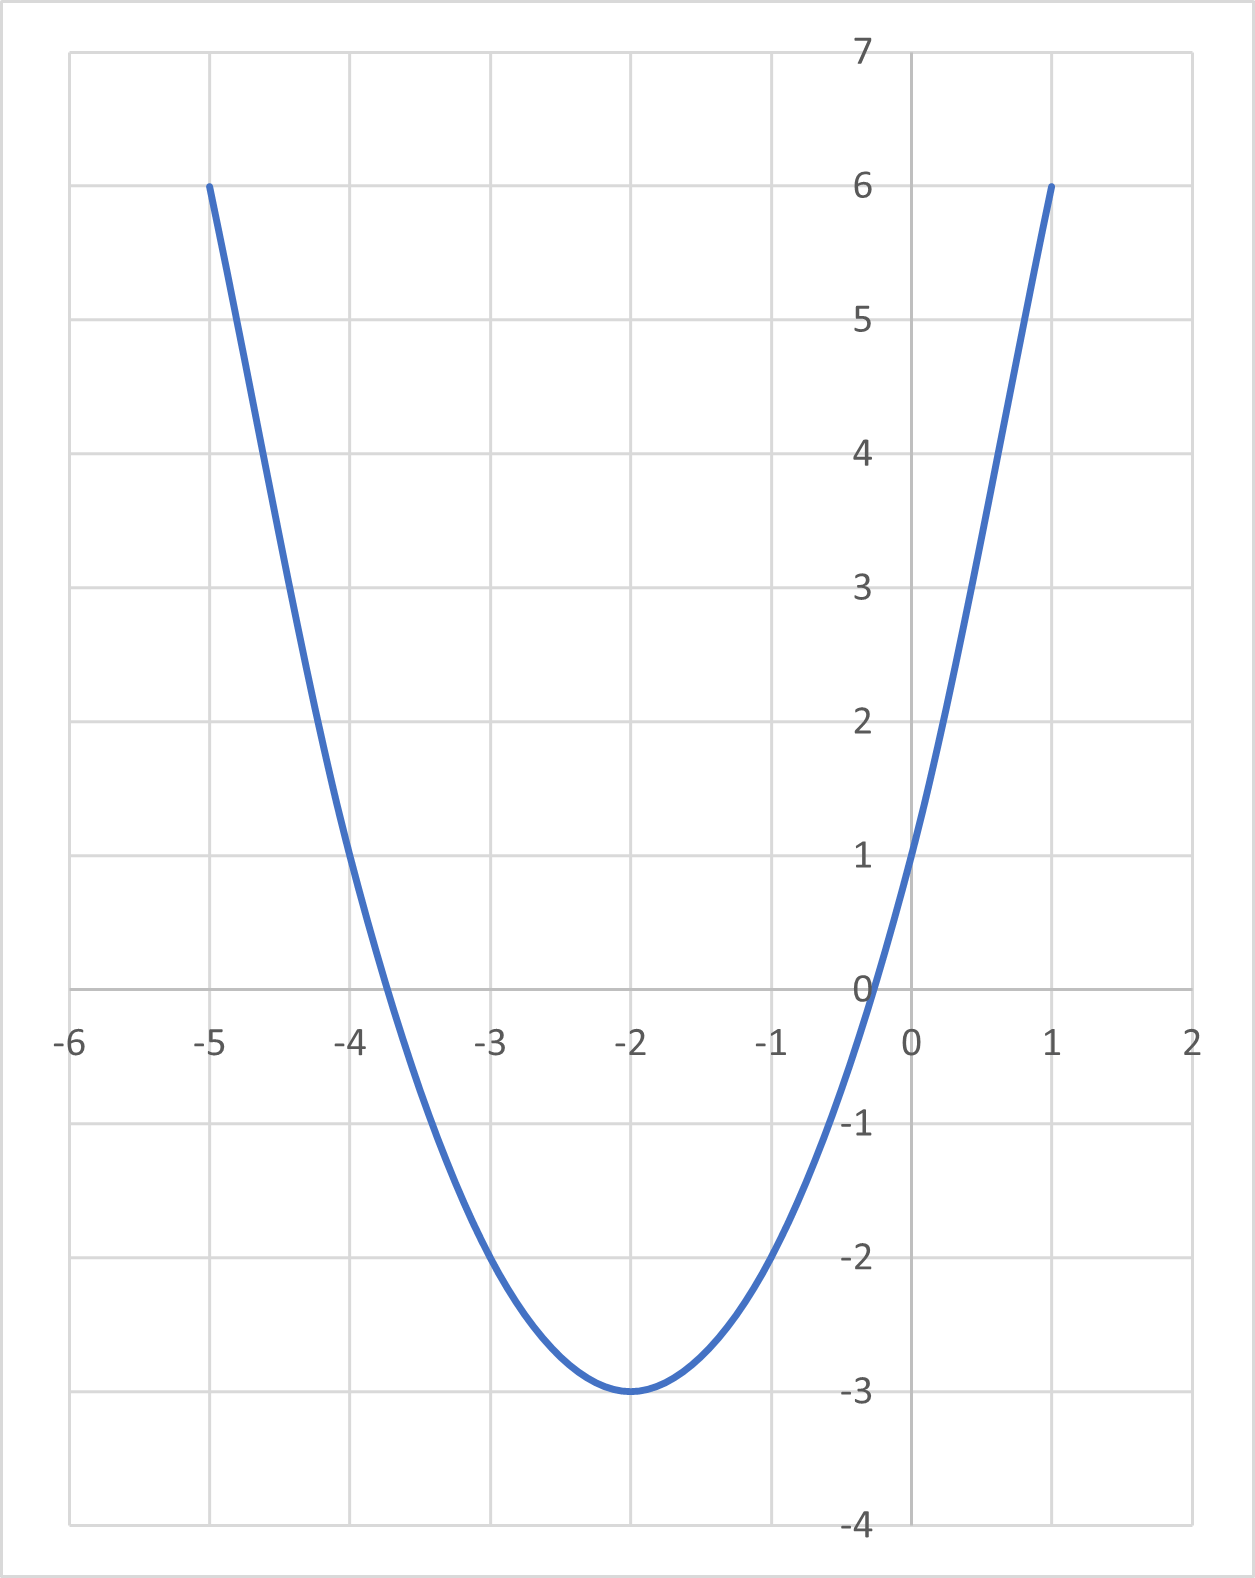
We will find the equation associated with the following graph:

Start with the vertex. The vertex is at , so:
Substitute these values into the vertex form of a quadratic:
Now solve for using any other point on the graph. From the graph, when , . Substitute into the equation:
Now substitute to write the final equation:
So the process is: find the vertex, write the vertex-form equation, use another point to solve for , then write the final equation.
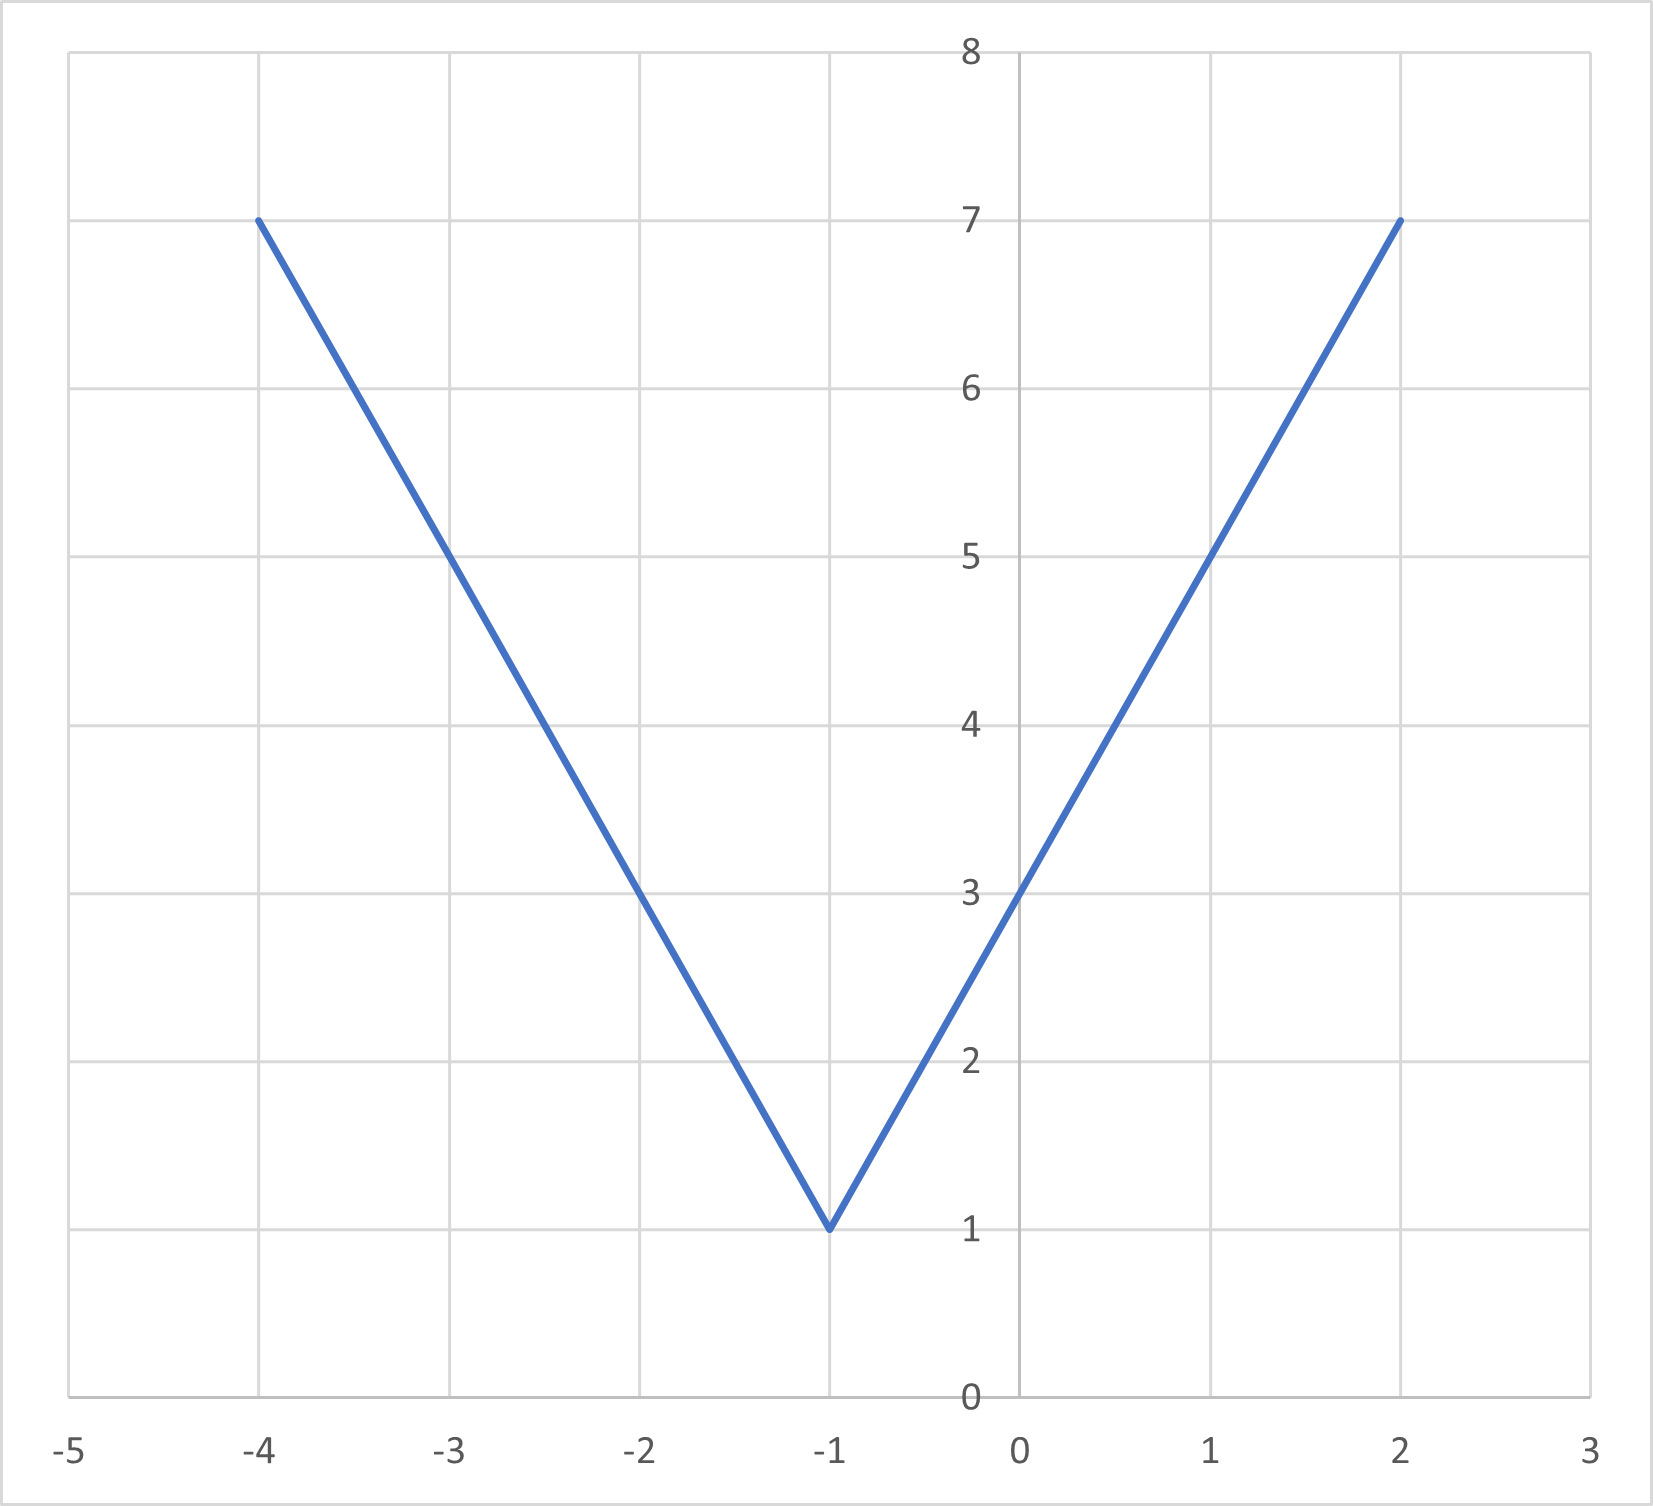
Using the same approach, we will find the equation associated with the following absolute value graph:

Start with the vertex:
Substitute into the absolute value vertex form:
Now solve for using another point on the graph. Use the point :
Form the final equation using this value of :
This is the reverse of what you did above: you’re given an equation and asked to identify the graph.
In vertex form, the vertex is always , so you can locate the vertex immediately. Then use to determine the shape:
Sometimes you won’t be asked to draw the graph, but instead to describe the transformations from the parent function. The parent function is the simplest version of the function:
For example:
What transformations exist for the function given by ?
Identify , , and by matching the equation to :
Given this, you can describe the transformations:
Sign up for free to take 3 quiz questions on this topic