Nonlinear functions and graphs
There are many nonlinear functions whose graphs you’ll need to recognize. The graphs below show the parent functions for several common nonlinear functions. A parent function is the simplest form of a function in a family.
In this lesson, you’ll review what these parent functions look like (both graphically and mathematically), learn how to describe graph limitations using asymptotes, and practice predicting how a graph changes when you alter the parent function.
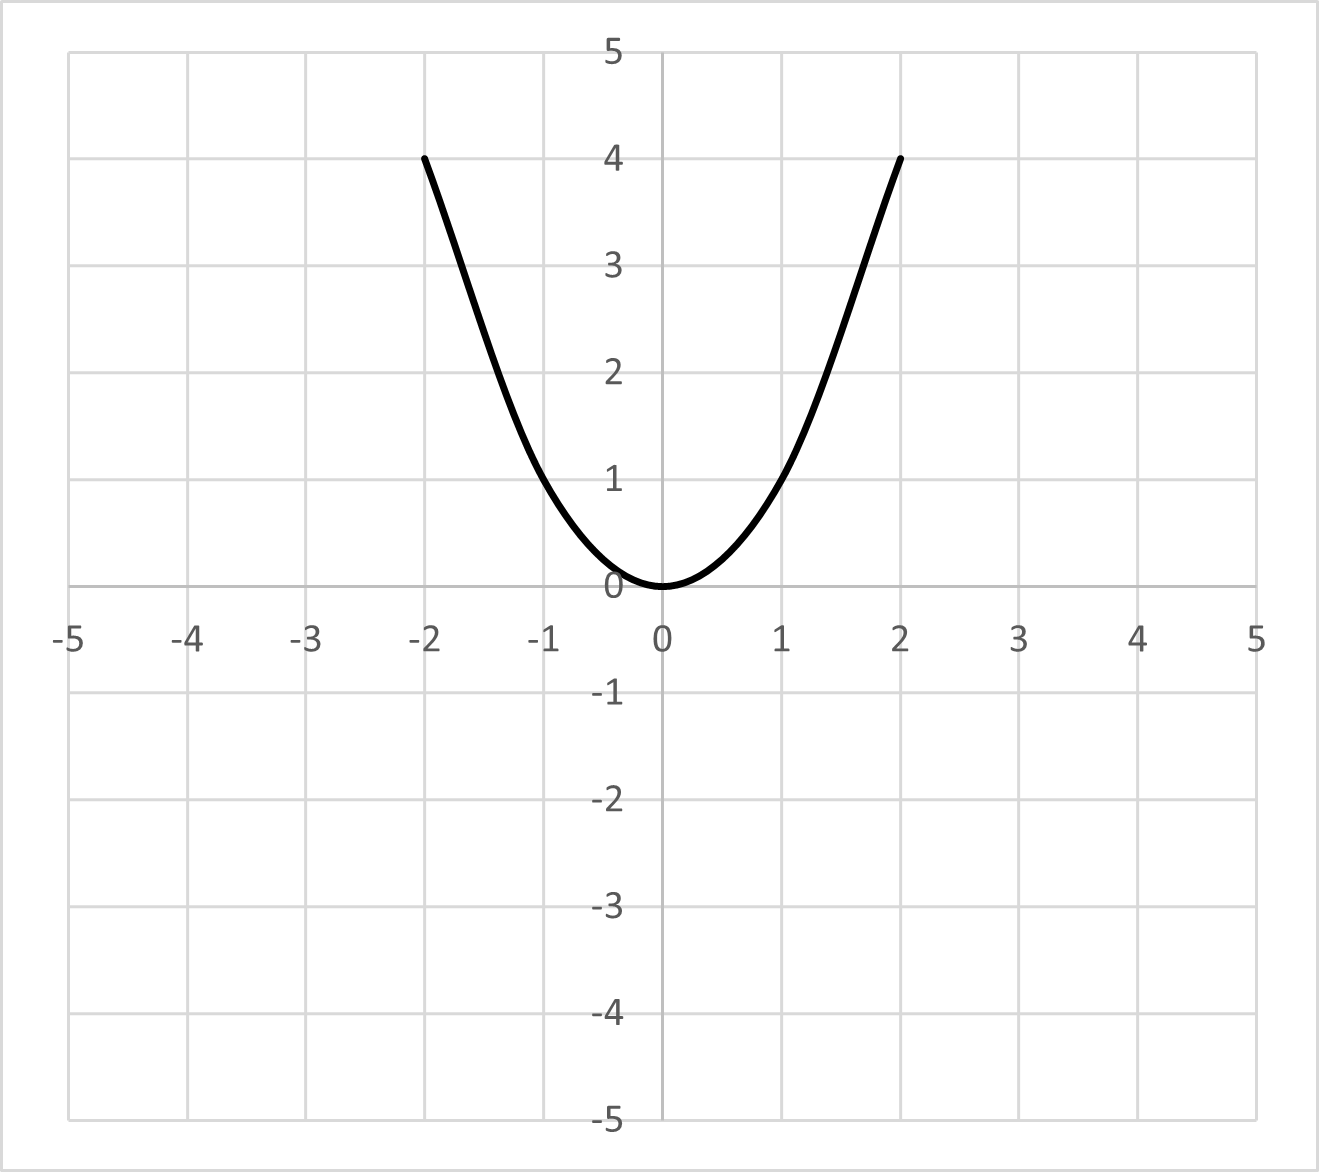
Quadratic
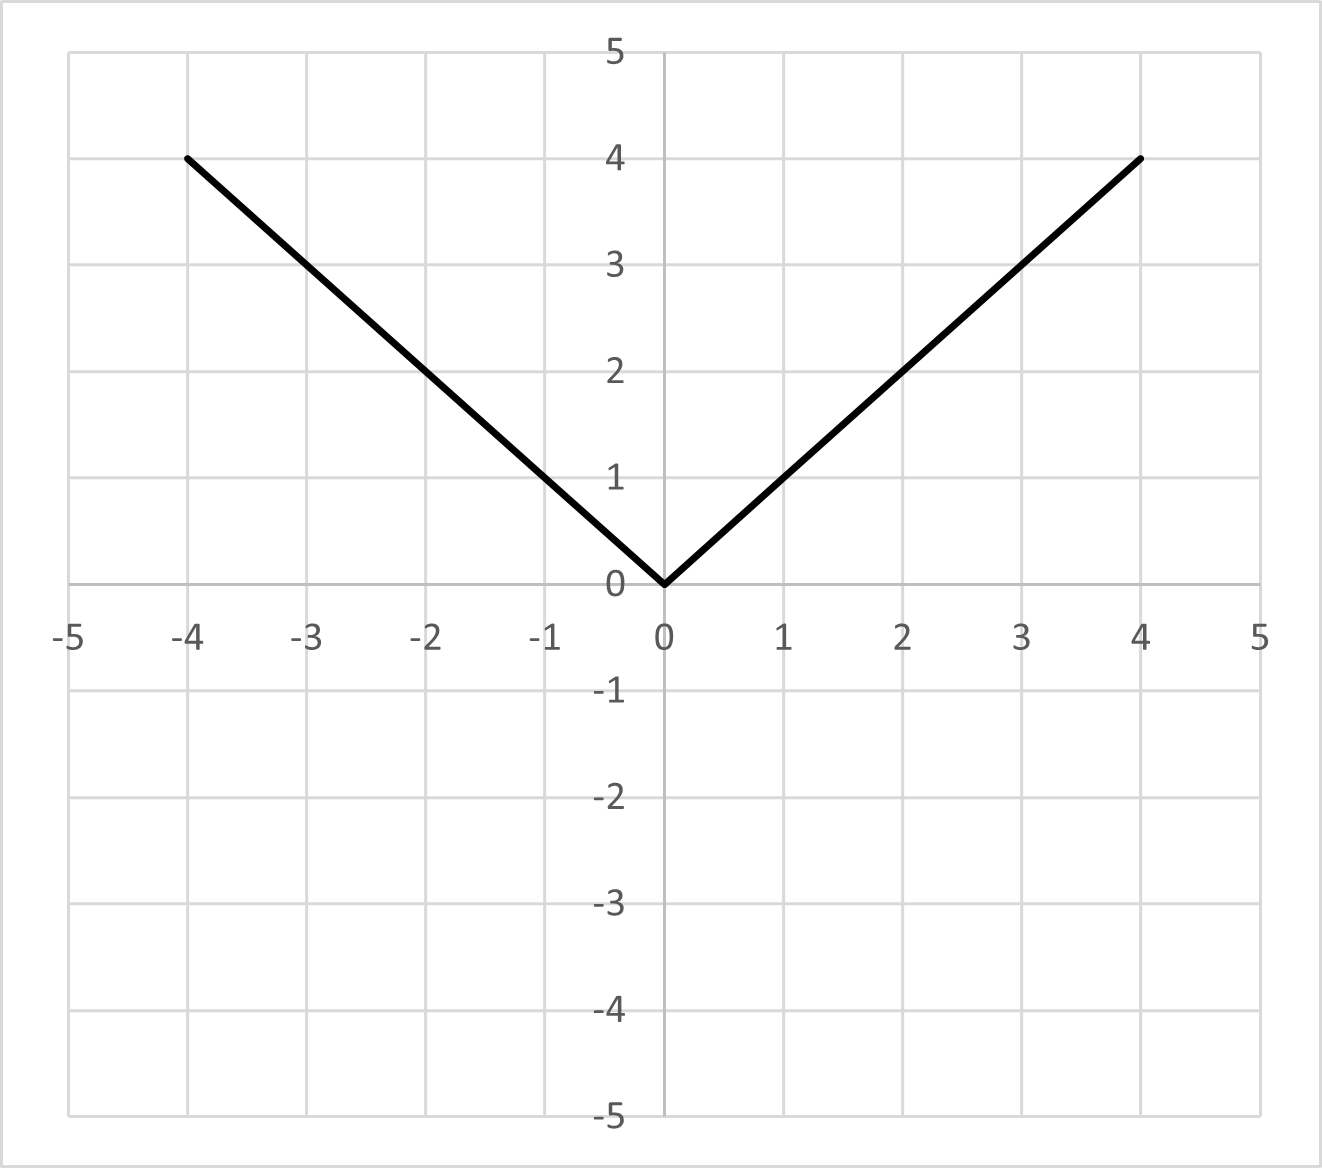
Absolute value
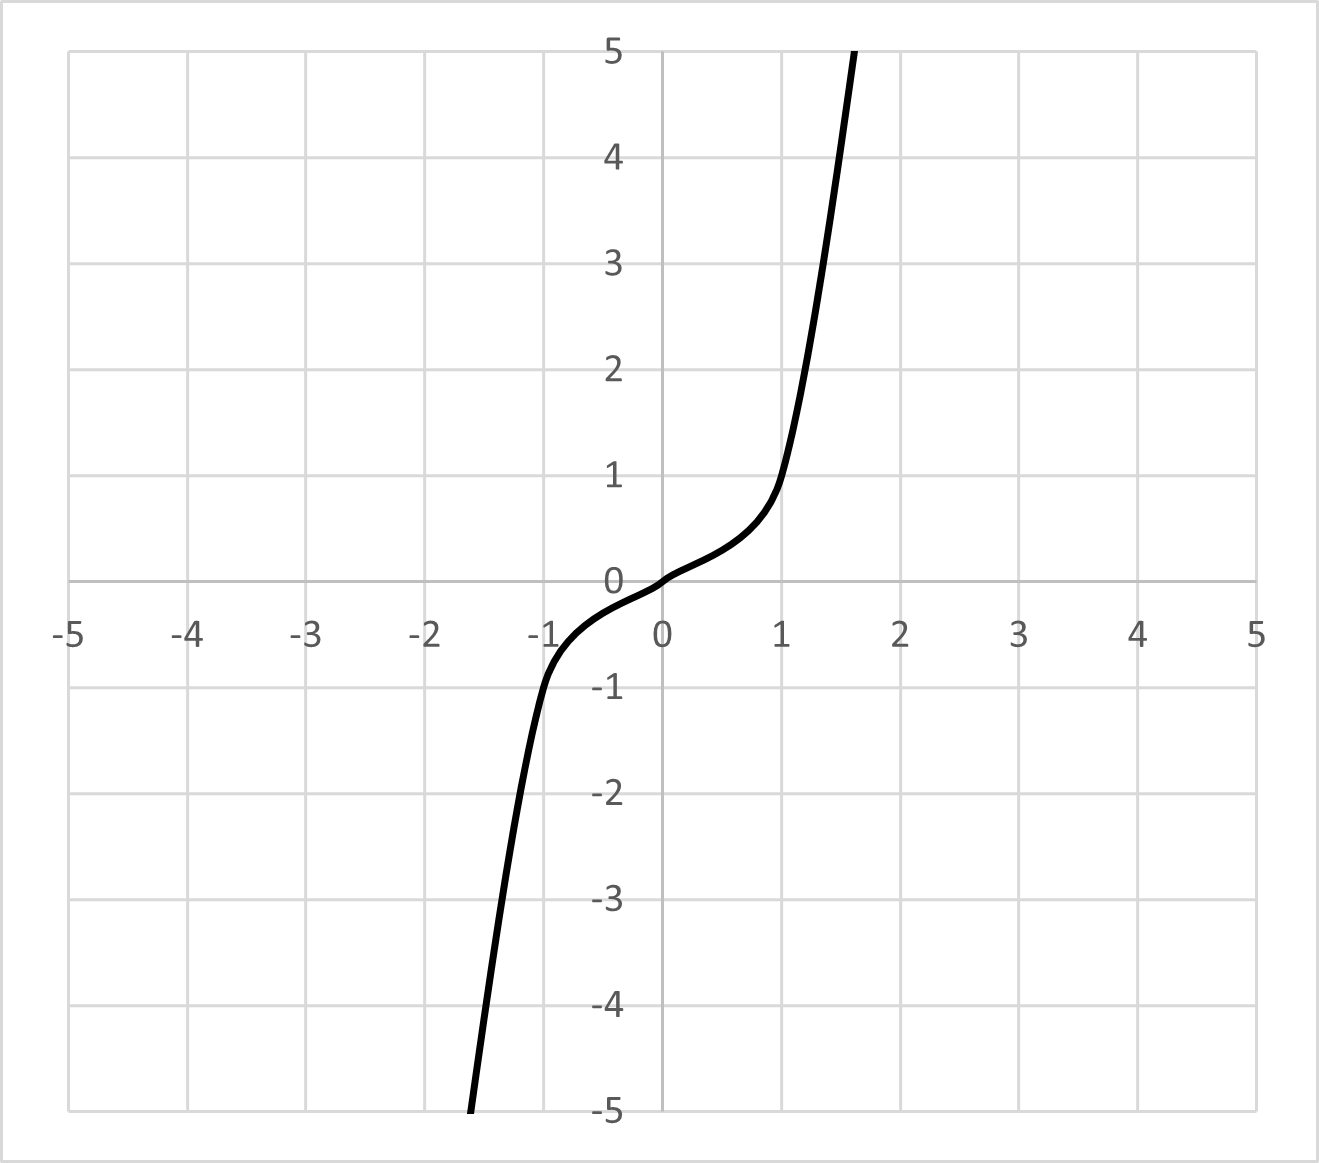
Cubic
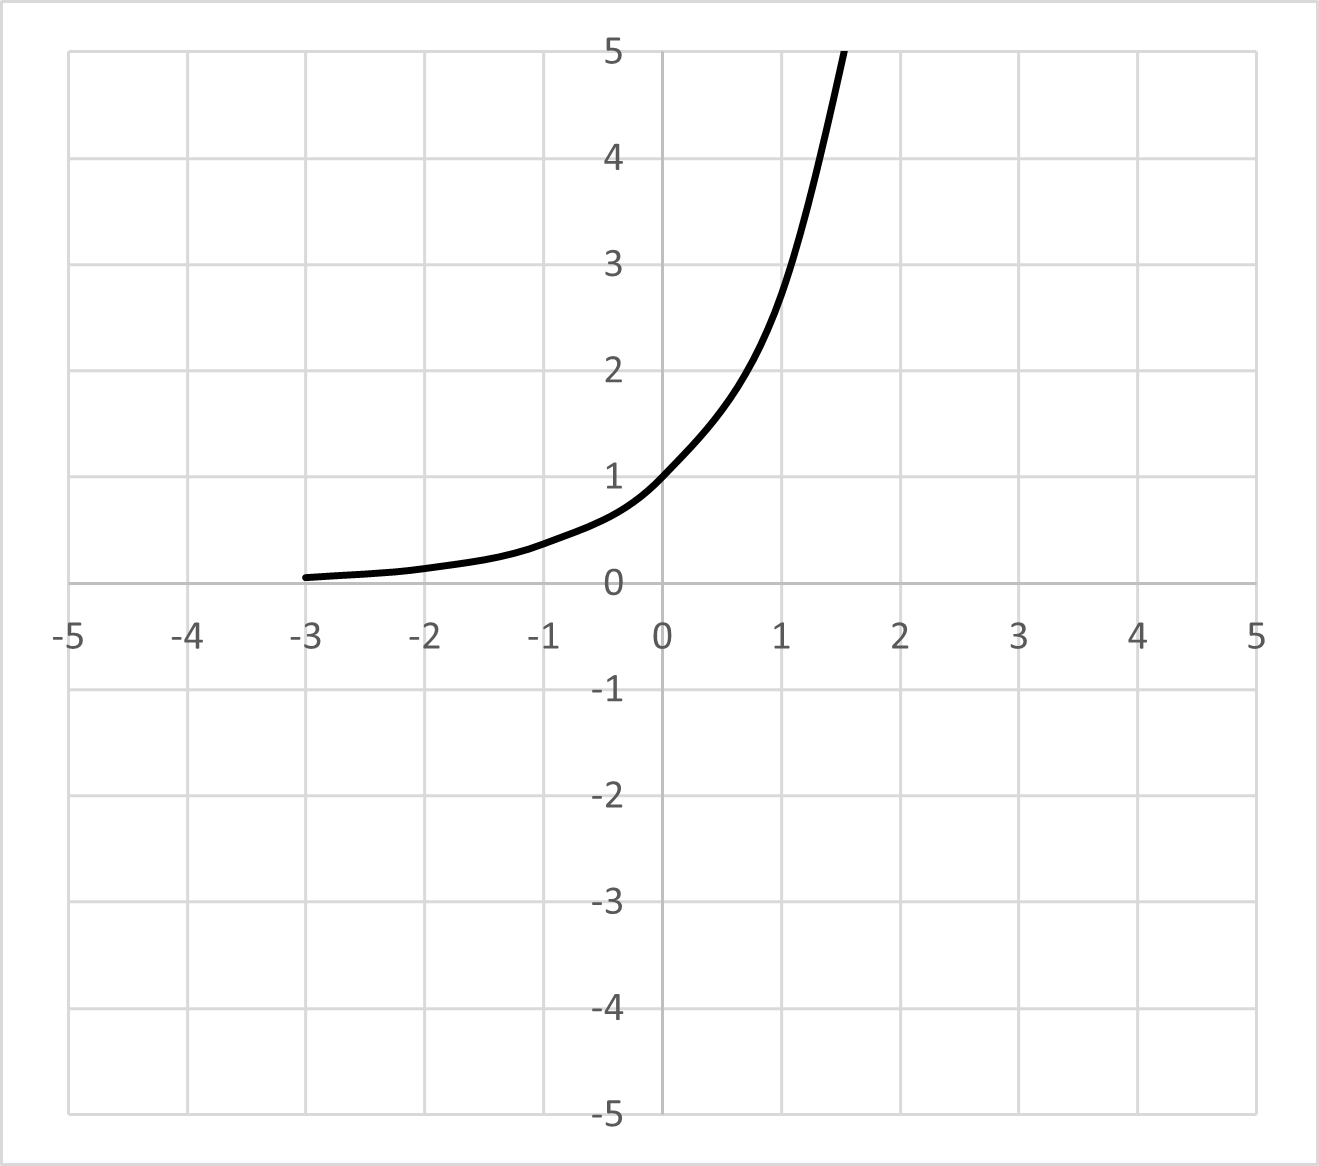
Exponential
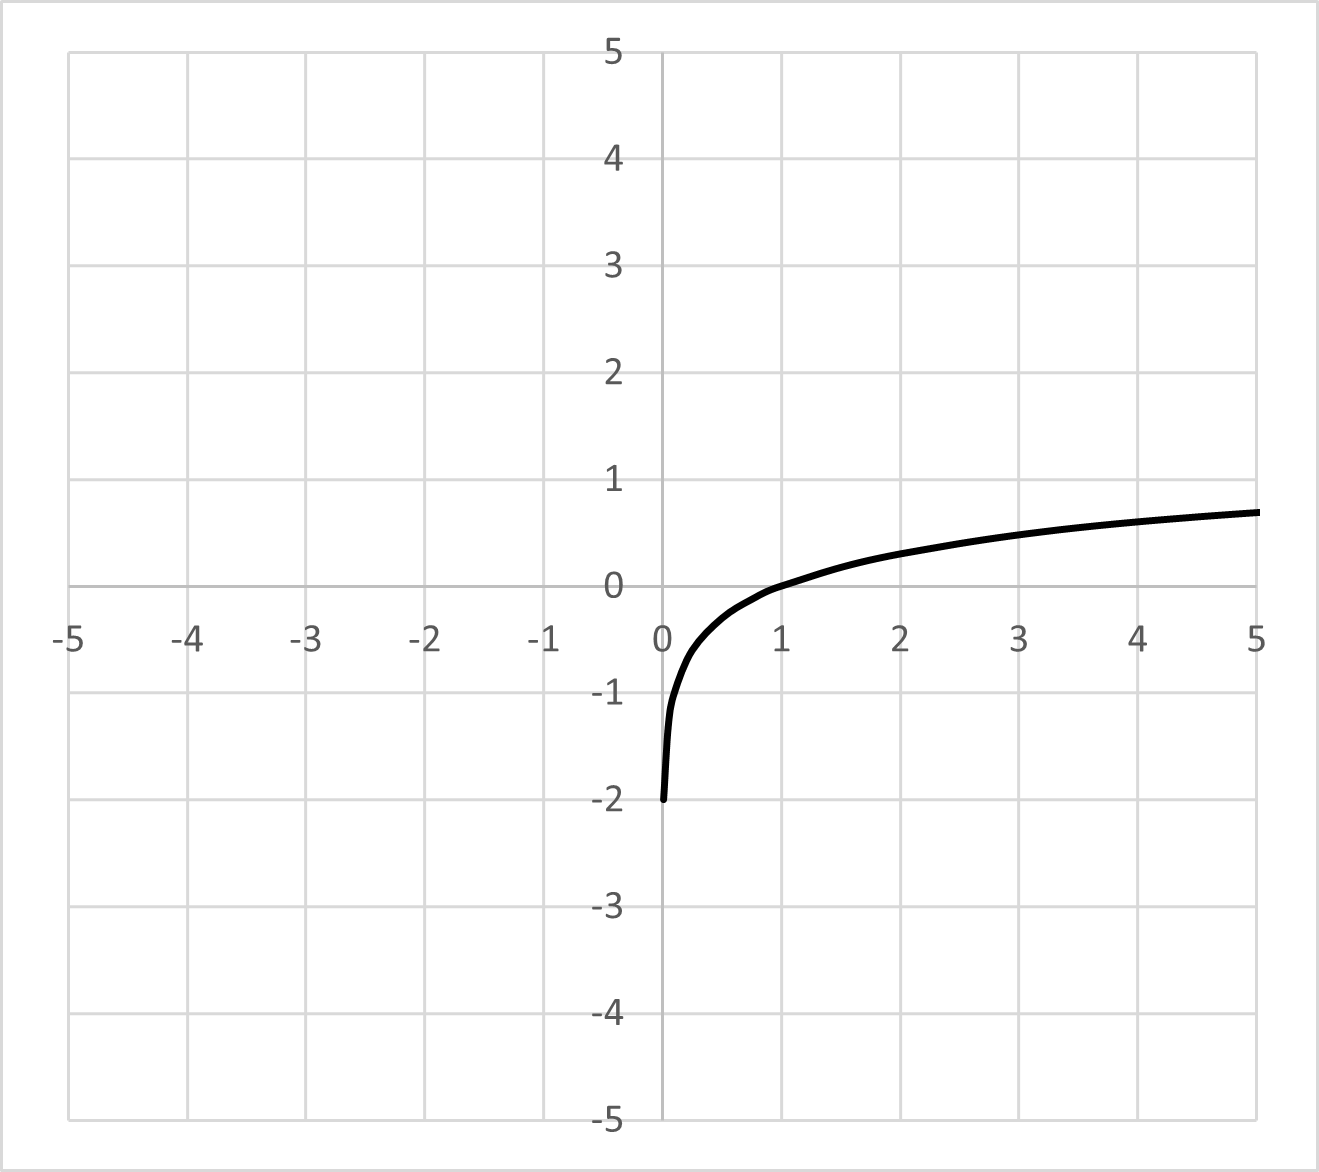
Logarithmic
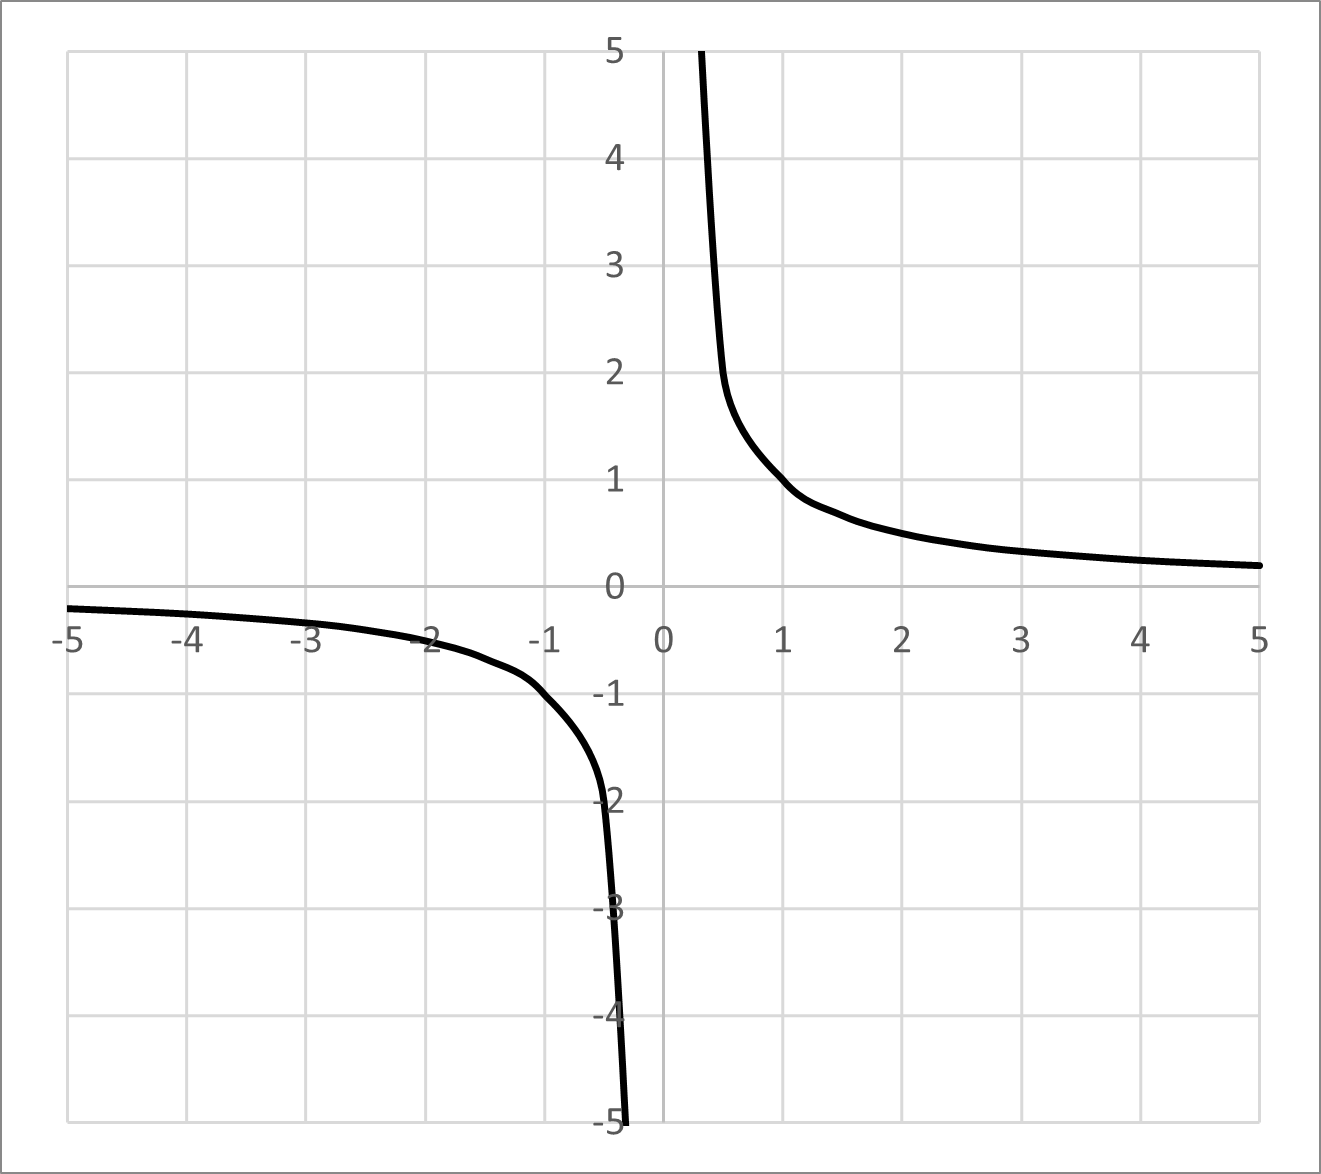
Fraction
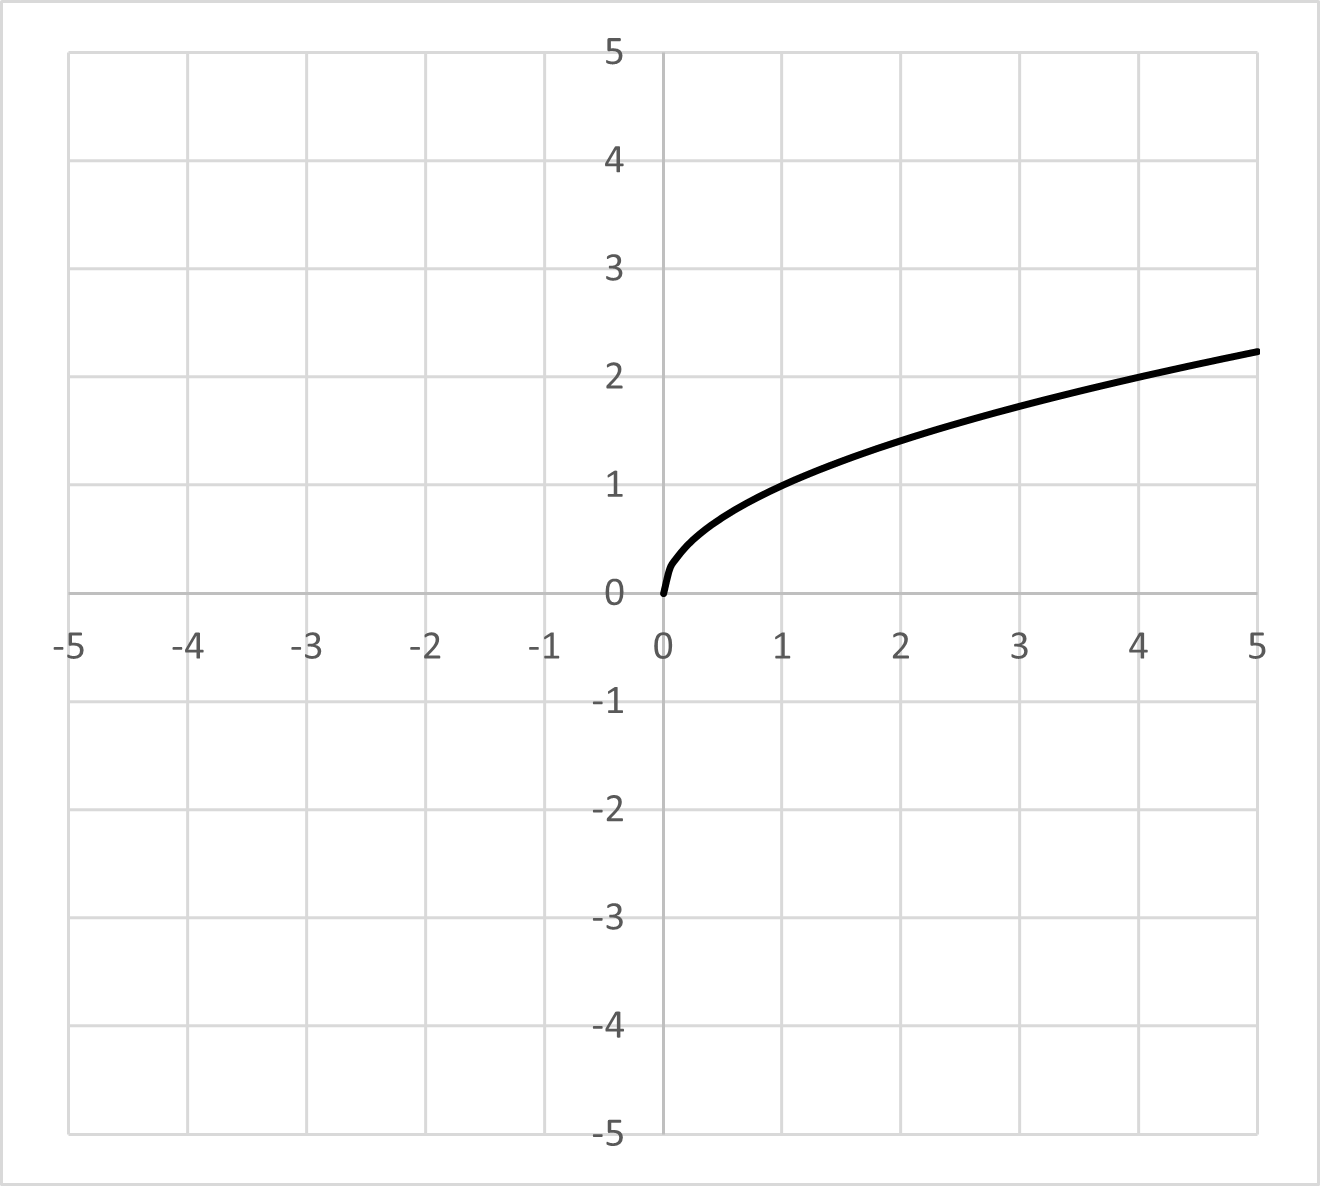
Square root
Transformations
Most of the time, you won’t be given a parent function directly. Instead, you’ll be given a function that’s a modified version of a parent function. These modified versions are called transformations of the parent function.
A good way to check a transformation is to graph it on a calculator. But you can also predict many transformations without a calculator, which helps you solve these problems faster.
The most basic movements - up, down, left, and right - are called translations.
Translations - vertical
Vertical movement compared to the parent graph depends on addition or subtraction outside the function. (The idea of “outside the function” will become clearer as you work through examples.) Here’s what a vertical translation looks like:
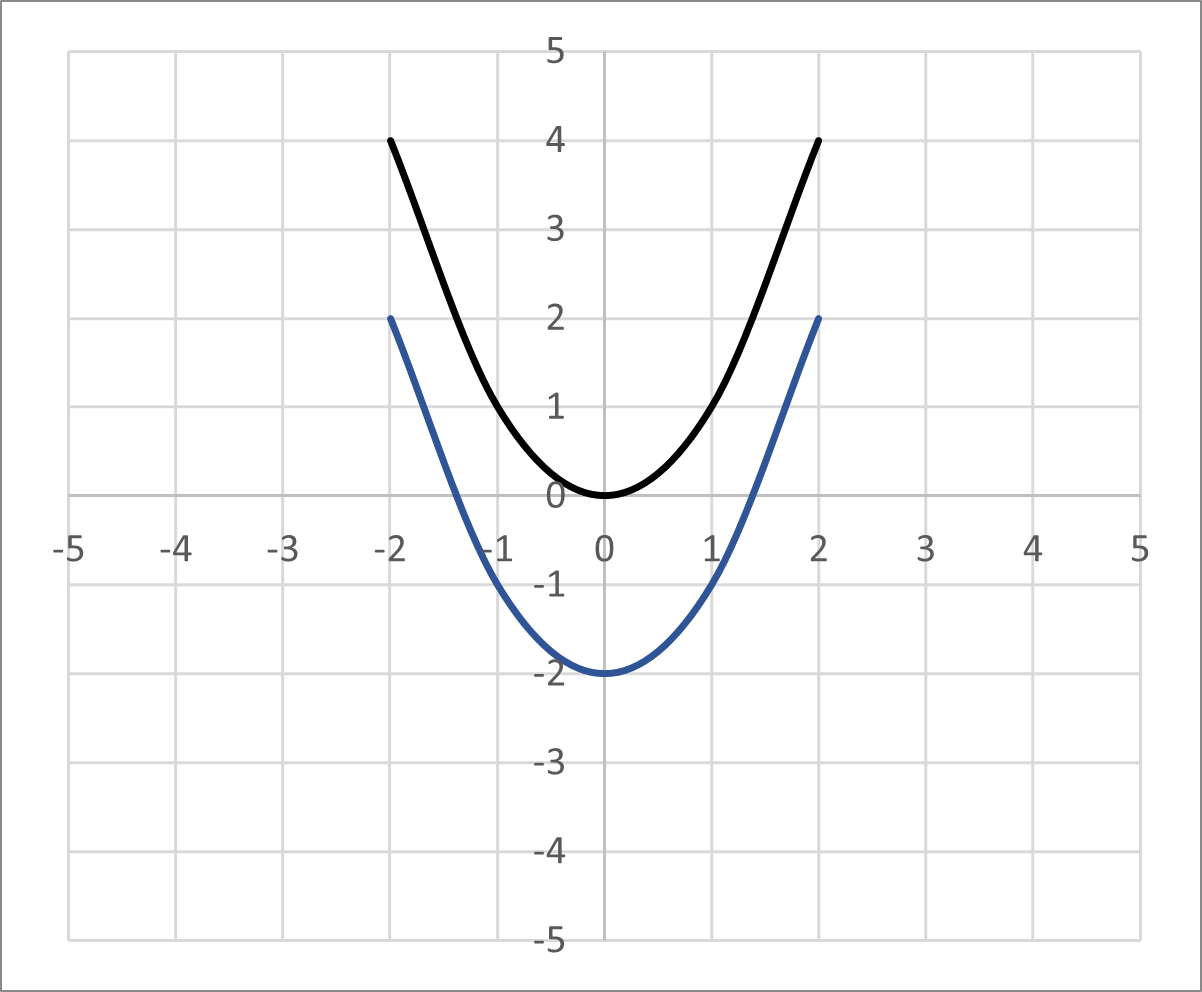
In the graph, the black curve is the parent quadratic function. The blue curve is the same shape, shifted downward by units.
- Subtracting outside the function shifts the graph down.
- Adding outside the function shifts the graph up.
So, the equation for the blue curve is .
If the equation were instead , the graph would be translated up units compared to the parent function.
Translations - horizontal
Horizontal movement compared to the parent graph is caused by addition or subtraction inside the function. For a quadratic function, this means the addition or subtraction is inside the expression being squared. For a square root function, it would be inside the radical. Here’s an example:
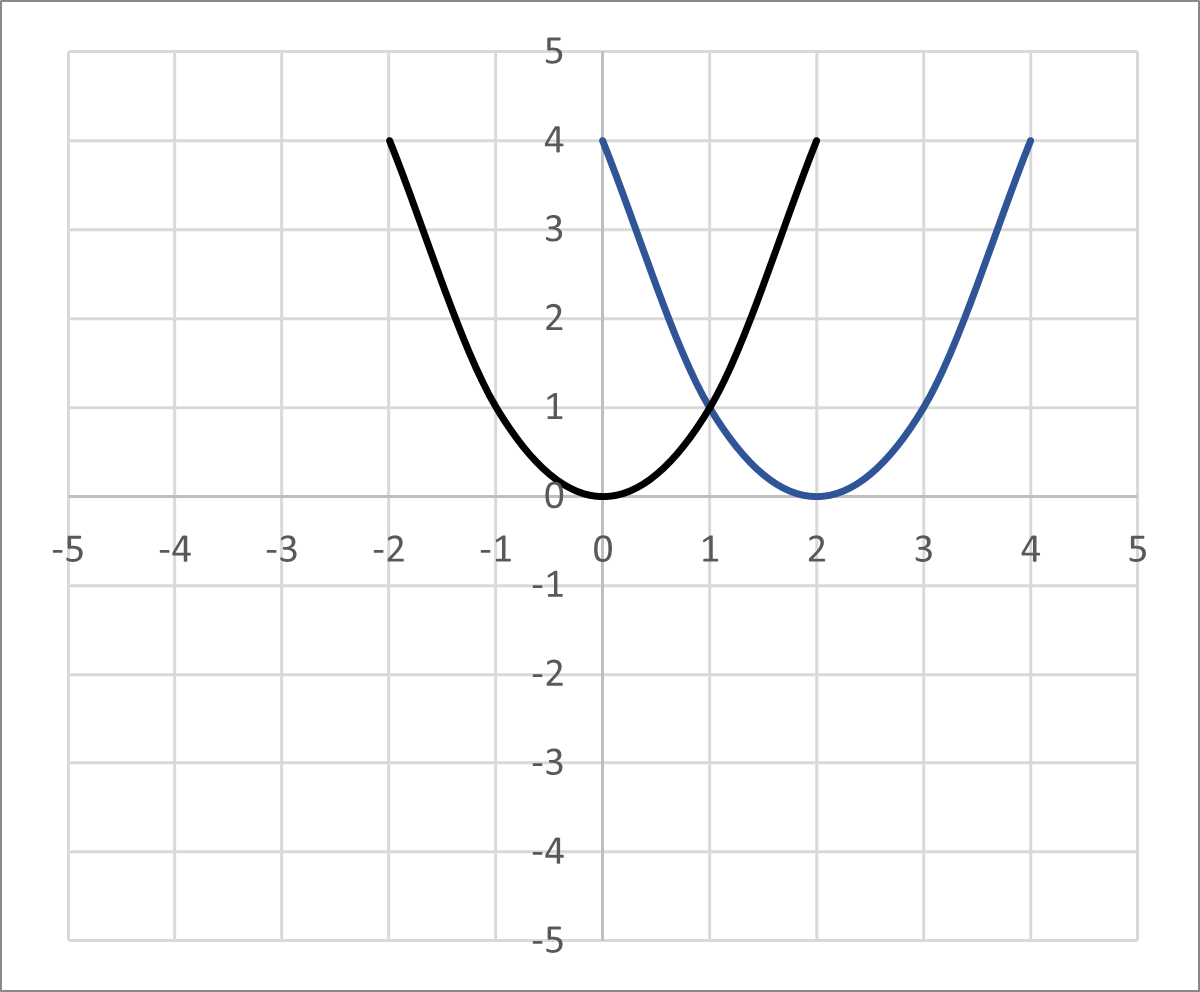
The blue curve has been translated units to the right, so its equation is . This is what “inside the function” means: the subtraction happens inside the expression being squared.
- Subtracting inside the function shifts the graph right.
- Adding inside the function shifts the graph left.
The fact that addition moves a graph left can feel backward at first, so it’s worth memorizing.
Reflection
A reflection happens when a graph is flipped over an axis. A common reflection occurs when the entire function is multiplied by , which reflects the graph over the -axis:
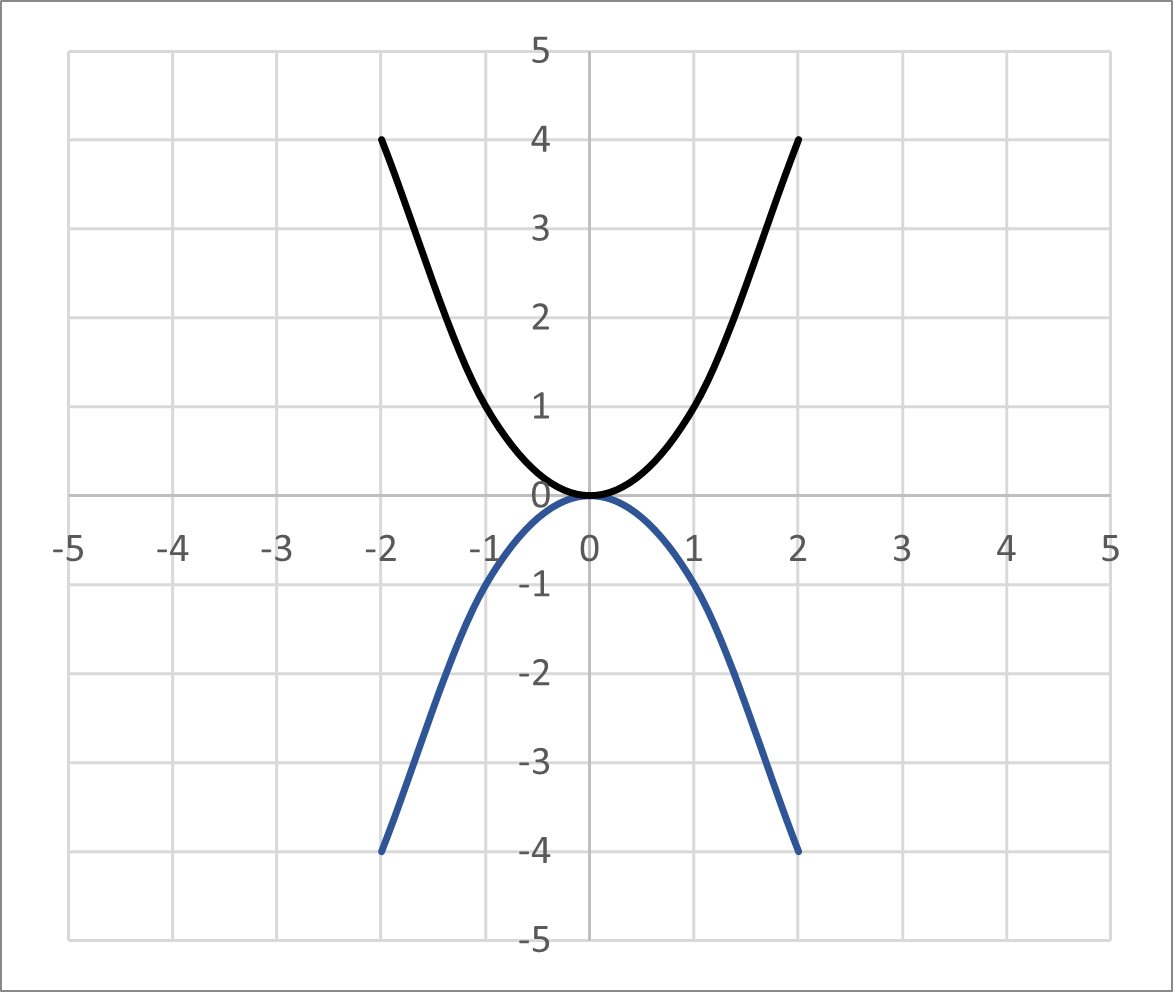
The equation for this graph is the negative of the parent quadratic function: .
Asymptotes
Asymptotes are imaginary lines that describe the boundaries a graph approaches but does not cross. Vertical and horizontal asymptotes help you describe certain parent functions more precisely and sketch graphs more accurately.
You can sometimes identify asymptotes from the graph, and other times you can find them directly from the equation.
Vertical asymptotes
A vertical asymptote is an imaginary vertical line that a graph cannot pass through. It describes how a function behaves as the input approaches a particular -value.
For example, the logarithmic graph drops sharply as gets closer to , but it never crosses the -axis. That happens because there is a vertical asymptote at .
To understand why, look at the function itself: is undefined. In general, vertical asymptotes often occur at -values that would make the function undefined.
You can find a vertical asymptote by finding the -values where the function is undefined. For a logarithm, that occurs at . Another common case is a fraction function.
Let’s find the vertical asymptotes of a fraction function:
What are the vertical asymptotes of the function below?
A fraction is undefined when its denominator equals . So your goal is to find the -values that make the denominator . Factor the quadratic in the denominator:
Now set each factor equal to :
So, the vertical asymptotes are at and . You can verify this by substituting either value into the original function and seeing that the denominator becomes , which makes the function undefined.
Horizontal asymptotes
Horizontal asymptotes describe what happens to a function as the input gets very large (positive or negative). You most often find horizontal asymptotes in fraction functions.
You determine a horizontal asymptote by comparing the highest exponential power (highest degree) in the numerator and denominator.
- If the highest power of the denominator is greater than that of the numerator, then the horizontal asymptote is .
- If the highest powers are equal, then the horizontal asymptote is the ratio of the coefficients of those highest-power terms.
- If the highest power of the numerator is greater than that of the denominator, then there is no horizontal asymptote.
The table below illustrates these conditions and gives an example of each:
| Condition (exponential powers) | Horizontal asymptote (HA) value | Example |
|---|---|---|
| Denominator > Numerator | HA at | \ Highest powers: \ HA at |
| Denominator = Numerator | HA at variable coefficient | \ Highest powers: \ HA at |
| Denominator < Numerator | No HA | \ Highest powers: \ No HA |