Graphing inequalities
An equation with and (like ) graphs as a line on the coordinate plane. If you replace the equal sign with an inequality, the boundary line stays the same, but the meaning changes.
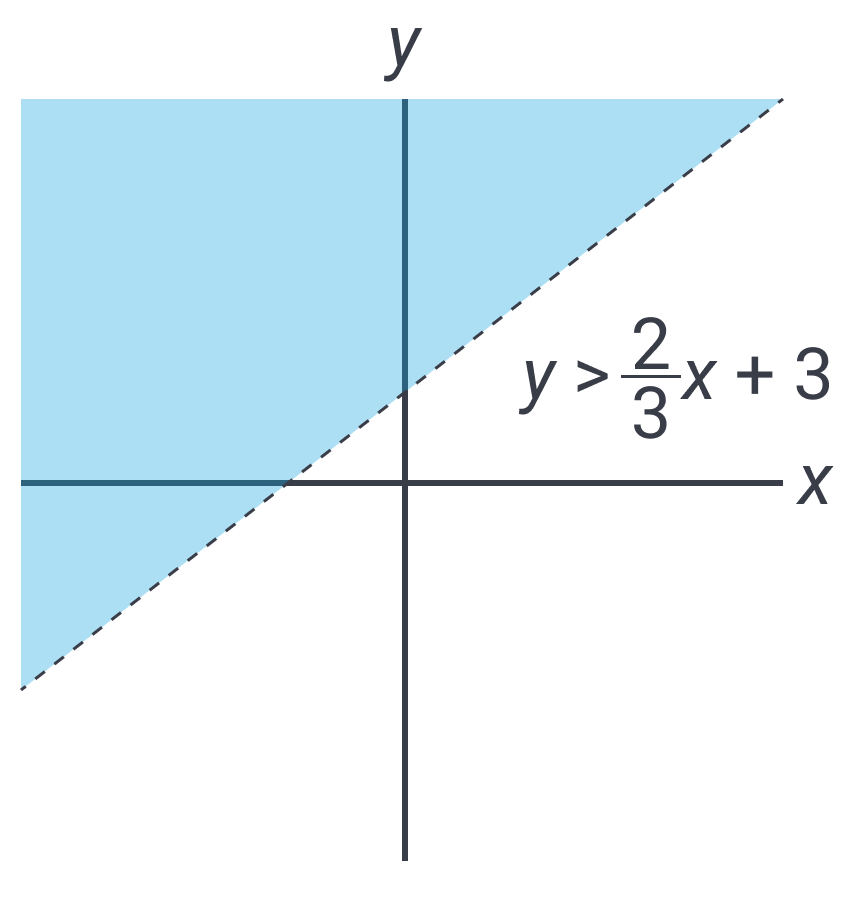
With an inequality, the solutions aren’t just the points on the line. Instead, the solutions form a region on one side of the line - either above it or below it. For example, this inequality is written in the same style as , but its solutions are all the points above the line rather than on the line.
It’s usually straightforward to decide which side of the line to shade.
- First, rewrite the inequality in a form like .
- Then use the inequality symbol:
- If the inequality is or , shade above the line.
- If the inequality is or , shade below the line.
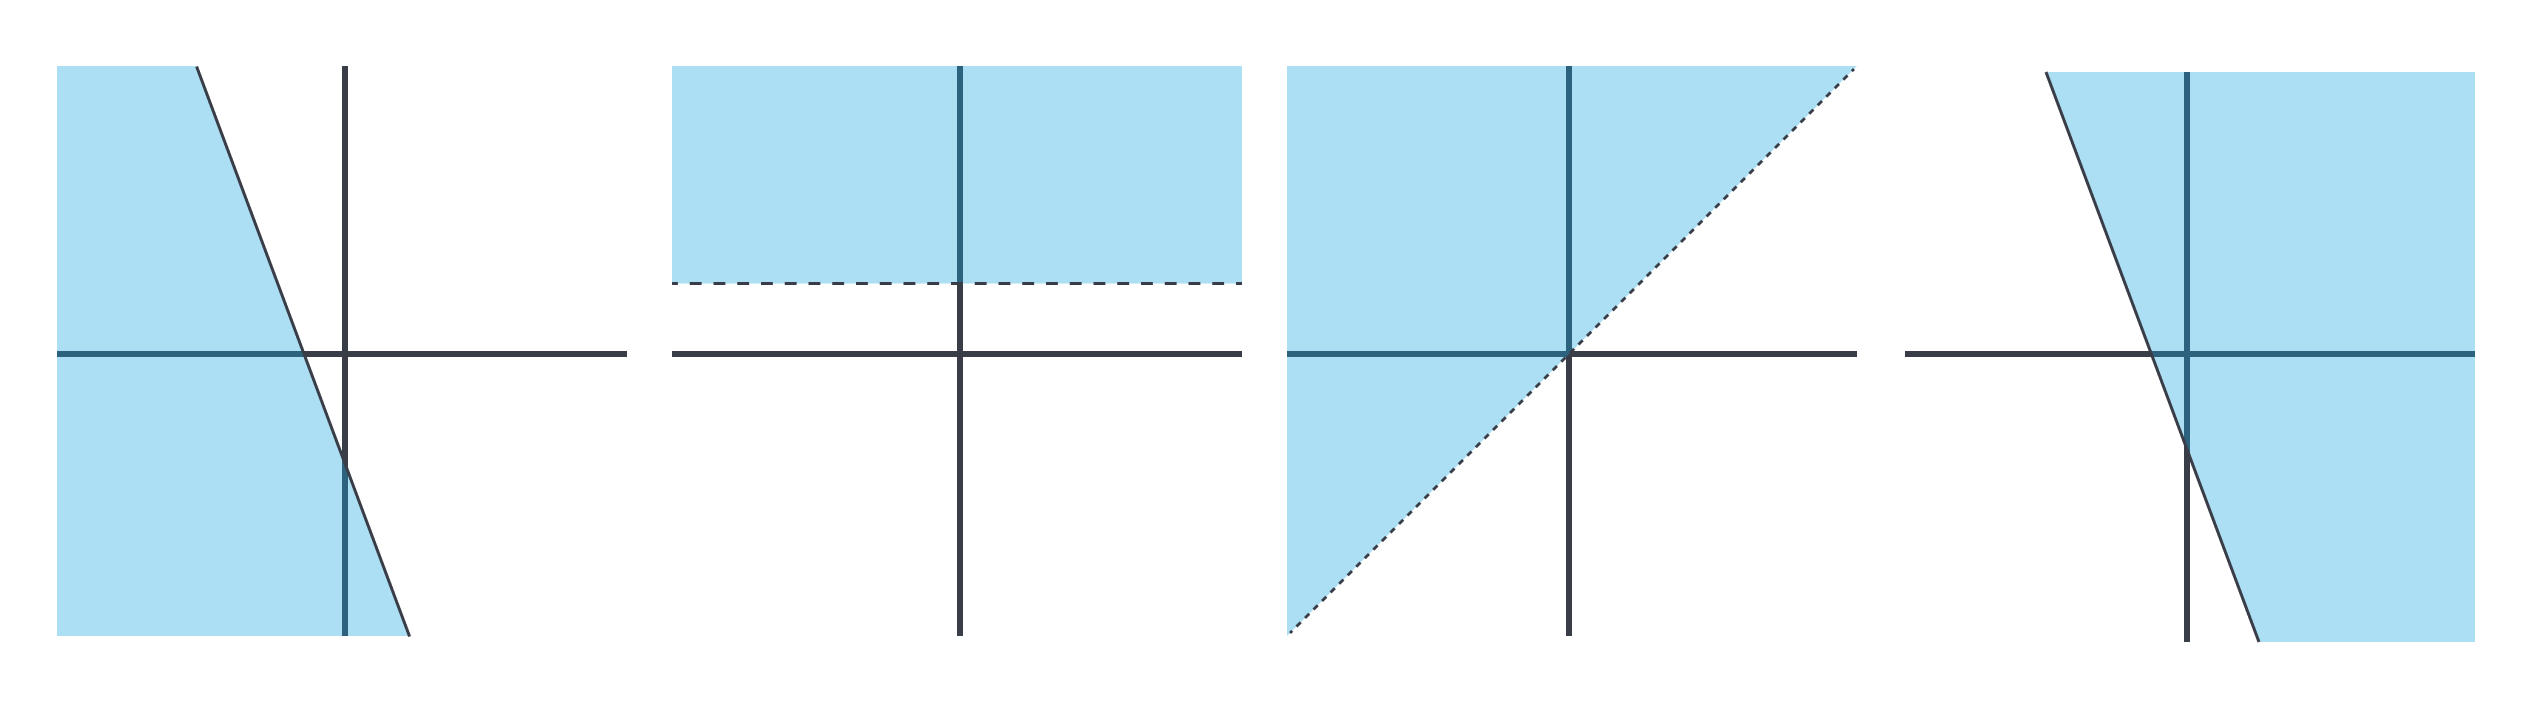
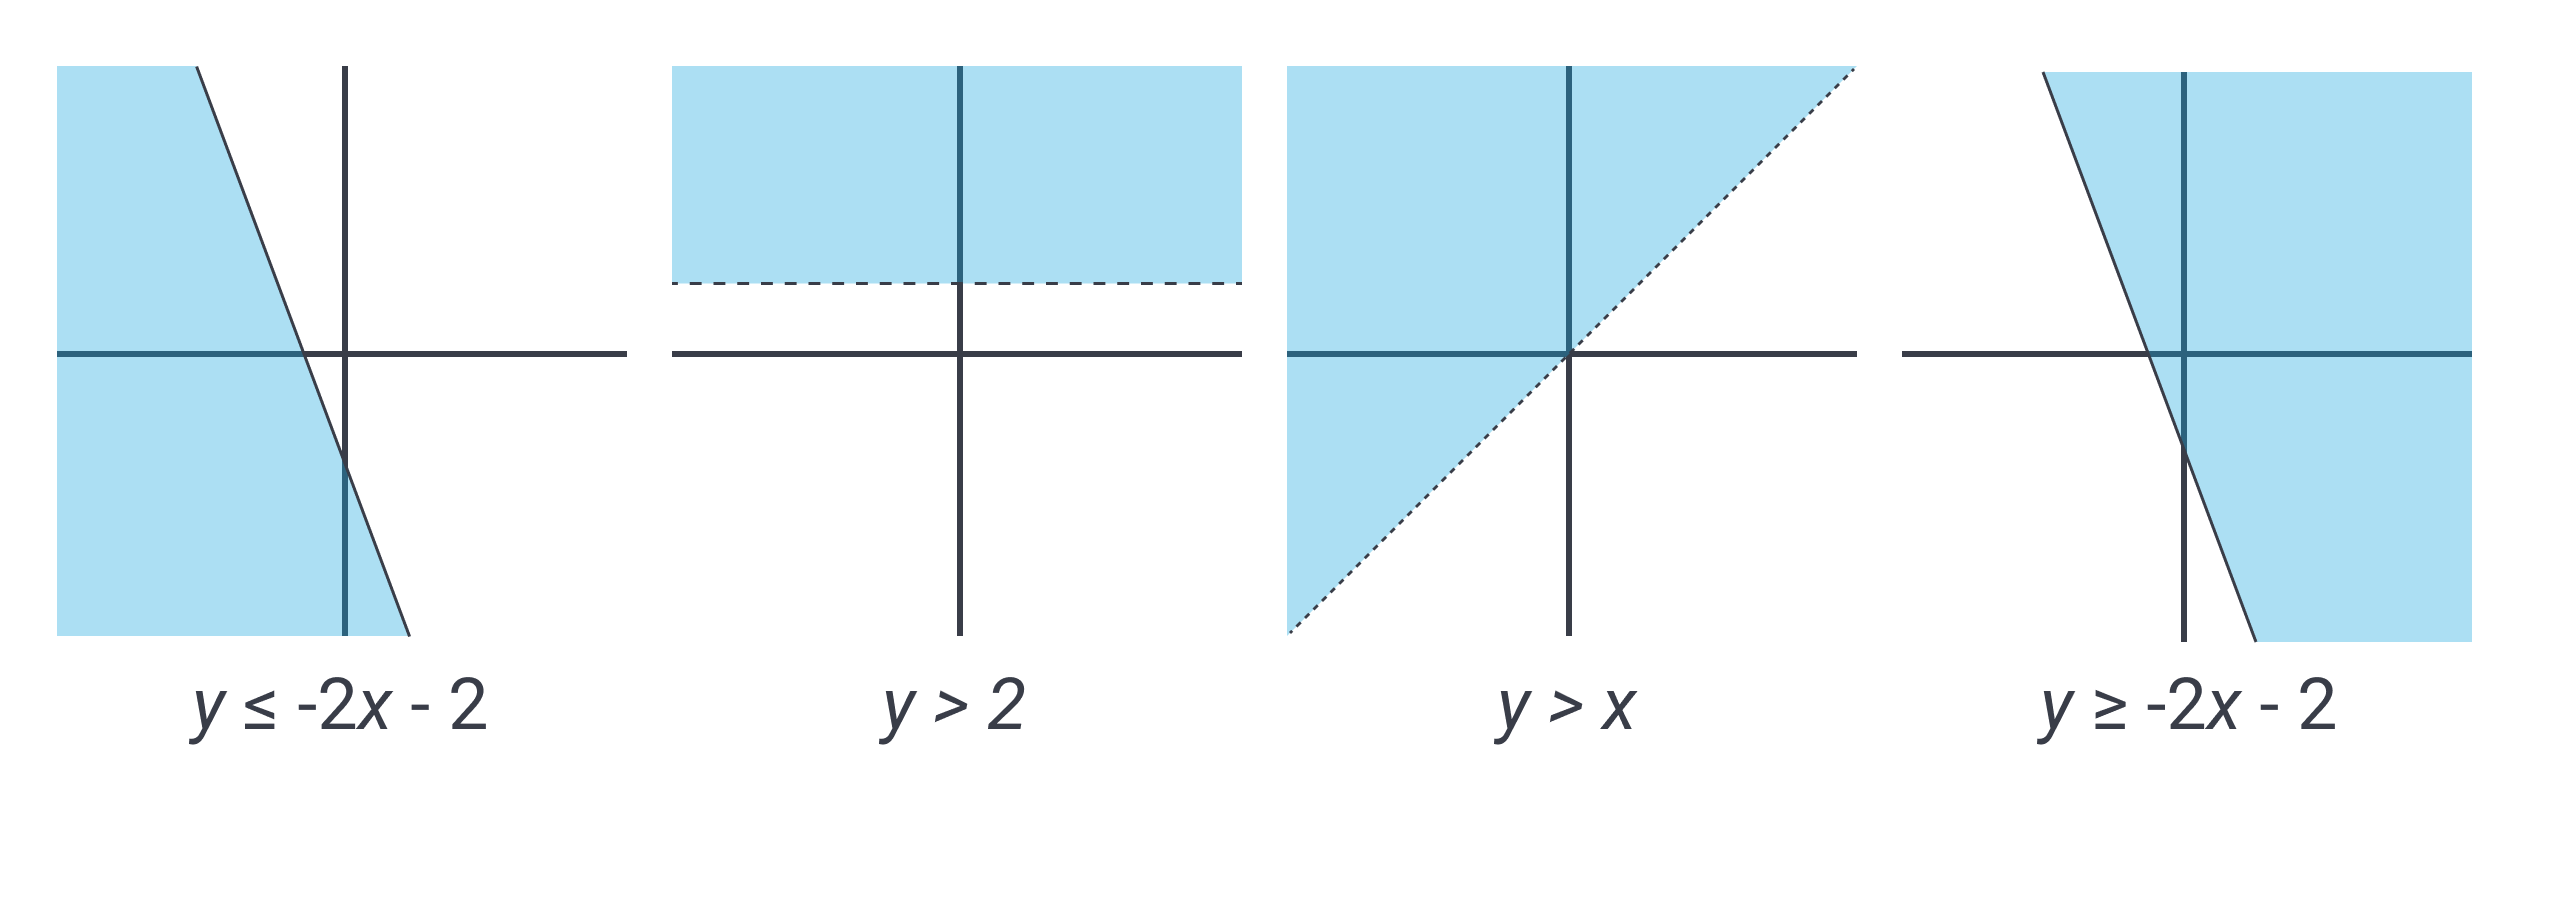
Try to match each inequality with a graph drawn below.
Answers:
Now try this GRE-level practice problem that uses the idea of graphing inequalities.
In which quadrants does the intersection of both inequalities exist? (Select all that apply.)
A. Quadrant I
B. Quadrant II
C. Quadrant III
D. Quadrant IV
Answer: A, C, D
Explanation:
Start by graphing both inequalities.
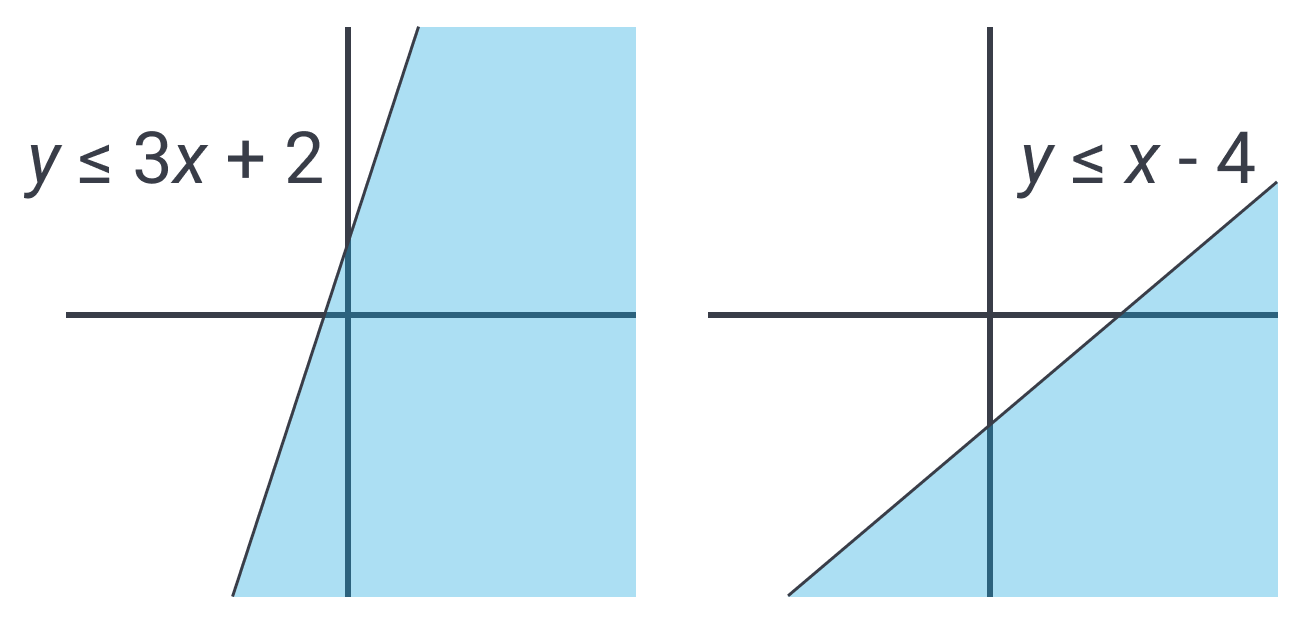
The first inequality’s shaded region appears in all four quadrants (if you look closely, you can see that it barely touches quadrant II). The second inequality’s shaded region appears only in quadrants I, III, and IV.
The intersection is the region that satisfies both inequalities, so it can only occur in quadrants that both shaded regions share. Therefore, the intersection exists in quadrants I, III, and IV.
For context, the union would represent all quadrants where either inequality has solutions. If the question asked for the union instead of the intersection, all four answer choices would be correct.