Collars
A collar, sometimes called a hedge wrapper, combines two ideas you’ve already seen: hedging and income strategies. Specifically, it combines a long stock hedge strategy with a covered call.
A collar, in specific terms, is:
- Short call (“out of the money”)
- Long stock
- Long put (“out of the money”)
The key position in a collar is the long stock. As with hedging and income strategies, the stock is the “dominant” part of the position. The stock’s market price drives the overall return and determines whether either option will be exercised.
Let’s look at an example:
Short 1 ABC Jan 45 call @ $3
Long 100 shares of ABC stock @ $40
Long 1 ABC Jan 35 put @ $3
The long put provides hedge protection for the long stock, even though it starts “out of the money.” If the market price falls below $35, the investor can exercise the put and sell the shares at $35. That protection isn’t free: the put costs $3 per share, or $300 total.
In this example, the put’s $300 cost is offset by the $300 premium received from selling the call. That’s why collars are sometimes described as “free” (or cheap) insurance.
That call premium comes with a tradeoff. A short call creates an obligation to sell stock at the strike price if the call is assigned.
- If the market price rises above $45, the short call becomes “in the money” and will be assigned.
- No matter how high the market price goes, the investor’s best possible sale price is $45.
So, the investor is effectively paying for the $300 put hedge with the $300 call premium, and in exchange they accept a “ceiling” on the stock at $45.
Let’s work through a few examples to see how collars behave at different market prices.
An investor buys 100 shares of ABC stock at $40, goes short 1 ABC Jan 45 call at $3, and long 1 ABC Jan 35 put at $3 when the market price is $40. What is the gain or loss if the market rises to $75?
Answer = $500 gain
| Action | Result |
|---|---|
| Buy shares | -$4,000 |
| Sell call | +$300 |
| Buy put | -$300 |
| Call assigned - sell shares | +$4,500 |
| Total | +$500 |
At $75, the call is “in the money” (“call up”) and the put is “out of the money” (“put down”). The put expires worthless, and the call is assigned, forcing the ABC shares to be sold at $45.
- Stock gain: buy at $40, sell at $45 = $5 per share = $500
- Option premiums: +$300 (call) and -$300 (put) offset to $0
So the overall profit is $500.
The investor reaches maximum gain once the market rises to $45 or higher. Because of the short call obligation, the best possible sale price is $45. Whether the market price goes to $45 or $45,000, the investor is locked into a $5 per share gain.
This also shows the strategy’s tradeoff. Without the options, the stock would’ve gained $35 per share (from $40 to $75), or $3,500 total. If the investor had bought the put but not sold the call, the result would’ve been $32 per share ($35 stock gain minus the $3 put premium), or $3,200 total.
Selling the call limits upside. Gains above $45 are given up, which is an example of opportunity cost (a concept from the income strategies section).
What if the market rises by a small amount?
An investor buys 100 shares of ABC stock at $40, goes short 1 ABC Jan 45 call at $3, and long 1 ABC Jan 35 put at $3 when the market price is $40. What is the gain or loss if the market rises to $42?
Answer = $200 gain
| Action | Result |
|---|---|
| Buy shares | -$4,000 |
| Sell call | +$300 |
| Buy put | -$300 |
| Share value | +$4,200 |
| Total | +$200 |
At $42, both the short call and long put are “out of the money,” so both expire worthless.
- Stock gain: $40 to $42 = $2 per share = $200
- Option premiums: +$300 and -$300 offset to $0
When the market is between $35 and $45, both options are “out of the money” and expire worthless. With the premiums offsetting each other, the overall gain or loss comes entirely from the stock.
What happens if the market is flat?
An investor buys 100 shares of ABC stock at $40, goes short 1 ABC Jan 45 call at $3, and long 1 ABC Jan 35 put at $3 when the market price is $40. What is the gain or loss if the market stays at $40?
Answer = $0 (breakeven)
| Action | Result |
|---|---|
| Buy shares | -$4,000 |
| Sell call | +$300 |
| Buy put | -$300 |
| Sell value | +$4,000 |
| Total | $0 |
At $40, both options are “out of the money” and expire worthless. The shares are still worth $40, so there’s no stock gain or loss. Because the call and put premiums offset each other, the investor breaks even.
Again, when the market is between $35 and $45, both options are “out of the money” and expire worthless. With the premiums offsetting each other, the overall gain or loss is tied to the stock.
What happens if the market falls by a small amount?
An investor buys 100 shares of ABC stock at $40, goes short 1 ABC Jan 45 call at $3, and long 1 ABC Jan 35 put at $3 when the market price is $40. What is the gain or loss if the market falls to $37?
Answer = $300 loss
| Action | Result |
|---|---|
| Buy shares | -$4,000 |
| Sell call | +$300 |
| Buy put | -$300 |
| Sell value | +$3,700 |
| Total | -$300 |
At $37, both options are still “out of the money” and expire worthless.
- Stock loss: $40 to $37 = $3 per share = $300
- Option premiums: +$300 and -$300 offset to $0
Once again, with the stock price between $35 and $45, both options expire worthless. With the premiums offsetting each other, the overall gain or loss comes from the stock.
What happens if the market falls significantly?
An investor buys 100 shares of ABC stock at $40, goes short 1 ABC Jan 45 call at $3, and long 1 ABC Jan 35 put at $3 when the market price is $40. What is the gain or loss if the market falls to $10?
Answer = $500 loss
| Action | Result |
|---|---|
| Buy shares | -$4,000 |
| Sell call | +$300 |
| Buy put | -$300 |
| Exercise put - sell shares | +$3,500 |
| Total | -$500 |
At $10, the put is “in the money” (“put down”) and the call is “out of the money” (“call up”). The call expires worthless, and the investor exercises the put, selling the shares at $35.
- Stock loss: buy at $40, sell at $35 = $5 per share = $500
- Option premiums: +$300 and -$300 offset to $0
So the overall loss is $500.
This example shows the main benefit of a collar. The market fell dramatically, but the long put allowed the investor to sell at $35 instead of $10. Without the put, the investor would’ve lost $30 per share (from $40 to $10), or $3,000 total.
The long put provides the hedge, and the call premium offsets the put cost. When the market price falls to or below the put’s strike price, the investor reaches maximum loss.
For visual learners, options payoff charts can help you see the strategy’s “big picture.” Here’s the same example again:
Long 100 shares of ABC stock @ $40
Short 1 ABC Jan 45 call @ $3
Long 1 ABC Jan 35 put @ $3
Here’s the payoff chart:
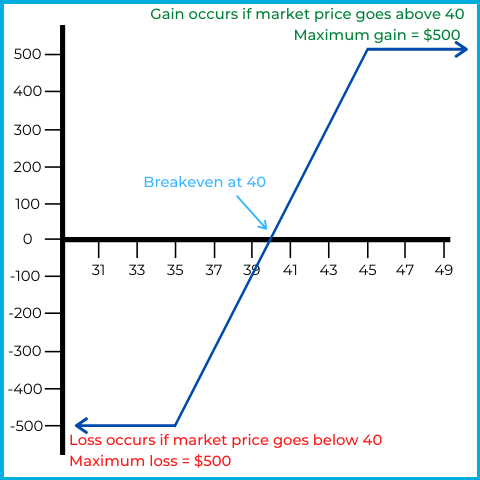
The horizontal axis represents the market price of ABC stock, while the vertical axis represents overall gain or loss.
As the payoff chart shows:
- Between $35 and $45, gains and losses vary with the stock price, with breakeven at $40.
- Below $35, the investor has a locked-in loss of $500, no matter how low the market price falls.
- Above $45, the investor has a locked-in gain of $500, no matter how high the market price rises.
The last two examples show what happens when the investor closes the option contracts and sells the shares at the market price.
An investor buys 100 shares of ABC stock at $40, goes short 1 ABC Jan 45 call at $3, and long 1 ABC Jan 35 put at $3 when the market price is $40. The market price rises to $50, the contracts are closed at intrinsic value, and the shares are sold at the market price. What is the gain or loss?
Answer = $500 gain
| Action | Result |
|---|---|
| Buy shares | -$4,000 |
| Sell call | +$300 |
| Buy put | -$300 |
| Close call | -$500 |
| Close put | $0 |
| Sell shares | +$5,000 |
| Total | +$500 |
At $50:
- The call is “in the money” (has intrinsic value) - “call up.” Closing it requires a purchase at its intrinsic value of $5.
- The put is “out of the money” (no intrinsic value) - “put down.” Closing it results in a sale at $0.
Option results:
- Short call: sold at $3, bought to close at $5 = $2 per share loss = $200
- Long put: bought at $3, sold to close at $0 = $3 per share loss = $300
Total options loss = $500.
Stock results:
- Stock gain: $40 to $50 = $10 per share = $1,000
Combine them:
- $1,000 stock gain - $500 options loss = $500 overall gain
Let’s try one last example involving closing the option contracts and selling the shares:
An investor buys 100 shares of ABC stock at $40, writes 1 ABC Jan 45 call at $3, and holds 1 ABC Jan 35 put at $3 when the market price is $40. The market price falls to $36, the contracts are closed at intrinsic value, and the shares are sold at the market price. What is the gain or loss?
Answer = $400 loss
| Action | Result |
|---|---|
| Buy shares | -$4,000 |
| Sell call | +$300 |
| Buy put | -$300 |
| Close call | $0 |
| Close put | $0 |
| Sell shares | +$3,600 |
| Total | -$400 |
At $36, both options are “out of the money” and have no intrinsic value.
- Closing the call requires a purchase at $0.
- Closing the put results in a sale at $0.
Option results:
- Short call: sold at $3, bought to close at $0 = $3 per share gain = $300
- Long put: bought at $3, sold to close at $0 = $3 per share loss = $300
The gain and loss offset, so the options break even overall.
Stock results:
- Stock loss: $40 to $36 = $4 per share = $400
With the options breaking even, the strategy’s final result is a $400 loss.
To summarize, collars let investors offset the cost of a hedge on a long stock position. The tradeoff is that the strategy limits both large losses and large gains.
- If the market falls far enough, the put can be exercised, allowing the investor to sell shares at the put strike price.
- If the market rises far enough, the call can be assigned, forcing the investor to sell shares at the call strike price.
A “dog collar” analogy can help you remember the structure. A dog’s collar attaches to a leash, which limits how far the dog can move away.
A collar on a stock position works similarly:
- The stock can’t fall too far without the put being exercised.
- The stock can’t rise too far without the call being assigned.
In the examples above, the investor’s effective sale price is limited to a range ($35-$45).