



Reserves market
Understanding the operations of monetary policy in the United States, requires more than the money supply expansion modeling that was covered earlier. The process of deposits leading to loans and determining the money supply is loosely correct. Modern treatments focus on the market for reserves, a market that the Fed has substantial control over.
The market for reserves is an overnight lending market, presented with the quantity of reserves on the x-axis and nominal interest rates on the y-axis. Once we outline the supply and demand, the resulting equilibrium level of the interest rate will be the policy rate, which for the Federal Reserve is the federal funds rate (FFR).
The rate determined in the market for reserves is the short-term interest rate. This is the counterpart to the long-term interest rate being determined in the loanable funds market.
Supply of reserves
In the simple money market, supply is assumed to be determined directly by the Federal Reserve. Strictly speaking though, what the Fed controls is the supply of reserves. In the market for reserves supply is determined by the Fed.
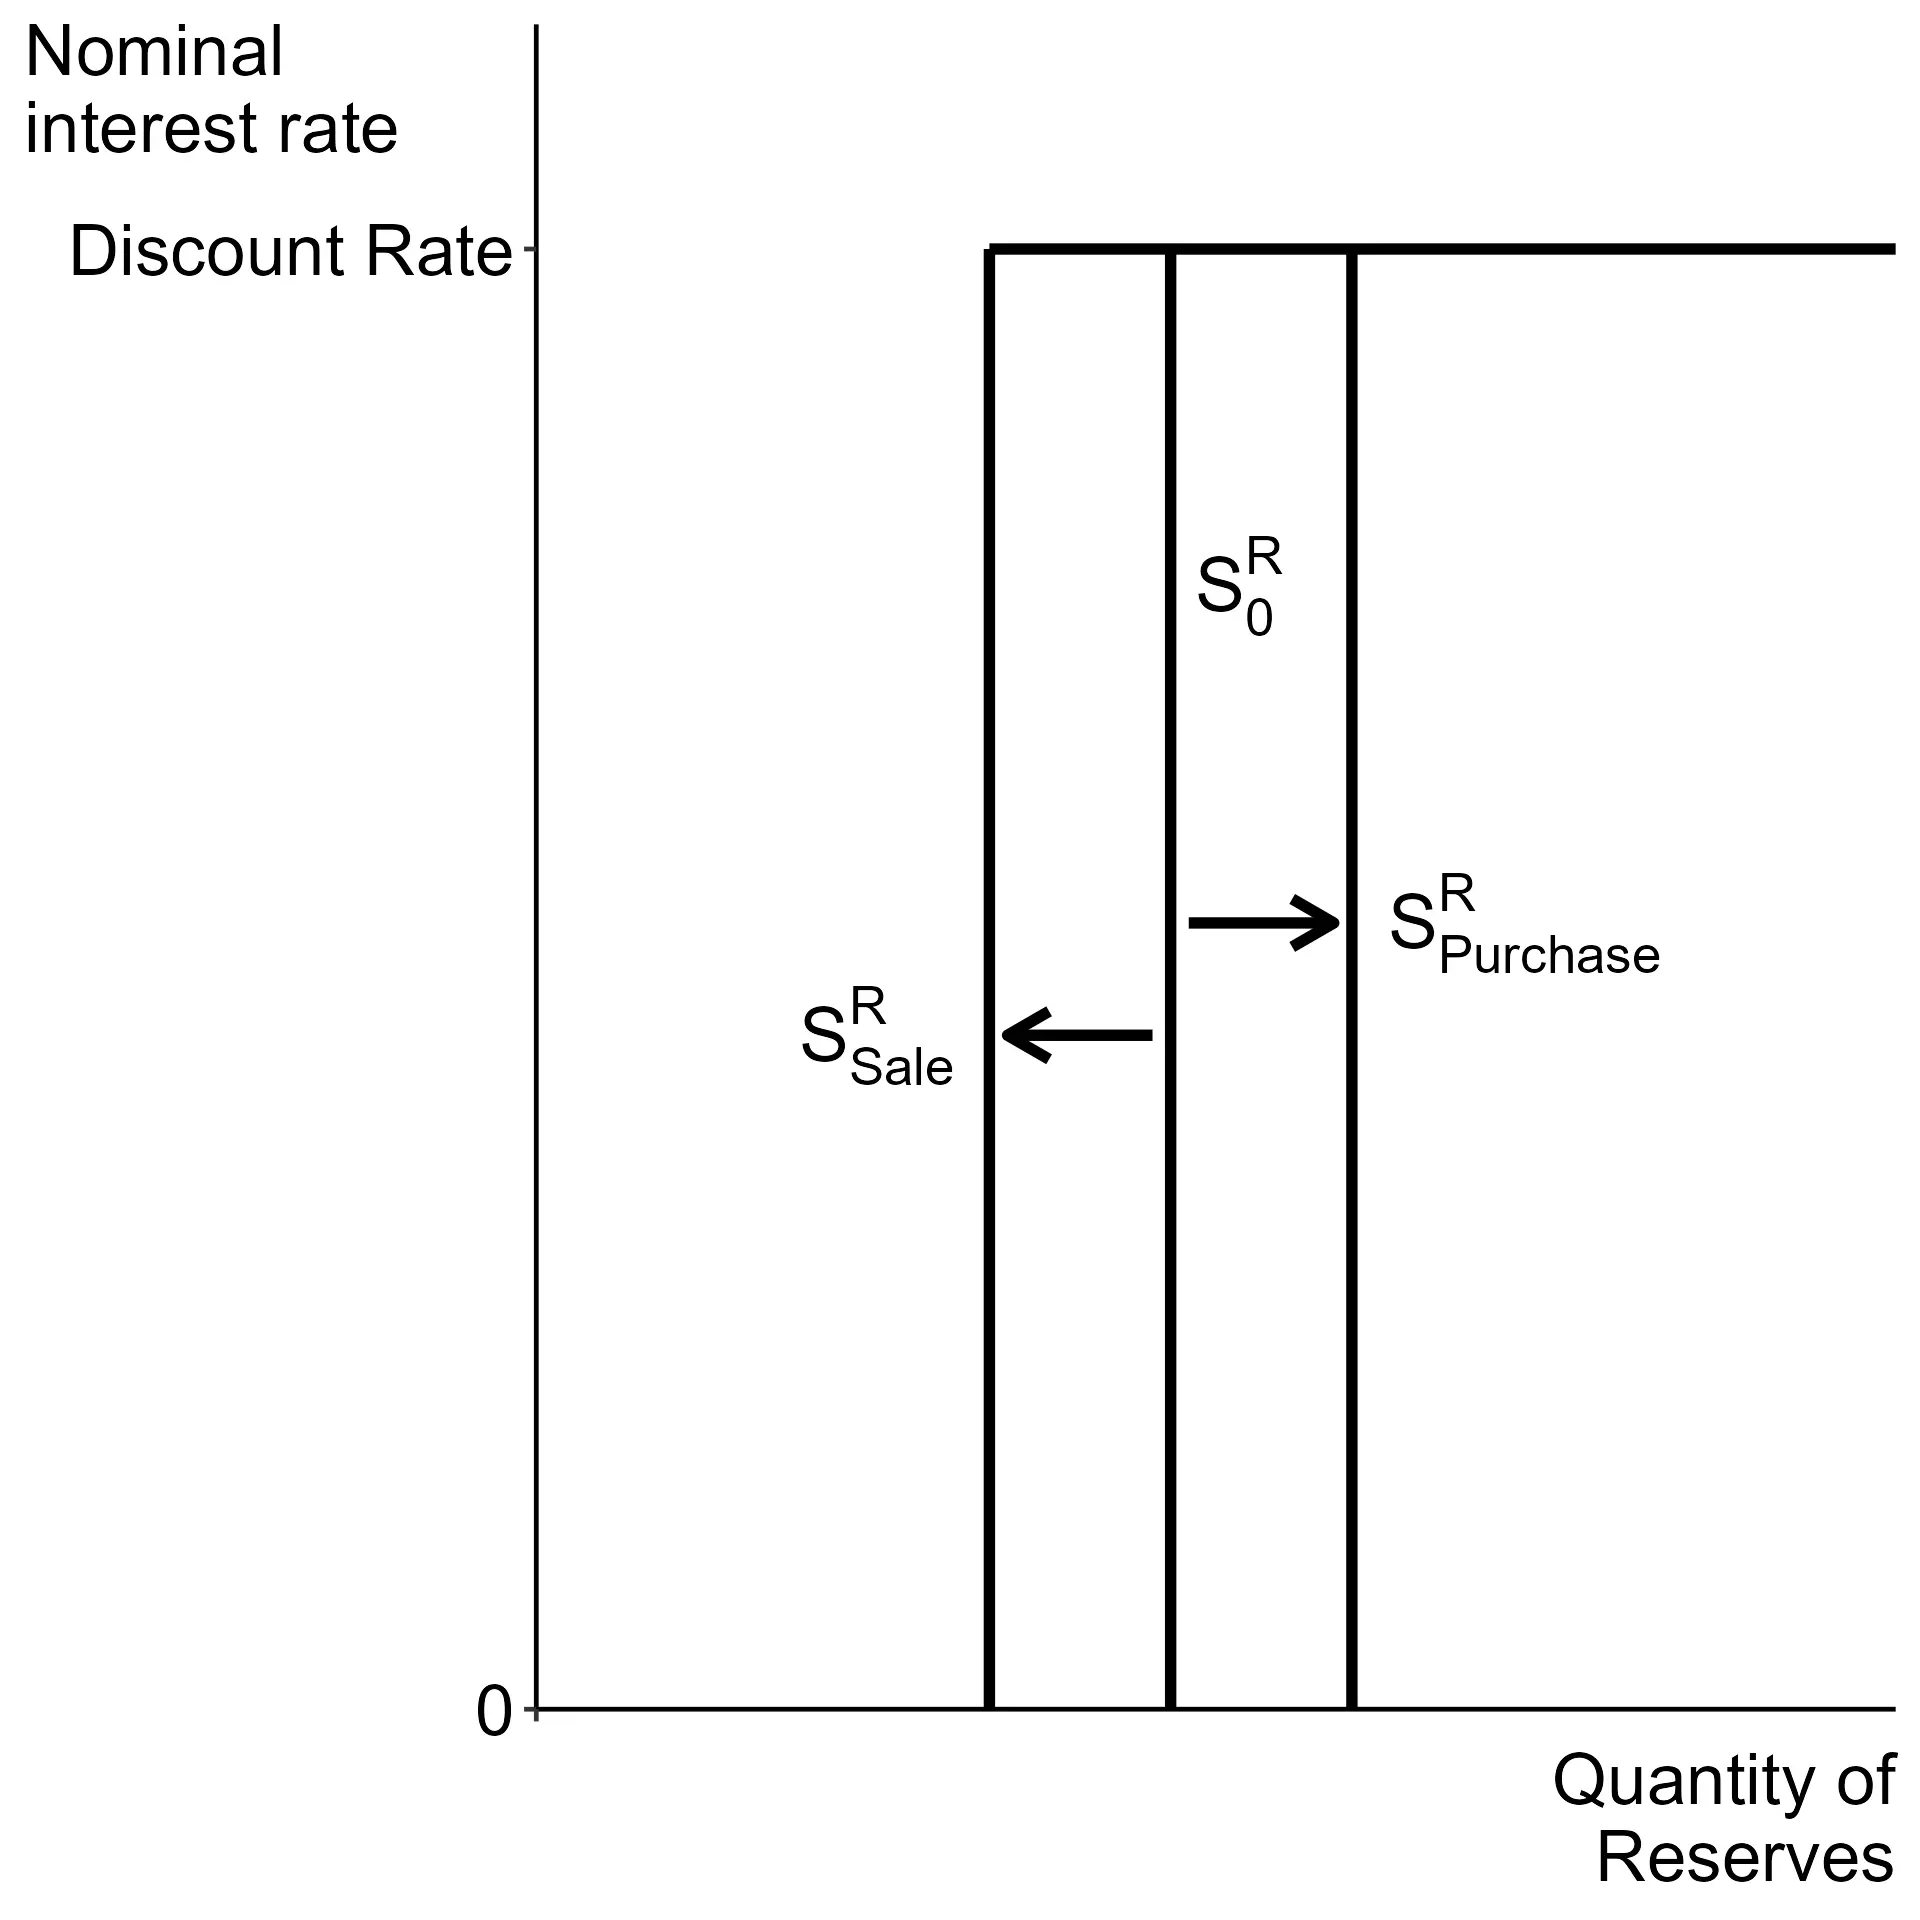
The supply curve looks like an upside down capital L, vertical with a horizontal portion that moves straight to the right. The level of interest rate when supply becomes flat is the discount rate. For any higher rate, banks would prefer to borrow from the Fed. This is the Fed acting as the lender of last resort.
Changing the discount rate is a special shifter that only moves the horizontal portion of the curve. With an increase it shifts up, with a decrease it shifts down.
The Fed has two ways to change the vertical part of the supply of reserves, open market operations (OMO) and quantitative easing (QE). Open market operations refers to the purchase or sale of short term government debt at the trading desk of the Federal Reserve Bank of New York on Wall Street. This is strictly Treasury bills, sometimes shortened as T-bills. Quantitative easing refers to the purchase or sale of any other asset, for example long-term US government debt or securities in a specific market. These transactions take place between the Fed and banks or other financial firms that participate in the reserves market.
An open market purchase refers to the Fed buying T-bills, which reduces securities on the asset side of a T-account (balance sheet) in exchange for increasing reserves. An open market purchase increases the supply of reserves, and shifts the curve to the right.
An open market sale works in reverse, so the Fed sells T-bills and exchanges reserves for securities on the asset side of a bank’s T-account. This decreases the supply of reserves, shifting it to the left.
Luckily, QE has the same effect on the supply of reserves. So the purchase of any asset should shift the supply of reserves to the right, and the sale of any asset should shift the supply of reserves to the left.
Demand for reserves
The demand for reserves comes from banks and select other financial institutions. They need reserves to meet reserve requirements, provide cash for withdrawals, transfer to other banks as a part of transactions, to back investments, and to otherwise support financial stability.
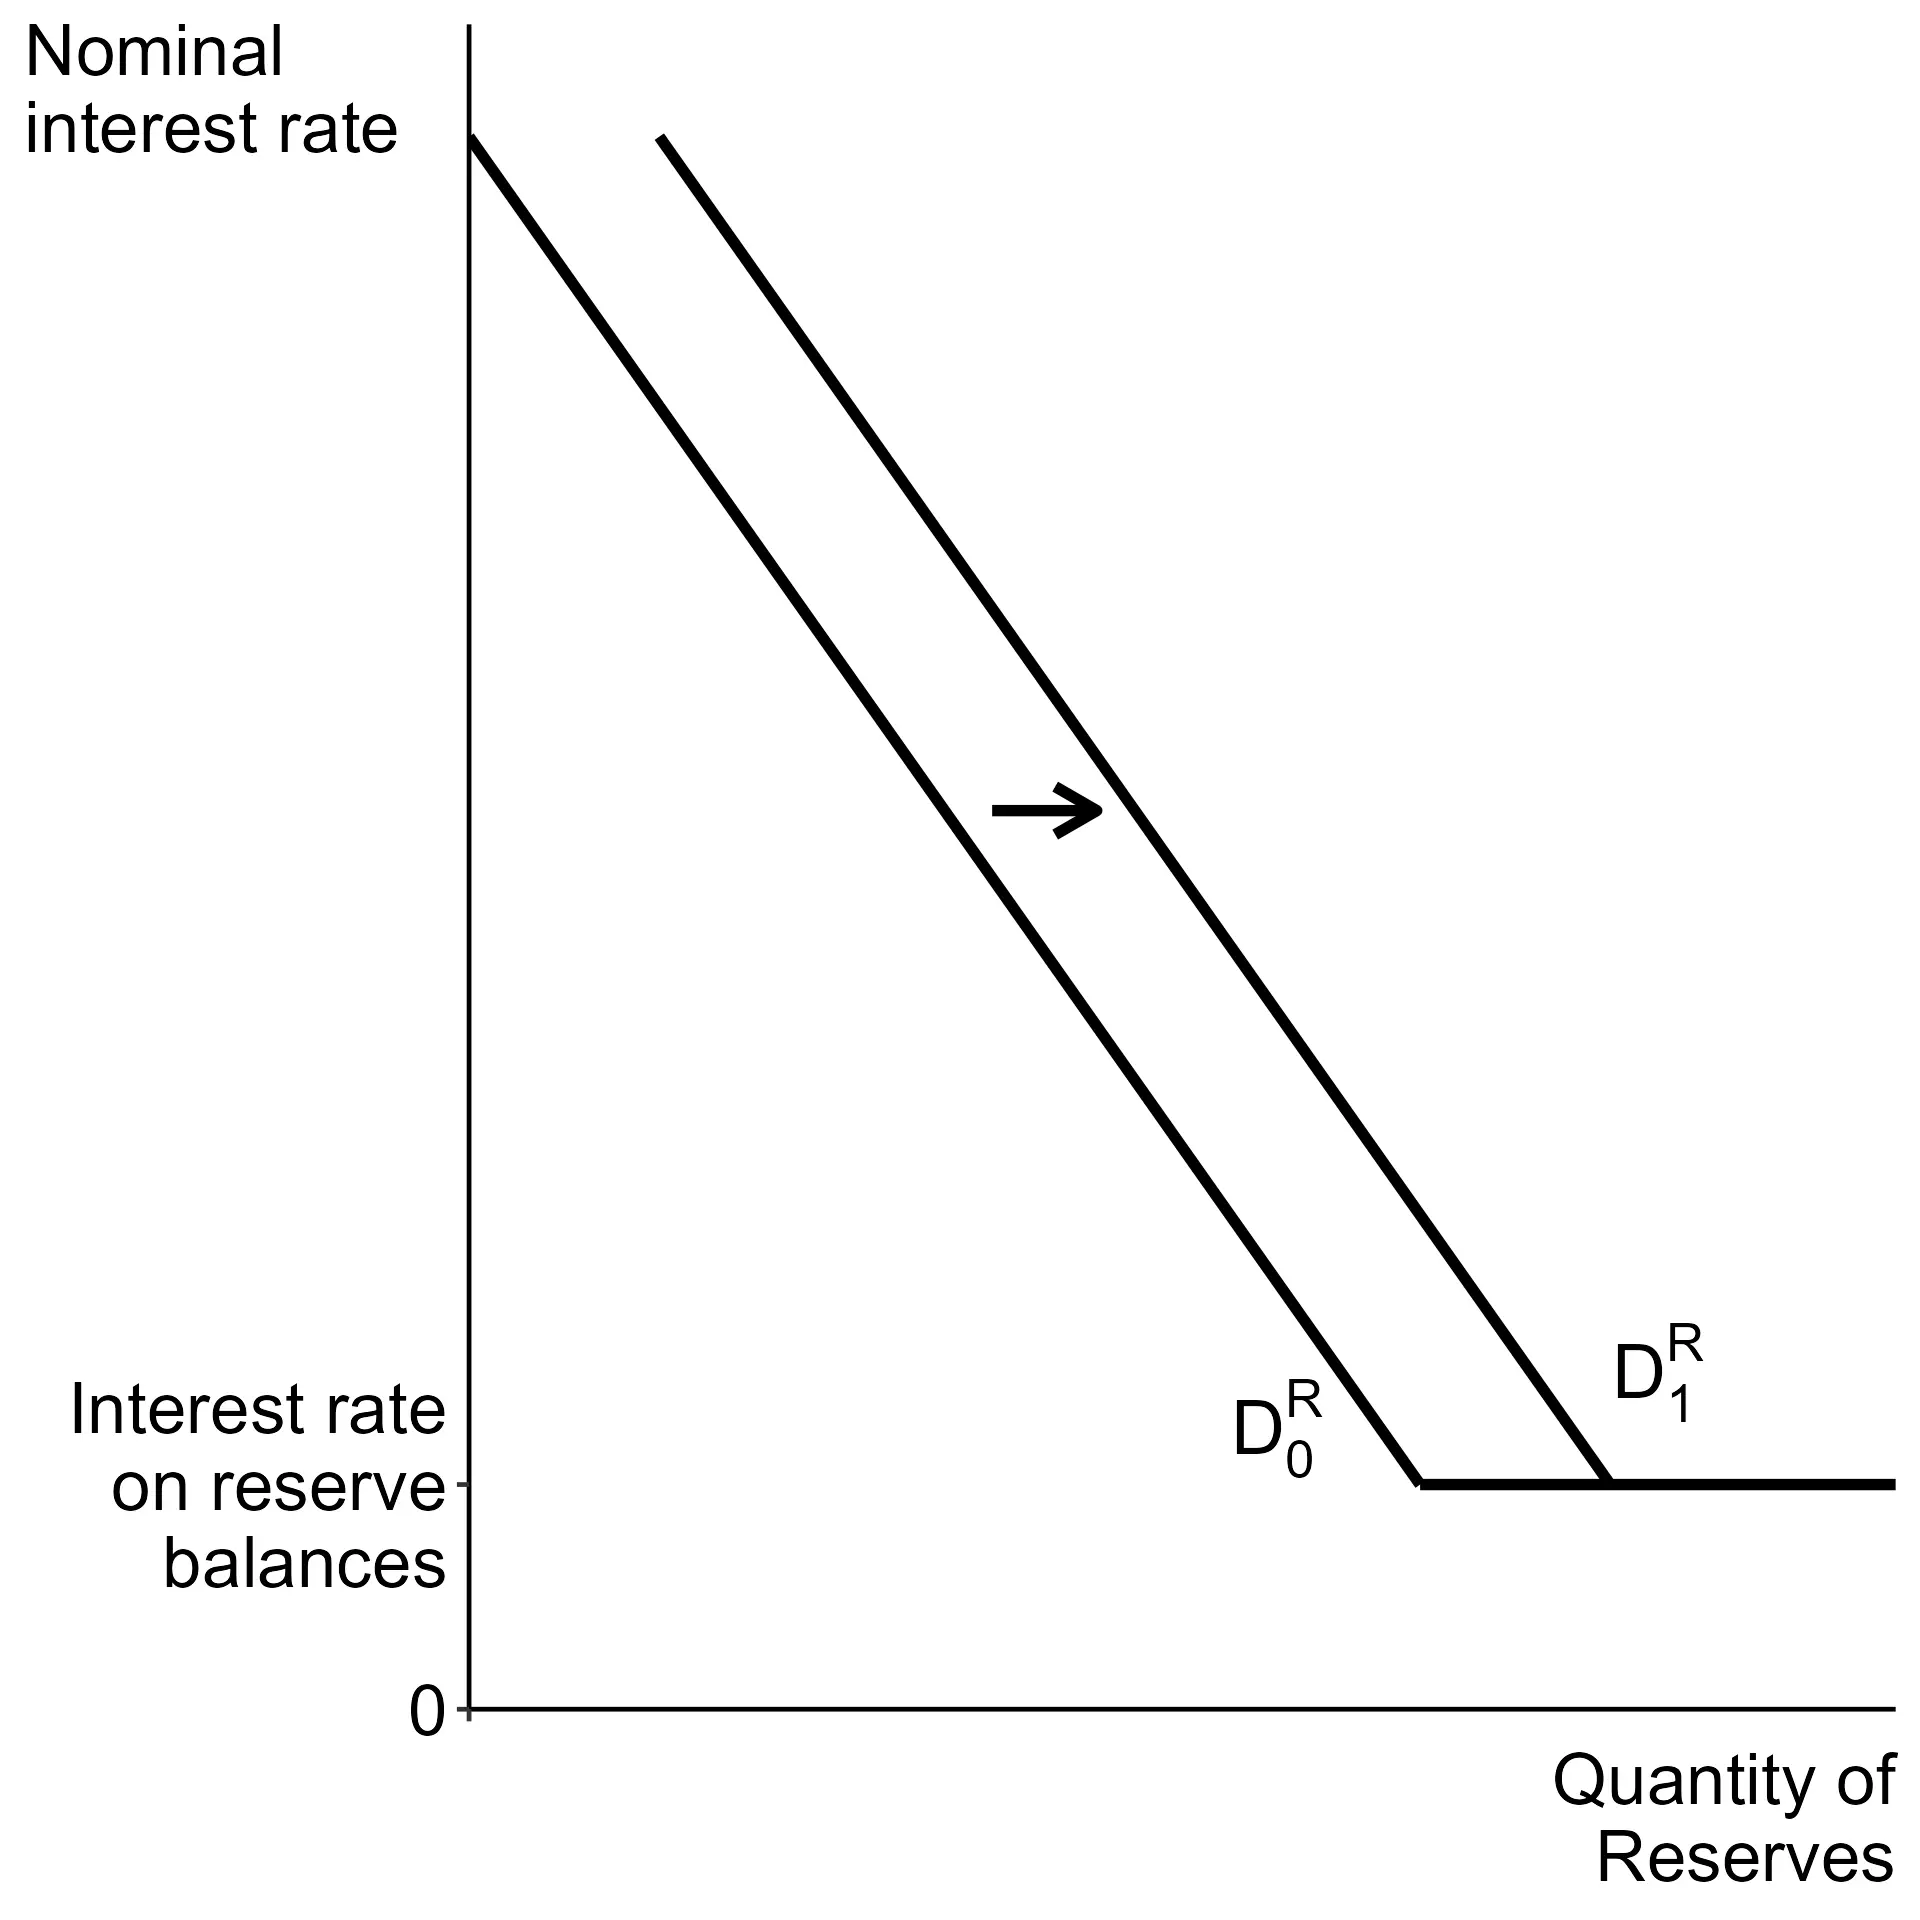
Banks face a trade-off that is very similar to the story described in the loanable funds market and so there is a portion that is downward sloping as is usual for demand curves. At higher rates, banks will prefer to avoid using the overnight market and they need to make fewer loans and undertake fewer investment activities to do so. At lower rates, banks will be more willing to make loans and investments and borrow in the overnight market to do so.
The unique feature of this demand curve is that there is a strict lower limit. This is determined by the opportunity cost of lending reserves.
If banks were the only participants in the market for reserves that opportunity cost would be the interest rate on reserve balances (IORB) and the demand curve would completely flatten out at that rate. Banks can always leave reserves at the Fed and earn IORB risk-free, so there is no reason for them to make loans at a lower FFR. If they did, another bank could borrow at the FFR and earn the IORB, earning a risk-free positive return.
The non-bank reserve market participants, do not earn interest on reserves and are thus willing to make loans at lower rates. The Fed uses overnight reverse repurchase agreements, loaning securities for reserves at a determined rate (ON RRP), to prevent the FFR from dropping far below IORB. We can generally treat the demand curve as if the IORB is the true lower bound, keeping in mind that in reality things are more complicated.
Shifters
| Factor | Change | Shift |
|---|---|---|
| Bank perceptions of risk | ||
| Bank business confidence | ||
| Bank regulations | ||
| Interest rate on reserve balances | Flat portion | |
| Flat portion |
Any factor which changes the willingness of banks to lend funds will also impact their demand for holding reserves, and thus will shift the demand curve for reserves. Increases in regulations will lead to banks holding more required reserves at every level of FFR and thus shift to the right. An example of this is that stricter rules around lending standards or capital requirements, would shift demand . Importantly, such changes do not change the upper or lower bound, so the downward sloping portion is all that shifts.
General economic conditions and perceptions of risk and uncertainty are the other important factors that shift the downward sloping portion of . All else equal, banks wish to hold more reserves when there are increases in risk, increases in uncertainty or negative economic news like a recession. For example, in an economy entering a recession banks would reduce their willingness to lend, due to higher risk and increased uncertainty around the economy. That would increase demand for excess reserves and shifts to the right. A lower reserve ratio or a decrease in risk or uncertainty would each shift to the left.
Finally the special nature of the lower bound means that the Fed changing the interest rate on reserves also “shifts” . Unlike most of our other shifters it is best to describe those changes as up and down. That change does not affect the downward sloping portion.
A hidden shifter in this model is the reserve ratio. If the reserve ratio increases, that would increase demand for reserves. However, it also lowers the money multiplier and that is the factor that wins. This is not a tool used by the Fed for monetary policy, this is just mentioned to clarify that the outcome is not different from the simple money market story.
Equilibrium
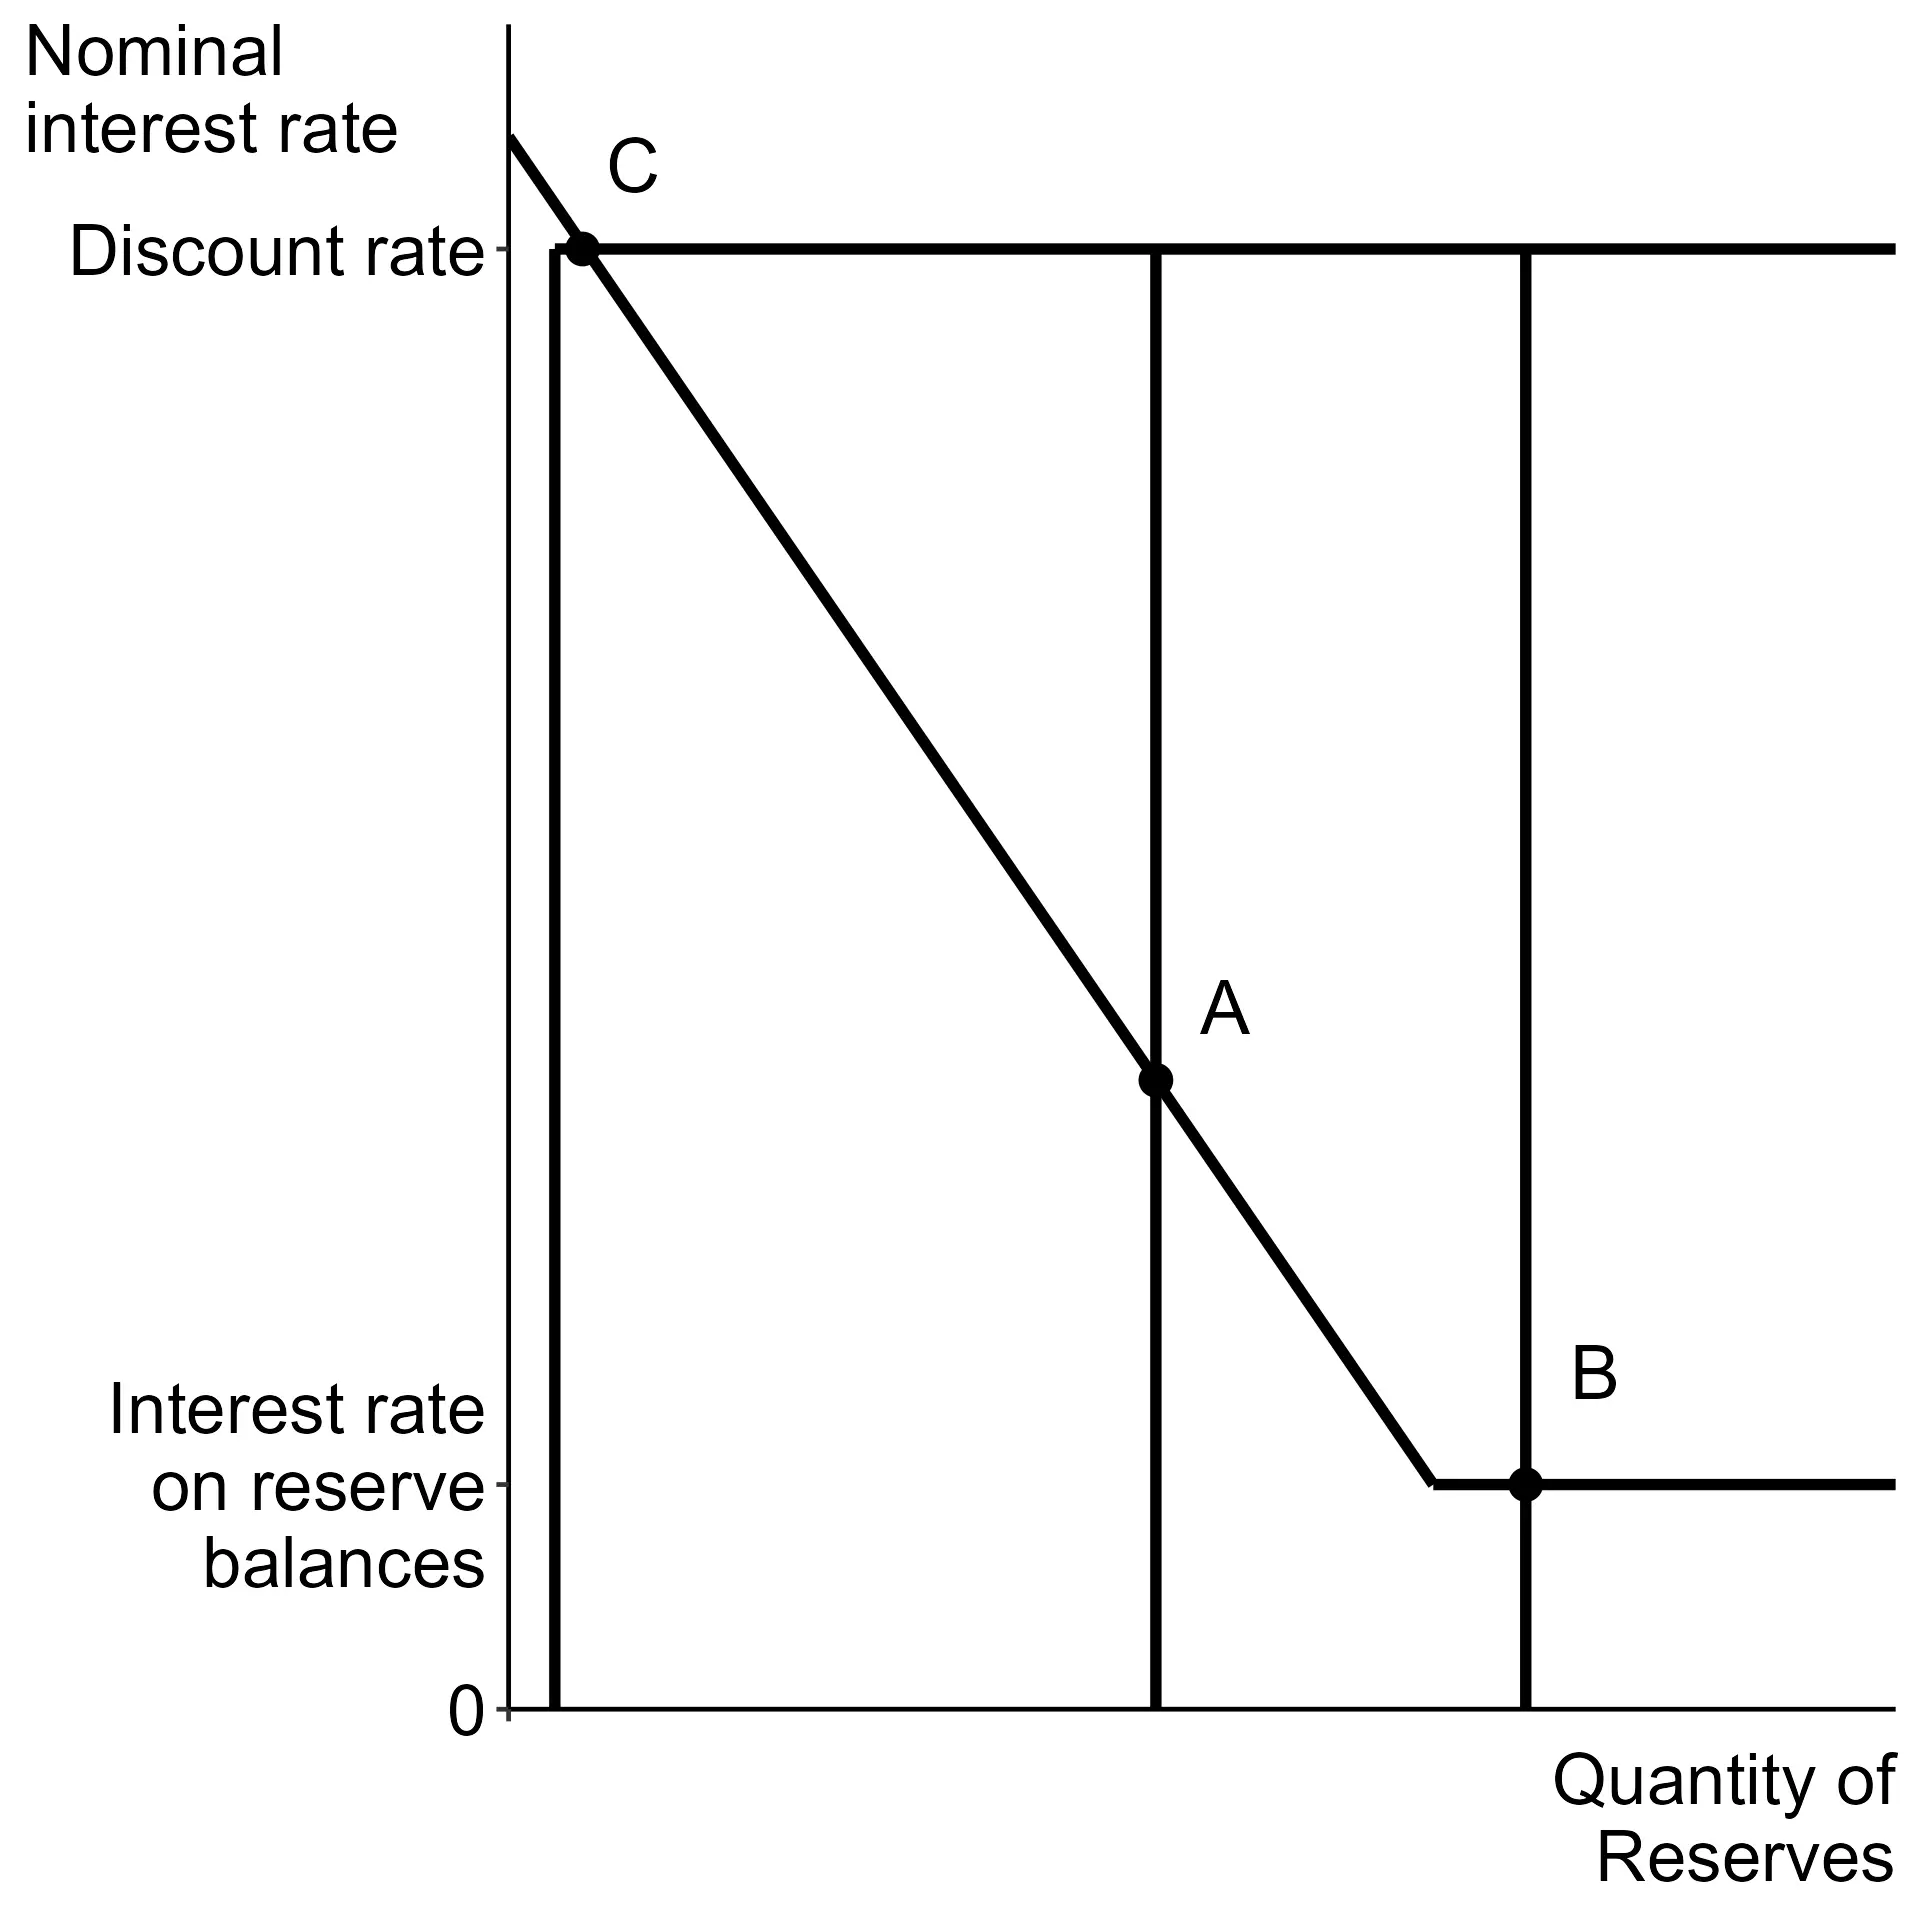
As in the majority of our stories, the equilibrium in the market for reserves occurs where the demand curve crosses the supply curve. The resulting interest rate is the federal funds rate. This does not need to occur on the downward sloping portion of the demand curve and the following subchapter will dive deeper into that detail.
The equilibrium level of reserves is not directly the supply of money but it does affect the supply of money (and credit). In reality the level of reserves and the willingness of banks to make loans determines the money multiplier and the actual money supply. We assume that they move together, without worrying about the detail of exactly how it happens.
The three supply curves in the graph illustrate the possible cases for equilibrium. Point shows the limited reserves case, to be covered in the next subchapter. Point shows the ample reserves case, to be detailed in the subchapter after that. Point would be a case of extremely limited reserves and will not be mentioned again because it is not relevant for developed countries.
The policy rate is the key measure of interest rates in the short run. In the United States consumer lending rates such as the prime rate and mortgage rates tend to rise and fall along with the FFR. The Federal Reserve can use changes in the FFR to impact the broader economy, even if the direct impacts only happen to banks and financial institutions.