


Achievable logoAchievable logo
AP Macroeconomics
Sign in
Sign up
Purchase
Textbook
Practice exams
Support
How it works
Exam catalog
Mountain with a flag at the peak
Textbook
Example
1. Core economic concepts
2. Measurement of economic performance
3. Modeling of income and prices
4. Financial sector
4.1 Closed economy loanable funds market
4.2 Macroeconomic finance
4.3 Financial assets and markets
4.4 Introduction to money
4.5 Simple money market
4.6 Banking and money supply expansion
4.7 Monetary policy
4.8 Reserves market
4.9 Implementation of monetary policy
5. Long-run consequences of stabilization policy
6. Open economy
Achievable logoAchievable logo
4.5 Simple money market
Achievable AP Macroeconomics
4. Financial sector
Our AP Macroeconomics course is currently in development and is a work-in-progress.

Simple money market

10 min read
Font
Discuss
Share
Feedback

By the end of this subchapter, we will explain how the supply and demand for money determine the interest rate in the money market. Later in this chapter we will present a more modern take on the money market, the market for reserves. Later on we discuss the role of international financial flows.

Money demand

Money demand can be motivated two different ways. Either using the Liquidity Preference Theory or by focusing on the opportunity cost of holding cash.

The Liquidity Preference Theory was first introduced by John Maynard Keynes and focuses on the need for liquidity as the root of demand for money. The basic assumptions of the model are as follows:

  • Households and firms can only hold their wealth in a combination of cash and bonds
  • The banking system is well established and can be used with no transaction costs
  • The supply of money is fixed
  • There is one interest rate for all assets, saving and borrowing
  • Everyone engages in speculation

In this model there are three sources of money demand

Definitions
Transactions motive
For current purchases and planned purchases in the near future. For households, this could include any regular purchases such as gas or groceries. For businesses this would include payments for raw materials, or other inputs such as labor and transportation costs.
Precautionary motive
To cover unplanned and unanticipated events. Things such as illness, unemployment or an accident. It is a reserve that saves individuals and businesses from needing to sell investments, potentially at a loss, in order to cover such costs.
Speculative motive
To profit from future changes in interest rates. Bond prices and interest rates are inversely related, and the opportunity cost of holding cash is also the interest rate. So higher rates make cash less desirable, and that cash is instead moved into bonds, with lower liquidity.

Both the transactions and precautionary motives are assumed to be unrelated to interest rates. Each motive is connected to the medium of exchange role of money, and only linked to the desire for a specific level of spending. Thus they may be impacted by income, but not by interest rates.

The speculative motive is where money demand is affected by interest rates. In the Liquidity Preference Theory, speculation is solely around expected changes in interest rates and their impact on bond prices. Recall that bond prices and interest rates are inversely related. As interest rates rise, bond prices fall and households and businesses are incentivized to move money from cash into bonds.

Thus higher interest rates lead to lower demand for liquidity, and lower demand for money. The reverse story is true as well. If interest rates fall, bond prices are higher and the incentive is now to sell bonds in order to increase liquidity.

Total money demand is all three motives added up. The transactions and precautionary motives do not depend on interest rates, so if they had separate curves they would be vertical. The speculative motive is downward sloping, so when they are added up total money demand is also downward sloping.

While the Liquidity Preference Theory presents a compelling story behind money demand, the setup is overly simple and there is a lack of empirical evidence that it accurately describes real-life behavior. Importantly, as originally developed it ignored the price level. In the short run prices are fixed, so nothing is lost in focusing on M instead of PM​. This limitation would hinder us in analysis of the long run.

What the theory does well is to highlight the link between interest rates and the desire to hold money. This result is the key relationship for money demand: money demand is inversely related to interest rates.

A final comment is that although the presentation here closely follows Keynes’ original story, where cash and bonds are the only possible assets, there are no significant problems extending this to allow for interest bearing accounts and other financial assets such as stocks. The key for our logic is that the alternative investments must be less liquid and offer a higher (potentially risky) return than our money options.

Classical explanation for money demand

There is an alternative story that motivates money demand, by focusing on the opportunity cost of holding funds in cash and near-cash accounts. Such accounts either pay very low interest or do not pay interest at all.

That makes the interest rate the opportunity cost of holding money. Any time you hold funds as cash or in a highly liquid account you give up earning interest in other assets. When liquidity is reduced, the compensation is an additional return. Assets with equivalent risk should offer a higher interest rate (or yield) for locking in your money for a longer time period.

For example, the following table gives a sampling of Treasury bill yields on January 3, 2005 (Source: U.S. Treasury).

Duration Yield
1 Month 1.99%
1 Year 2.79%
10 Year 4.23%

At these rates, the longer you commit your money to U.S. Government debt the higher the interest rate you receive. This is not always the case, and if you look at random dates that may be the case.

An inverted yield curve, where longer duration bonds have lower rates than shorter ones is often a sign of a recession. It is not always, however, because yields depend on more than duration. Other key factors include expectations about future economic growth, expectations about inflation, and expectations about interest rates.

So as interest rates fall, the opportunity cost of holding money is lower and households and firms will simply hold more money over alternative options that pay lower rates or incur higher risk for higher expected returns. This quickly and elegantly leads to a downward sloping demand curve as well.

Money demand shifters

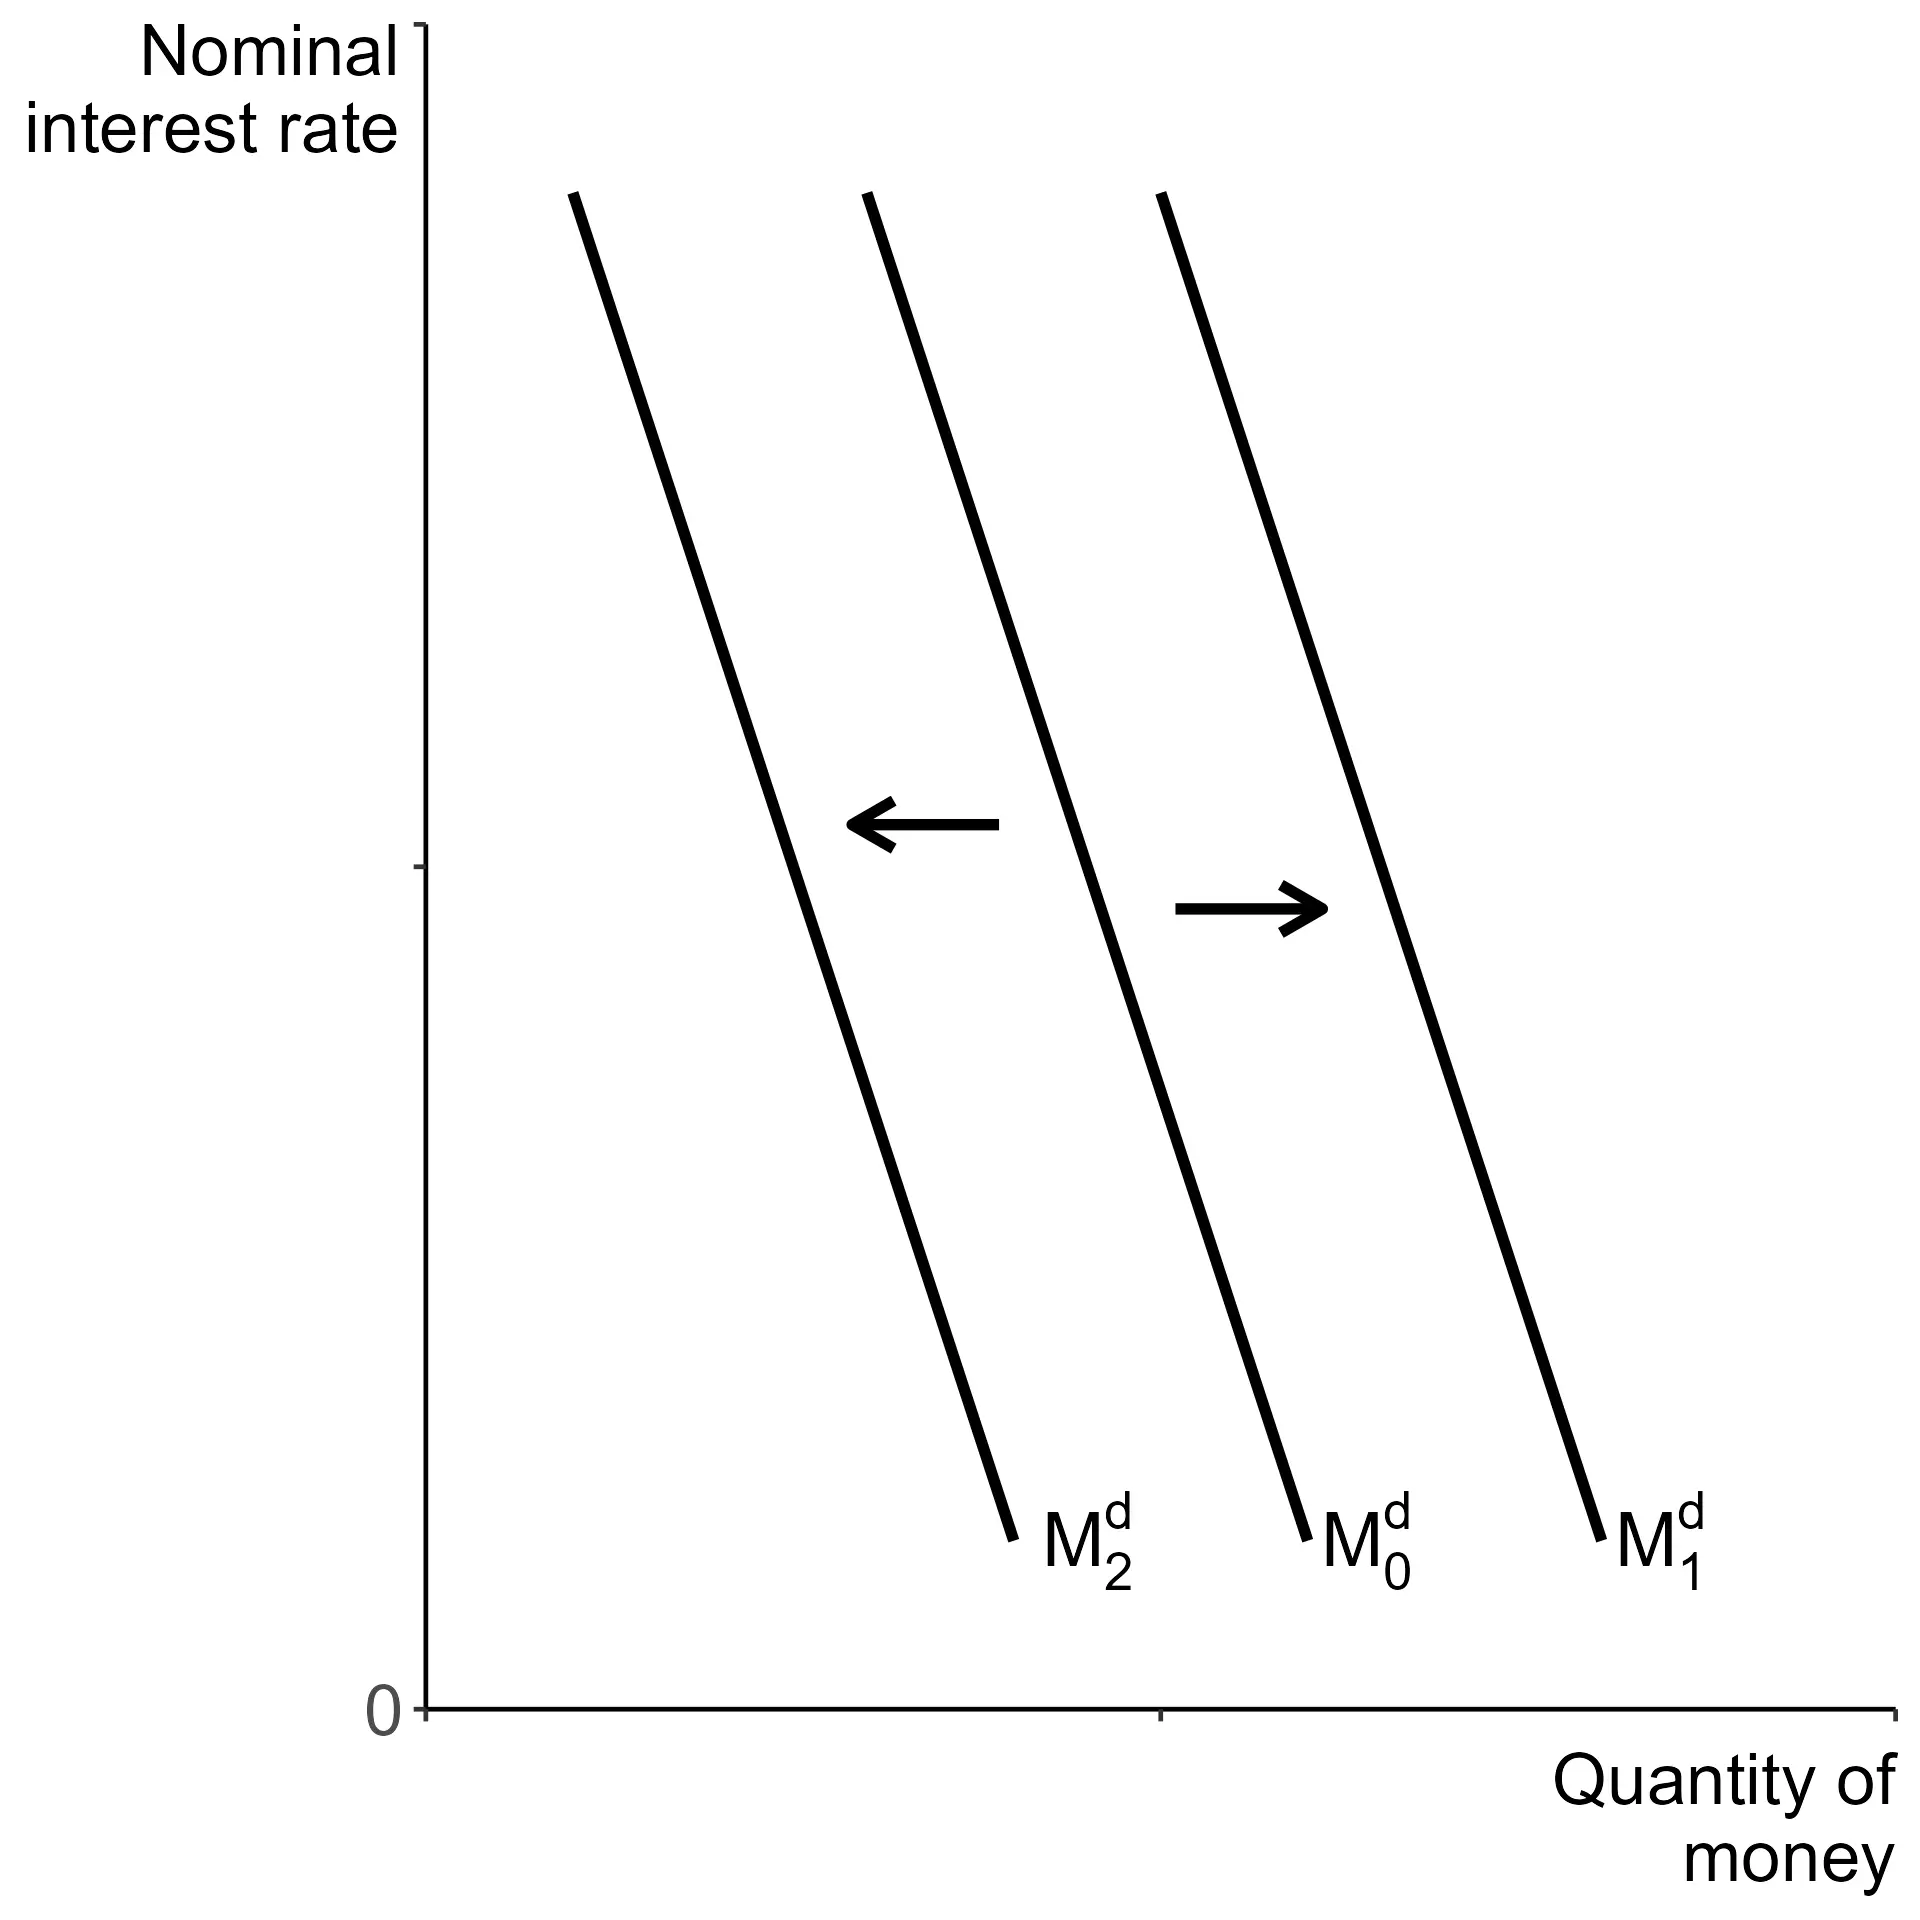
Regardless of which story we use to justify money demand, the shifters are the same: income, technology, and regulations.

Factor Change PM​ Change Shift
Household income (Y) ↑ ↑ D0​→D1​
↓ ↓ D2​←D0​
Aggregate price level (PL) ↑ ↑ D0​→D1​
↓ ↓ D2​←D0​

| Technology | ↑ | ↓|D2​←D0​ | | | ↓ | ↑| D0​→D1​ | | Regulations | ↑ | ↓|D2​←D0​ | | | ↓ | ↑| D0​→D1​ |

Income is and the price level are positively related, so an increase in either leads to higher money demand for the same interest rate. Keynes considered changes in income to have a larger effect on money demand due to the transactions and precautionary motives. For example if Y increases by 10%, the transactions and precautionary motives lead to an increase in money demand greater than 10%.

As the price level rises, consumers do not necessarily want to buy more. They do need more money to make the same purchases they had planned and that increases money demand.

Technology, particularly payment technology innovations, have a negative relationship with money demand. Examples of this would include the introduction of credit cards, and the recent surge in so-called “buy now-pay later” micro-credit arrangements. These reduce demand for money, by lowering the amount of money needed to manage current transactions. In general, any technological change that makes payments require less cash in hand will lower money demand (shift it to the left), and any technological change that makes payments require more cash in hand will increase money demand (shift it to the right).

Money demand shifting left and right as with the usual demand curve.
Shifts in money demand

Regulations have a similar effect. As mentioned in the Introduction to Money, Regulation D was dropped in 2020, changing limits on transactions on savings accounts. That would make money demand higher, since it added accounts to M1 and thus increased overall liquidity. Changes in regulations or technology that enable interest earning and increased liquidity at the same time, will increase money demand (shift it the right) and changes that reduce liquidity for interest-bearing assets will decrease it (shift it to the left).

Money supply and equilibrium

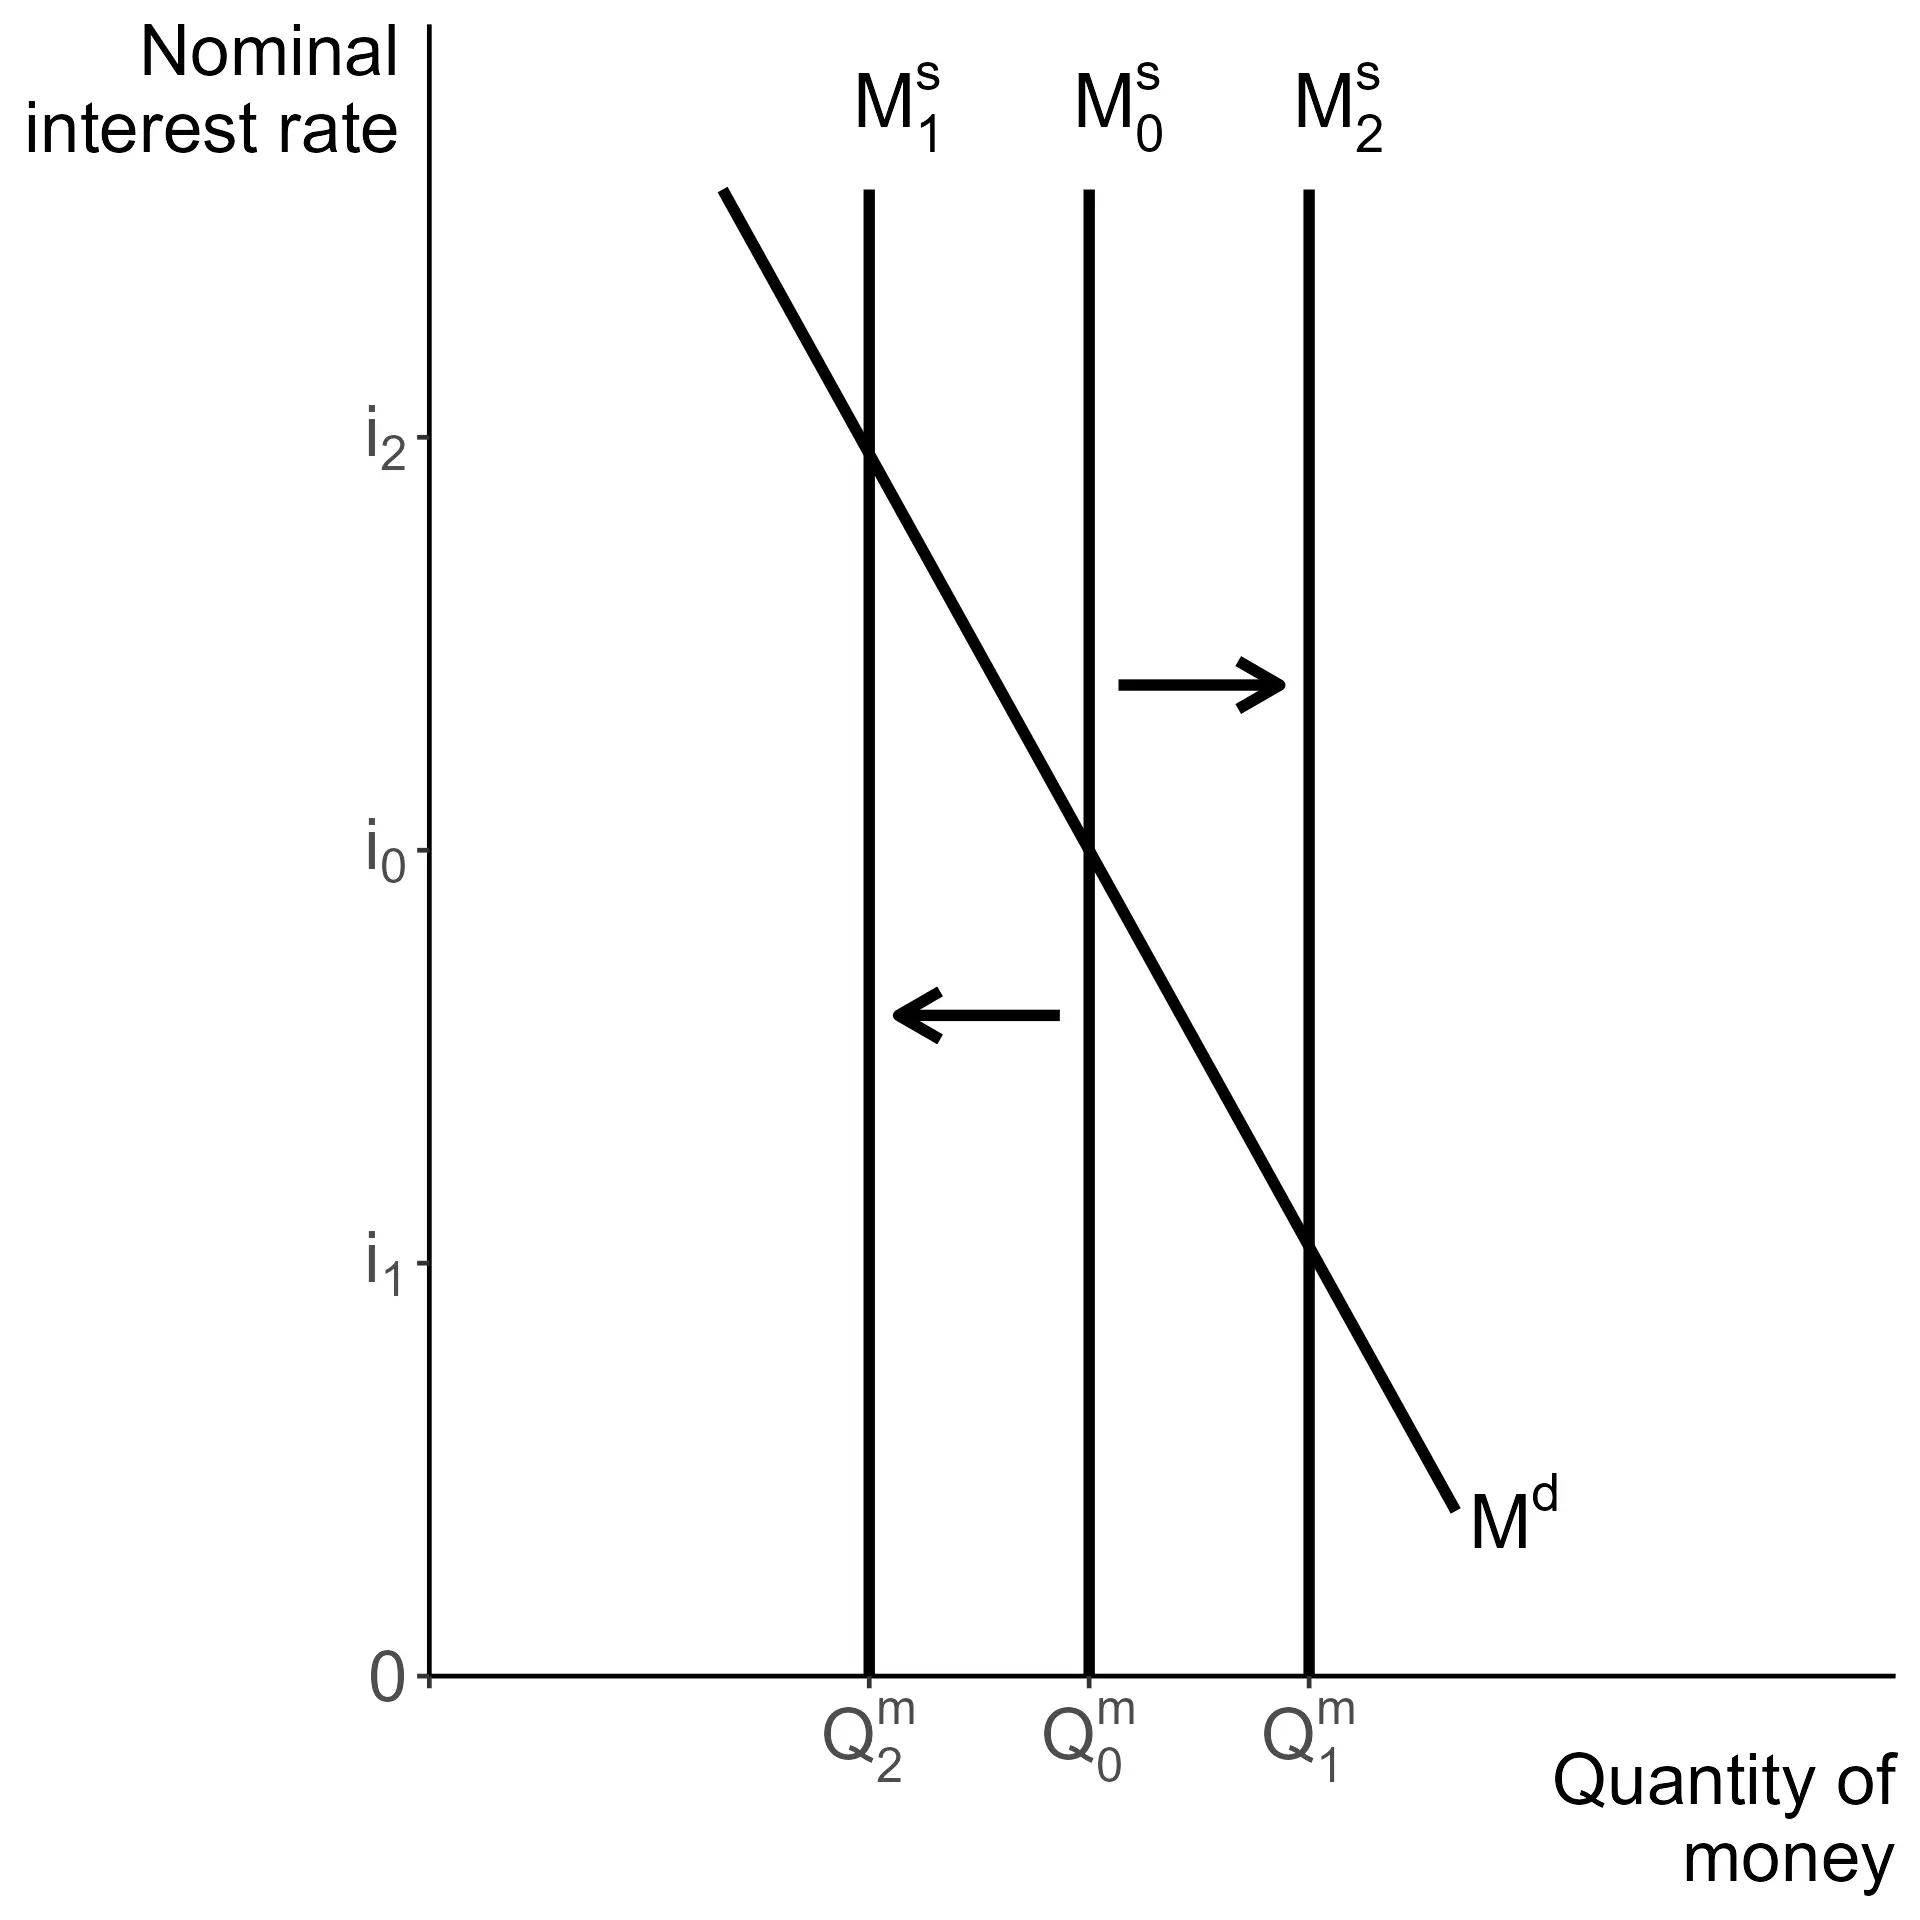
Money supply is one of the simplest curves we will see in the entire course. In the simple money market we treat the money supply as constant, with the level determined by a country’s central bank - the Federal Reserve (the Fed) in the United States. The shifts are straightforward the supply can shift right representing an increase, or shift left representing a decrease. This is monetary policy, the changing of interest rates

The only shift of the money supply is monetary policy, the changing of the money supply for economic goals. An increase of the money supply moves the curve right and lowers the equilibrium nominal interest rate. A decrease in the money supply shifts the curve left and increases the nominal interest rate in equilibrium.

This story is an oversimplification. The Fed does not have direct control over the money supply but they do have significant power in determining interest rates. Setting interest rates is equivalent to setting the money supply for a given money demand curve. A more realistic depiction of how this happens in the United States will be provided soon.

The inverse relationship between interest rates and changes in the money supply.
Changes in money supply and interest rates

If the interest rate is set below the equilibrium level, then the quantity of money demanded is higher than the quantity supplied. This is an excess demand for money, which can only be closed by allowing the money supply to increase or the interest rate to rise. If rates do rise, the opportunity cost of holding money increases, and households and businesses will shift some of those funds into higher interest options.

Briefly, if the interest rate is higher than equilibrium, the story is flipped. Now the quantity supplied will be higher than the quantity demanded, so there is an excess supply of money. The supply can be decreased or the interest rate can be lowered. If the rate is lowered, that incentivizes the shifting of funds to money from less liquid options.

Money demand (Liquidity Preference Theory)

  • Three motives: transactions, precautionary, speculative
    • Transactions & precautionary: perfectly interest-inelastic, depend on income
    • Speculative: inversely related to interest rates
  • Total money demand is downward sloping due to speculative motive
  • Money demand inversely related to interest rates

Classical explanation for money demand (opportunity cost)

  • Interest rate = opportunity cost of holding money
  • Holding cash means giving up interest from other assets
  • Downward sloping money demand curve: as rates fall, money demand rises

Money demand shifters

  • Income: positive relationship, higher income shifts demand right
  • Technology: improved payment tech reduces money demand (shifts left)
  • Regulations: can increase or decrease money demand based on liquidity and interest-earning features

Money supply

  • Treated as fixed by central bank (vertical curve)
  • Shifters:
    • Monetary policy: Fed increases (right shift) or decreases (left shift) supply
    • Price level: higher prices decrease real money supply (left shift); lower prices increase it (right shift)

Market equilibrium

  • Equilibrium at intersection of money supply and demand curves
  • Equilibrium interest rate (r∗) where MS=MD
  • Below equilibrium rate: excess money demand, rates rise
  • Above equilibrium rate: excess money supply, rates fall

Final comments

  • Model extends to include less liquid, higher-return financial assets
  • Key logic: alternative assets must be less liquid and offer higher (possibly riskier) returns than money

Sign up for free to take 1 quiz question on this topic

Previous
Next  | 4.6 Banking and money supply expansion
All rights reserved ©2016 - 2026 Achievable, Inc.

Simple money market

By the end of this subchapter, we will explain how the supply and demand for money determine the interest rate in the money market. Later in this chapter we will present a more modern take on the money market, the market for reserves. Later on we discuss the role of international financial flows.

Money demand

Money demand can be motivated two different ways. Either using the Liquidity Preference Theory or by focusing on the opportunity cost of holding cash.

The Liquidity Preference Theory was first introduced by John Maynard Keynes and focuses on the need for liquidity as the root of demand for money. The basic assumptions of the model are as follows:

  • Households and firms can only hold their wealth in a combination of cash and bonds
  • The banking system is well established and can be used with no transaction costs
  • The supply of money is fixed
  • There is one interest rate for all assets, saving and borrowing
  • Everyone engages in speculation

In this model there are three sources of money demand

Definitions
Transactions motive
For current purchases and planned purchases in the near future. For households, this could include any regular purchases such as gas or groceries. For businesses this would include payments for raw materials, or other inputs such as labor and transportation costs.
Precautionary motive
To cover unplanned and unanticipated events. Things such as illness, unemployment or an accident. It is a reserve that saves individuals and businesses from needing to sell investments, potentially at a loss, in order to cover such costs.
Speculative motive
To profit from future changes in interest rates. Bond prices and interest rates are inversely related, and the opportunity cost of holding cash is also the interest rate. So higher rates make cash less desirable, and that cash is instead moved into bonds, with lower liquidity.

Both the transactions and precautionary motives are assumed to be unrelated to interest rates. Each motive is connected to the medium of exchange role of money, and only linked to the desire for a specific level of spending. Thus they may be impacted by income, but not by interest rates.

The speculative motive is where money demand is affected by interest rates. In the Liquidity Preference Theory, speculation is solely around expected changes in interest rates and their impact on bond prices. Recall that bond prices and interest rates are inversely related. As interest rates rise, bond prices fall and households and businesses are incentivized to move money from cash into bonds.

Thus higher interest rates lead to lower demand for liquidity, and lower demand for money. The reverse story is true as well. If interest rates fall, bond prices are higher and the incentive is now to sell bonds in order to increase liquidity.

Total money demand is all three motives added up. The transactions and precautionary motives do not depend on interest rates, so if they had separate curves they would be vertical. The speculative motive is downward sloping, so when they are added up total money demand is also downward sloping.

While the Liquidity Preference Theory presents a compelling story behind money demand, the setup is overly simple and there is a lack of empirical evidence that it accurately describes real-life behavior. Importantly, as originally developed it ignored the price level. In the short run prices are fixed, so nothing is lost in focusing on M instead of PM​. This limitation would hinder us in analysis of the long run.

What the theory does well is to highlight the link between interest rates and the desire to hold money. This result is the key relationship for money demand: money demand is inversely related to interest rates.

A final comment is that although the presentation here closely follows Keynes’ original story, where cash and bonds are the only possible assets, there are no significant problems extending this to allow for interest bearing accounts and other financial assets such as stocks. The key for our logic is that the alternative investments must be less liquid and offer a higher (potentially risky) return than our money options.

Classical explanation for money demand

There is an alternative story that motivates money demand, by focusing on the opportunity cost of holding funds in cash and near-cash accounts. Such accounts either pay very low interest or do not pay interest at all.

That makes the interest rate the opportunity cost of holding money. Any time you hold funds as cash or in a highly liquid account you give up earning interest in other assets. When liquidity is reduced, the compensation is an additional return. Assets with equivalent risk should offer a higher interest rate (or yield) for locking in your money for a longer time period.

For example, the following table gives a sampling of Treasury bill yields on January 3, 2005 (Source: U.S. Treasury).

Duration Yield
1 Month 1.99%
1 Year 2.79%
10 Year 4.23%

At these rates, the longer you commit your money to U.S. Government debt the higher the interest rate you receive. This is not always the case, and if you look at random dates that may be the case.

An inverted yield curve, where longer duration bonds have lower rates than shorter ones is often a sign of a recession. It is not always, however, because yields depend on more than duration. Other key factors include expectations about future economic growth, expectations about inflation, and expectations about interest rates.

So as interest rates fall, the opportunity cost of holding money is lower and households and firms will simply hold more money over alternative options that pay lower rates or incur higher risk for higher expected returns. This quickly and elegantly leads to a downward sloping demand curve as well.

Money demand shifters

Regardless of which story we use to justify money demand, the shifters are the same: income, technology, and regulations.

Factor Change PM​ Change Shift
Household income (Y) ↑ ↑ D0​→D1​
↓ ↓ D2​←D0​
Aggregate price level (PL) ↑ ↑ D0​→D1​
↓ ↓ D2​←D0​

| Technology | ↑ | ↓|D2​←D0​ | | | ↓ | ↑| D0​→D1​ | | Regulations | ↑ | ↓|D2​←D0​ | | | ↓ | ↑| D0​→D1​ |

Income is and the price level are positively related, so an increase in either leads to higher money demand for the same interest rate. Keynes considered changes in income to have a larger effect on money demand due to the transactions and precautionary motives. For example if Y increases by 10%, the transactions and precautionary motives lead to an increase in money demand greater than 10%.

As the price level rises, consumers do not necessarily want to buy more. They do need more money to make the same purchases they had planned and that increases money demand.

Technology, particularly payment technology innovations, have a negative relationship with money demand. Examples of this would include the introduction of credit cards, and the recent surge in so-called “buy now-pay later” micro-credit arrangements. These reduce demand for money, by lowering the amount of money needed to manage current transactions. In general, any technological change that makes payments require less cash in hand will lower money demand (shift it to the left), and any technological change that makes payments require more cash in hand will increase money demand (shift it to the right).

Regulations have a similar effect. As mentioned in the Introduction to Money, Regulation D was dropped in 2020, changing limits on transactions on savings accounts. That would make money demand higher, since it added accounts to M1 and thus increased overall liquidity. Changes in regulations or technology that enable interest earning and increased liquidity at the same time, will increase money demand (shift it the right) and changes that reduce liquidity for interest-bearing assets will decrease it (shift it to the left).

Money supply and equilibrium

Money supply is one of the simplest curves we will see in the entire course. In the simple money market we treat the money supply as constant, with the level determined by a country’s central bank - the Federal Reserve (the Fed) in the United States. The shifts are straightforward the supply can shift right representing an increase, or shift left representing a decrease. This is monetary policy, the changing of interest rates

The only shift of the money supply is monetary policy, the changing of the money supply for economic goals. An increase of the money supply moves the curve right and lowers the equilibrium nominal interest rate. A decrease in the money supply shifts the curve left and increases the nominal interest rate in equilibrium.

This story is an oversimplification. The Fed does not have direct control over the money supply but they do have significant power in determining interest rates. Setting interest rates is equivalent to setting the money supply for a given money demand curve. A more realistic depiction of how this happens in the United States will be provided soon.

If the interest rate is set below the equilibrium level, then the quantity of money demanded is higher than the quantity supplied. This is an excess demand for money, which can only be closed by allowing the money supply to increase or the interest rate to rise. If rates do rise, the opportunity cost of holding money increases, and households and businesses will shift some of those funds into higher interest options.

Briefly, if the interest rate is higher than equilibrium, the story is flipped. Now the quantity supplied will be higher than the quantity demanded, so there is an excess supply of money. The supply can be decreased or the interest rate can be lowered. If the rate is lowered, that incentivizes the shifting of funds to money from less liquid options.

Key points

Money demand (Liquidity Preference Theory)

  • Three motives: transactions, precautionary, speculative
    • Transactions & precautionary: perfectly interest-inelastic, depend on income
    • Speculative: inversely related to interest rates
  • Total money demand is downward sloping due to speculative motive
  • Money demand inversely related to interest rates

Classical explanation for money demand (opportunity cost)

  • Interest rate = opportunity cost of holding money
  • Holding cash means giving up interest from other assets
  • Downward sloping money demand curve: as rates fall, money demand rises

Money demand shifters

  • Income: positive relationship, higher income shifts demand right
  • Technology: improved payment tech reduces money demand (shifts left)
  • Regulations: can increase or decrease money demand based on liquidity and interest-earning features

Money supply

  • Treated as fixed by central bank (vertical curve)
  • Shifters:
    • Monetary policy: Fed increases (right shift) or decreases (left shift) supply
    • Price level: higher prices decrease real money supply (left shift); lower prices increase it (right shift)

Market equilibrium

  • Equilibrium at intersection of money supply and demand curves
  • Equilibrium interest rate (r∗) where MS=MD
  • Below equilibrium rate: excess money demand, rates rise
  • Above equilibrium rate: excess money supply, rates fall

Final comments

  • Model extends to include less liquid, higher-return financial assets
  • Key logic: alternative assets must be less liquid and offer higher (possibly riskier) returns than money

More from Financial sector

  • Closed economy loanable funds market
  • Macroeconomic finance
  • Financial assets and markets
  • Introduction to money
  • Banking and money supply expansion