


Achievable logoAchievable logo
AMC
Sign in
Sign up
Purchase
Textbook
Practice exams
Support
How it works
Exam catalog
Mountain with a flag at the peak
Textbook
Introduction
1. Algebra
2. Geometry
2.1 Triangles
2.2 Circles
2.3 Lines and angles
2.4 Quadrilaterals and polygons
2.5 Area and perimeter
2.6 Volume and surface area
2.7 Coordinate geometry
3. Number theory
4. Counting and probability
5. Intermediate topics (AMC 10/12)
6. Advanced topics (AMC 12)
7. General approaches
8. Practical strategies
Wrapping up
Achievable logoAchievable logo
2.7 Coordinate geometry
Achievable AMC
2. Geometry

Coordinate geometry

7 min read
Font
Discuss
Share
Feedback

This chapter applies to all AMC 8/10/12 test takers.

Coordinate geometry is the study of shapes and lines drawn on a coordinate (Cartesian) plane. A 2D coordinate plane has an x-axis (horizontal) and a y-axis (vertical). Any point is written as an ordered pair (x,y), where:

  • x is the horizontal distance from the origin
  • y is the vertical distance from the origin

The standard equation for a straight line is:

y=mx+b

Let’s break it down:

  • The b variable represents the y-intercept: the y-value where the line crosses the y-axis
  • The m variable represents the slope: how steep the line is and whether it rises or falls as you move to the right
  • The x and y variables represent coordinates (x,y) that lie on the line

The equation for the line below is y=2x+1.

slope line equation graph of y=2x+1

Slope of a line

To find the slope of a line, pick any two points on the line and compare how much y changes to how much x changes. Slope is often written as a fraction:

  • the change in y is the numerator (the rise)
  • the change in x is the denominator (the run)

This is why slope is described as rise over run, or ΔxΔy​.

You’ll use the formula below to find the slope of a line passing through two points.

m=x2​−x1​y2​−y1​​

The y-intercept of a line

The y-intercept is the point where a line crosses the y-axis. That happens when x=0.

In the example line above, the line passes through the point 0,1, so the y-intercept is 1.

In the equation, that means b=1:

yy​=mx+b=2x+1​

Distance and midpoint formulas

To find the distance between two points, we use the distance formula. It comes from the Pythagorean Theorem: the horizontal change (x2​−x1​) and vertical change (y2​−y1​) form the legs of a right triangle, and the distance is the hypotenuse.

Distance=(x2​−x1​)2+(y2​−y1​)2​

The midpoint of two points is found by averaging their x-coordinates and averaging their y-coordinates.

Midpoint=(2x1​+x2​​,2y1​+y2​​)

Here is an AMC question that uses the midpoint formula directly.

Example: The question below is from 2023 AMC 12A

PointsA and B lie on the graph of y=log2​x. The midpoint of AB is (6,2). What is the positive difference between the x-coordinates of A and B?
A. 211​
B. 43​
C. 8
D. 45​
E. 9

(spoiler)

Answer: D. 45​

Inequalities on the coordinate plane

An equation involving x and y can be graphed as a line. If you replace the equals sign with an inequality, the boundary line is still the same, but the solution set changes.

  • With an equation, solutions lie on the line.
  • With an inequality, solutions lie in a region above or below the line.

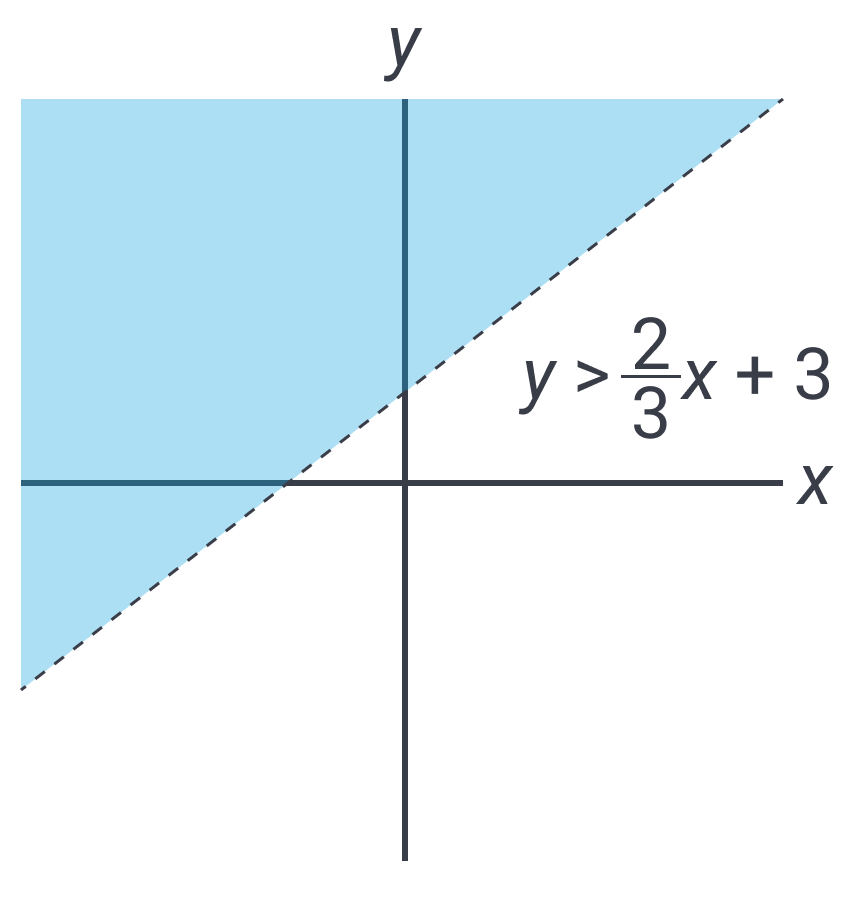
Here is an inequality written in the same style as y=mx+b. The solutions are all the points above the line, not just the points on the line.
graphing inequalities 01

To decide which side of the line to shade, first rewrite the inequality in a form like y=mx+b.

  • If the inequality is > or ≥ then shade above the line.
  • If the inequality is < or ≤ then shade below the line.

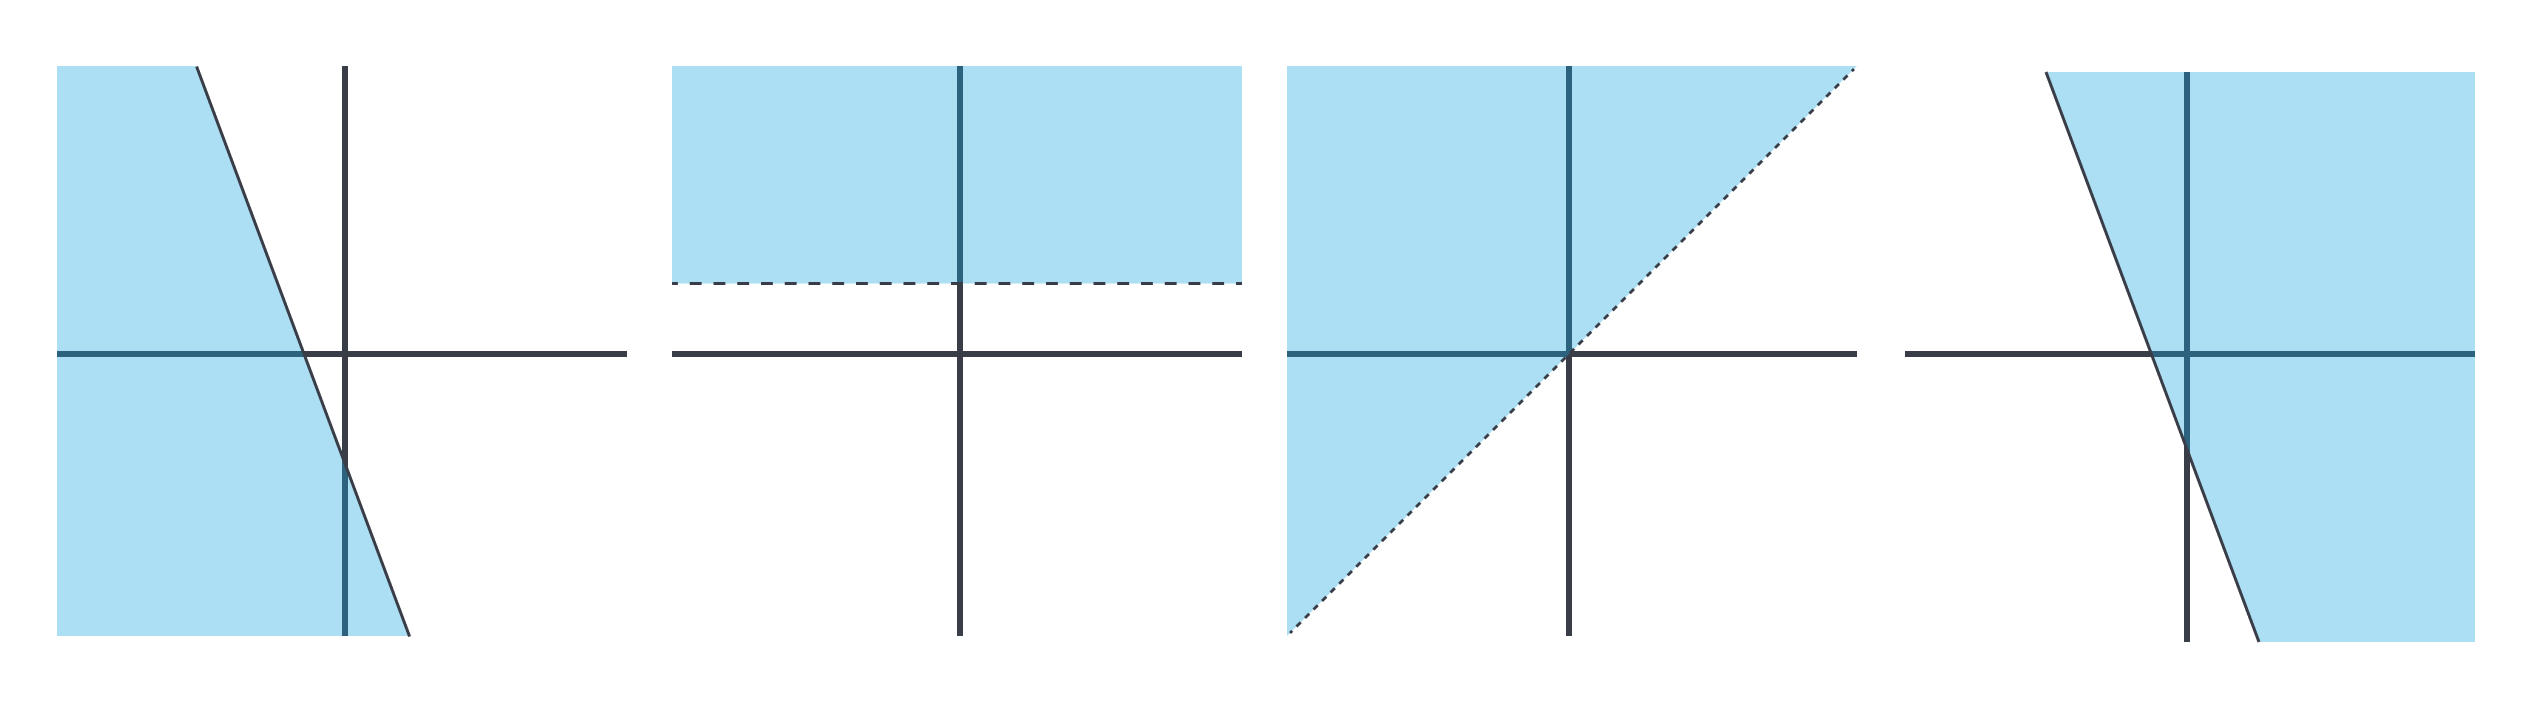
Try to match each inequality with a graph drawn below.
y>2
y>x
y≤−2x−2
y≥−2x−2\

graphing inequalities 02

Equation for a circle

(x−a)2+(y−b)2=r2

center of the circle is (a,b)

For the example below, set up the equations of the two circles and solve for their points of intersection. Then use the slope formula to find the slope of the line through those intersection points.

Example: The question below is from 2023 AMC 12B

In thexy-plane, a circle of radius 4 with center on the positive x-axis is tangent to the y-axis at the origin, and a circle with radius 10 with center on the positive y-axis is tangent to the x-axis at the origin. What is the slope of the line passing through the two points at which these circles intersect?
A. 72​
B. 73​
C. 29​2​
D. 29​1​
E. 52​

(spoiler)

Answer: E. 52​

Pick’s theorem

Pick’s Theorem gives the area of a polygon drawn on a coordinate grid when you know how many lattice points are inside it and on its boundary.

A key detail: the lattice points must come from a standard grid (spacing of 1 unit). If the grid spacing is every .5 or 2 units, those points are not standard lattice points.

Area=I+2B​−1

I=number of lattice points in the shape

B=number of lattice points on the boundary of the shape

This formula says:

  • start with the number of interior lattice points
  • add half the number of boundary lattice points
  • subtract 1

Try solving this question using the formula above.

Example: The question below is from 2004 AMC 8

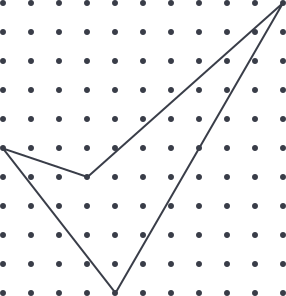
What is the area enclosed by the geoboard quadrilateral below?

Geoboard quadrilateral

A. 15
B. 1821​
C. 2221​
D. 27
E. 41

(spoiler)

Answer: C. 2221​

More advanced topics, such as symmetry and transformations on the Cartesian plane, will be discussed in a later section.

Common themes

  • Lattice point is just the name for the points drawn out on the coordinate plane. Any intersection of grid lines are considered lattice points.

  • Remember that the distance between two points can also be thought of as the hypotenuse of a right triangle. The change in x and the change in y in the distance formula essentially represent the lengths of the two legs of the right triangle.

  • Even though a coordinate grid should make diagrams appear to scale, you should still verify slopes, distances, or angles instead of relying on appearance.

Coordinate plane basics\

  • 2D plane with x-axis (horizontal) and y-axis (vertical)
  • Points written as (x,y): x = horizontal distance, y = vertical distance

Equation of a line\

  • Standard form: y=mx+b
    • m = slope (steepness, direction)
    • b = y-intercept (where line crosses y-axis)
  • (x,y) are coordinates on the line

Slope of a line\

  • Slope formula: m=x2​−x1​y2​−y1​​
  • Slope = rise over run (ΔxΔy​)

Y-intercept of a line\

  • Point where x=0
  • In y=mx+b, b is the y-intercept

Distance and midpoint formulas\

  • Distance between (x1​,y1​) and (x2​,y2​):
    • (x2​−x1​)2+(y2​−y1​)2​
  • Midpoint between (x1​,y1​) and (x2​,y2​):
    • (2x1​+x2​​,2y1​+y2​​)

Inequalities on the coordinate plane\

  • Replace = with >, <, ≥, or ≤ for regions above/below the line
    • > or ≥: shade above the line
    • < or ≤: shade below the line
  • Equation: solutions on the line; inequality: solutions in a region

Equation for a circle\

  • (x−a)2+(y−b)2=r2
    • Center at (a,b)
    • Radius r

Pick’s Theorem\

  • Area of lattice polygon: I+2B​−1
    • I = interior lattice points
    • B = boundary lattice points
  • Only applies to standard grid (spacing 1 unit)

Common themes\

  • Lattice point: intersection of grid lines on coordinate plane
  • Distance formula = hypotenuse of right triangle with legs Δx, Δy
  • Always verify slopes, distances, and angles - do not trust diagrams alone

Sign up for free to take 6 quiz questions on this topic

Previous
Next  | 3.1 Factors and multiples
All rights reserved ©2016 - 2026 Achievable, Inc.

Coordinate geometry

This chapter applies to all AMC 8/10/12 test takers.

Coordinate geometry is the study of shapes and lines drawn on a coordinate (Cartesian) plane. A 2D coordinate plane has an x-axis (horizontal) and a y-axis (vertical). Any point is written as an ordered pair (x,y), where:

  • x is the horizontal distance from the origin
  • y is the vertical distance from the origin

The standard equation for a straight line is:

y=mx+b

Let’s break it down:

  • The b variable represents the y-intercept: the y-value where the line crosses the y-axis
  • The m variable represents the slope: how steep the line is and whether it rises or falls as you move to the right
  • The x and y variables represent coordinates (x,y) that lie on the line

The equation for the line below is y=2x+1.

slope line equation graph of y=2x+1

Slope of a line

To find the slope of a line, pick any two points on the line and compare how much y changes to how much x changes. Slope is often written as a fraction:

  • the change in y is the numerator (the rise)
  • the change in x is the denominator (the run)

This is why slope is described as rise over run, or ΔxΔy​.

You’ll use the formula below to find the slope of a line passing through two points.

m=x2​−x1​y2​−y1​​

The y-intercept of a line

The y-intercept is the point where a line crosses the y-axis. That happens when x=0.

In the example line above, the line passes through the point 0,1, so the y-intercept is 1.

In the equation, that means b=1:

yy​=mx+b=2x+1​

Distance and midpoint formulas

To find the distance between two points, we use the distance formula. It comes from the Pythagorean Theorem: the horizontal change (x2​−x1​) and vertical change (y2​−y1​) form the legs of a right triangle, and the distance is the hypotenuse.

Distance=(x2​−x1​)2+(y2​−y1​)2​

The midpoint of two points is found by averaging their x-coordinates and averaging their y-coordinates.

Midpoint=(2x1​+x2​​,2y1​+y2​​)

Here is an AMC question that uses the midpoint formula directly.

Example: The question below is from 2023 AMC 12A

PointsA and B lie on the graph of y=log2​x. The midpoint of AB is (6,2). What is the positive difference between the x-coordinates of A and B?
A. 211​
B. 43​
C. 8
D. 45​
E. 9

(spoiler)

Answer: D. 45​

Inequalities on the coordinate plane

An equation involving x and y can be graphed as a line. If you replace the equals sign with an inequality, the boundary line is still the same, but the solution set changes.

  • With an equation, solutions lie on the line.
  • With an inequality, solutions lie in a region above or below the line.

Here is an inequality written in the same style as y=mx+b. The solutions are all the points above the line, not just the points on the line.

graphing inequalities 01

To decide which side of the line to shade, first rewrite the inequality in a form like y=mx+b.

  • If the inequality is > or ≥ then shade above the line.
  • If the inequality is < or ≤ then shade below the line.

Try to match each inequality with a graph drawn below.

y>2
y>x
y≤−2x−2
y≥−2x−2\

graphing inequalities 02

Equation for a circle

(x−a)2+(y−b)2=r2

center of the circle is (a,b)

For the example below, set up the equations of the two circles and solve for their points of intersection. Then use the slope formula to find the slope of the line through those intersection points.

Example: The question below is from 2023 AMC 12B

In thexy-plane, a circle of radius 4 with center on the positive x-axis is tangent to the y-axis at the origin, and a circle with radius 10 with center on the positive y-axis is tangent to the x-axis at the origin. What is the slope of the line passing through the two points at which these circles intersect?
A. 72​
B. 73​
C. 29​2​
D. 29​1​
E. 52​

(spoiler)

Answer: E. 52​

Pick’s theorem

Pick’s Theorem gives the area of a polygon drawn on a coordinate grid when you know how many lattice points are inside it and on its boundary.

A key detail: the lattice points must come from a standard grid (spacing of 1 unit). If the grid spacing is every .5 or 2 units, those points are not standard lattice points.

Area=I+2B​−1

I=number of lattice points in the shape

B=number of lattice points on the boundary of the shape

This formula says:

  • start with the number of interior lattice points
  • add half the number of boundary lattice points
  • subtract 1

Try solving this question using the formula above.

Example: The question below is from 2004 AMC 8

What is the area enclosed by the geoboard quadrilateral below?

Geoboard quadrilateral

A. 15
B. 1821​
C. 2221​
D. 27
E. 41

(spoiler)

Answer: C. 2221​

More advanced topics, such as symmetry and transformations on the Cartesian plane, will be discussed in a later section.

Common themes

  • Lattice point is just the name for the points drawn out on the coordinate plane. Any intersection of grid lines are considered lattice points.

  • Remember that the distance between two points can also be thought of as the hypotenuse of a right triangle. The change in x and the change in y in the distance formula essentially represent the lengths of the two legs of the right triangle.

  • Even though a coordinate grid should make diagrams appear to scale, you should still verify slopes, distances, or angles instead of relying on appearance.

Key points

Coordinate plane basics\

  • 2D plane with x-axis (horizontal) and y-axis (vertical)
  • Points written as (x,y): x = horizontal distance, y = vertical distance

Equation of a line\

  • Standard form: y=mx+b
    • m = slope (steepness, direction)
    • b = y-intercept (where line crosses y-axis)
  • (x,y) are coordinates on the line

Slope of a line\

  • Slope formula: m=x2​−x1​y2​−y1​​
  • Slope = rise over run (ΔxΔy​)

Y-intercept of a line\

  • Point where x=0
  • In y=mx+b, b is the y-intercept

Distance and midpoint formulas\

  • Distance between (x1​,y1​) and (x2​,y2​):
    • (x2​−x1​)2+(y2​−y1​)2​
  • Midpoint between (x1​,y1​) and (x2​,y2​):
    • (2x1​+x2​​,2y1​+y2​​)

Inequalities on the coordinate plane\

  • Replace = with >, <, ≥, or ≤ for regions above/below the line
    • > or ≥: shade above the line
    • < or ≤: shade below the line
  • Equation: solutions on the line; inequality: solutions in a region

Equation for a circle\

  • (x−a)2+(y−b)2=r2
    • Center at (a,b)
    • Radius r

Pick’s Theorem\

  • Area of lattice polygon: I+2B​−1
    • I = interior lattice points
    • B = boundary lattice points
  • Only applies to standard grid (spacing 1 unit)

Common themes\

  • Lattice point: intersection of grid lines on coordinate plane
  • Distance formula = hypotenuse of right triangle with legs Δx, Δy
  • Always verify slopes, distances, and angles - do not trust diagrams alone

More from Geometry

  • Triangles
  • Circles
  • Lines and angles
  • Quadrilaterals and polygons
  • Area and perimeter