Demographic shifts and populations
Theories of demographic change
Malthusian
- Thomas Malthus, an early 19th-century English clergyman, predicted that Earth’s population would eventually exceed its ability to sustain itself. He argued that three “positive checks” - war, famine, and disease - would curb overpopulation by increasing mortality rates. These were balanced by “preventive checks,” such as birth control and celibacy, which reduced fertility rates. Malthus believed food production could not keep up with exponential population growth, leading to starvation, conflict, and repeated cycles of population decline.
- However, his predictions did not come true. Advances in food production, medical innovations, and widespread contraception have helped sustain population growth. Still, some argue that Malthus’ concerns remain relevant, warning that Earth’s resources may eventually be depleted.
Zero population growth
- Paul Ehrlich, a neo-Malthusian researcher, expanded Malthus’ ideas by focusing on environmental degradation rather than food shortages. He warned that overpopulation, combined with resource depletion and pollution, could lead to environmental collapse. Ehrlich advocated for zero population growth (ZPG), where births and immigration equal deaths and emigration, stabilizing the population. While opinions on ZPG are mixed, it remains a debated solution to overpopulation concerns.
Cornucopian theory
- Cornucopian theory rejects the idea that overpopulation will lead to catastrophe. Instead, it argues that human ingenuity can solve environmental and social challenges. Supporters believe that advances in science and technology, such as agricultural innovations, will continue to meet growing needs, as they have for centuries.
Demographic transition theory
-
Demographic transition theory describes four stages of population change as societies shift from pre-industrial to post-industrial.
- Stage 1: High birth, death, and infant mortality rates; short life expectancy (e.g., 1800s U.S.).
- Stage 2: Declining death and infant mortality rates, but high birth rates; life expectancy increases (e.g., Afghanistan).
- Stage 3: Birth rates decline, while life expectancy continues to rise; death rates remain low (e.g., Mexico).
- Stage 4: Low birth and death rates, longer life expectancy, and population stability or decline (e.g., Sweden).
Population growth and decline
Population composition summarizes a population’s demographic characteristics, including fertility, mortality, and migration rates. It also includes the sex ratio (the number of men for every hundred women). Sociologists use population composition to identify trends and anticipate social and economic challenges.
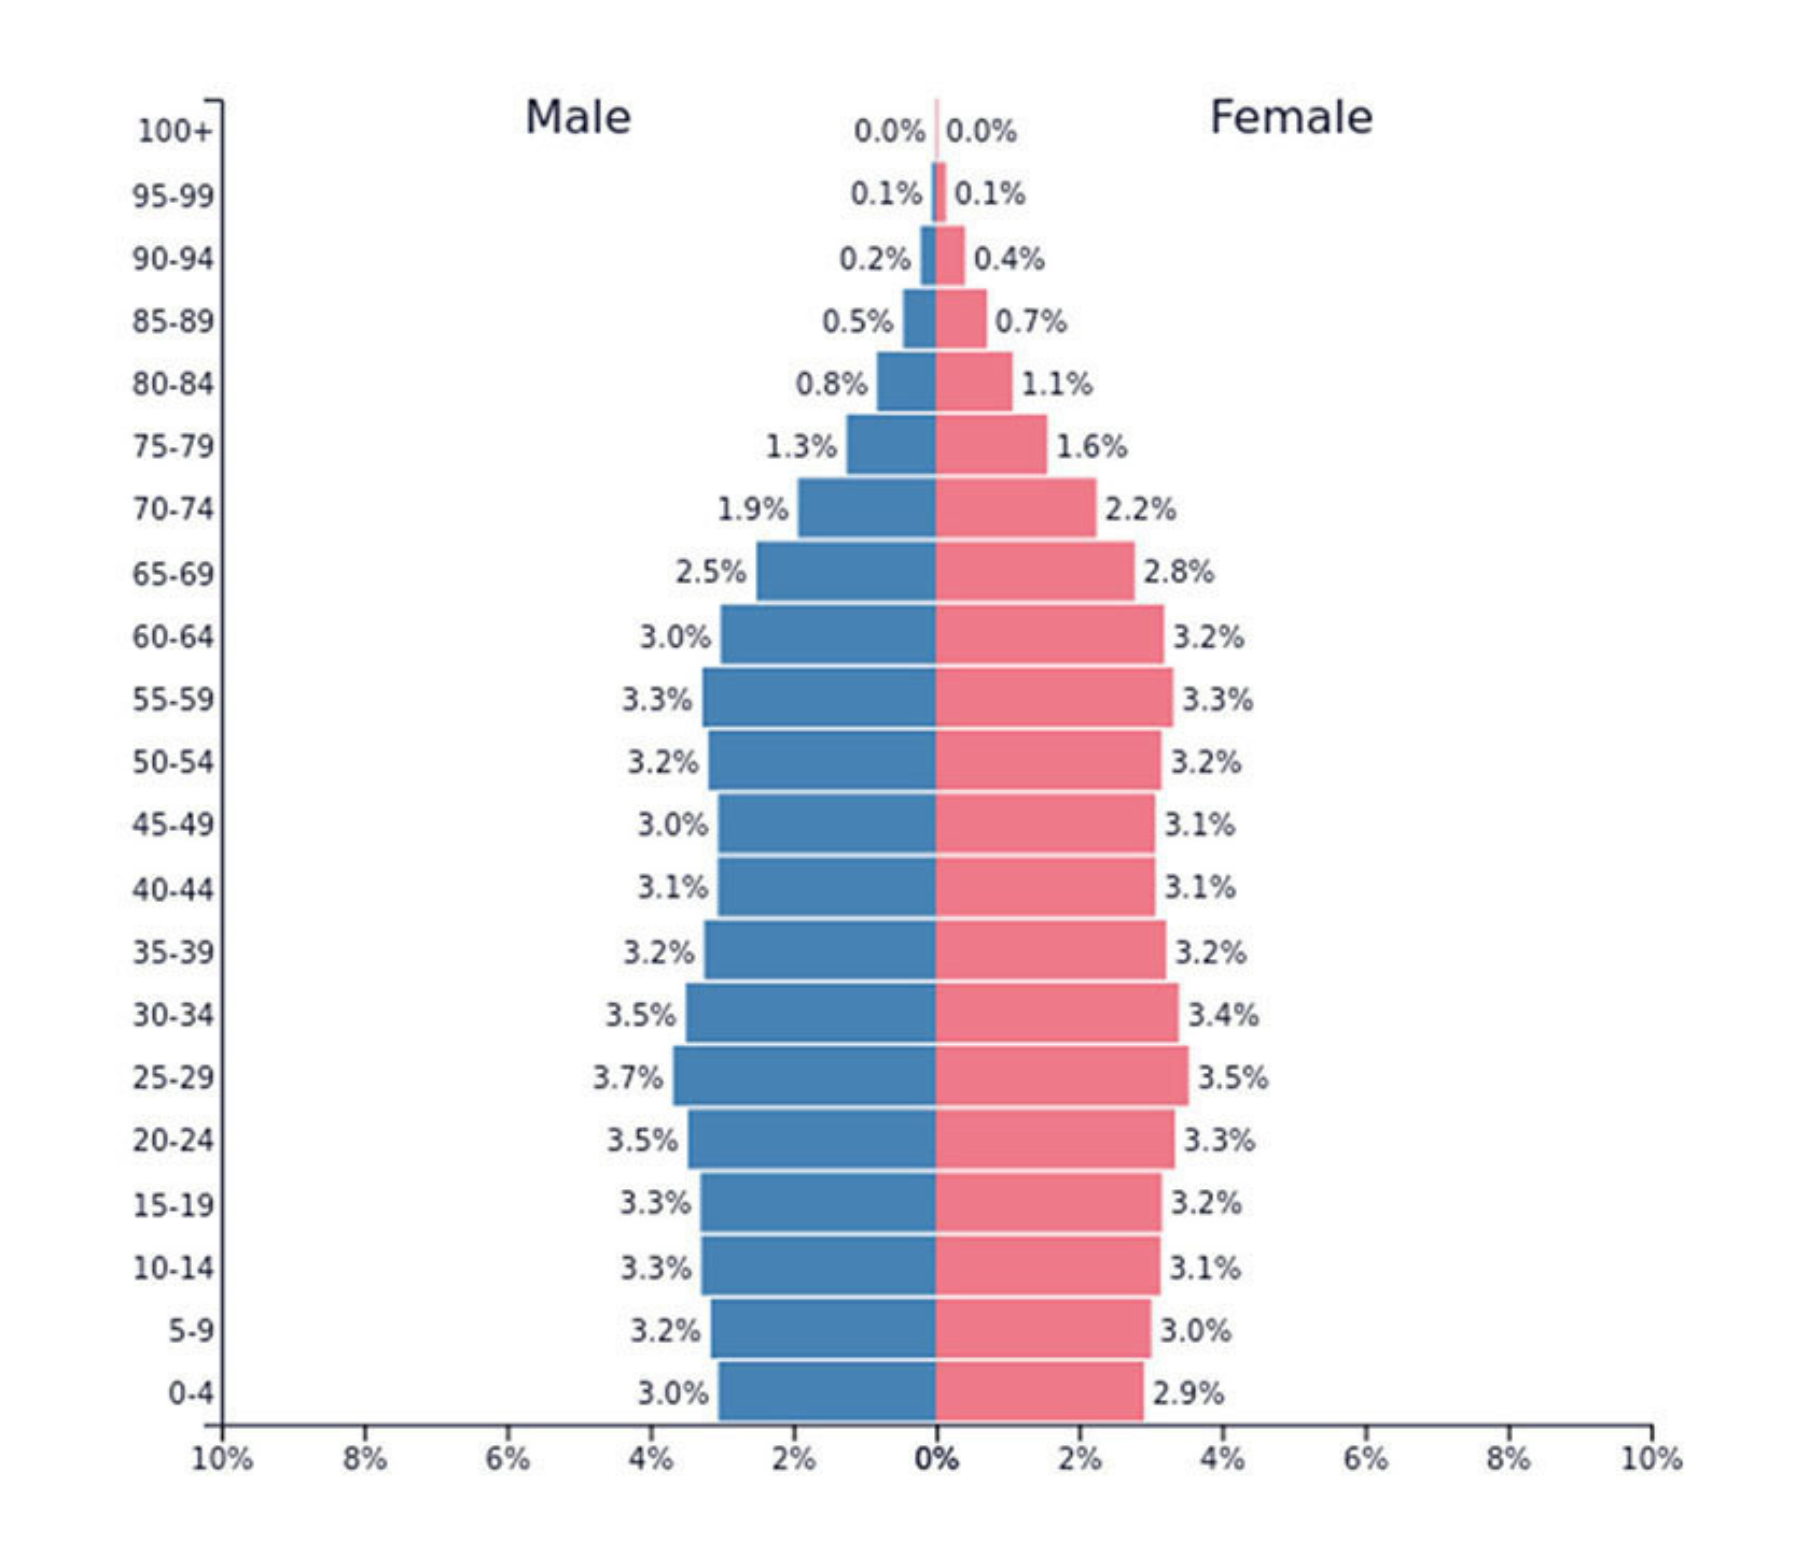
A population pyramid is a graph that shows how a population is distributed by age and sex. It helps you spot patterns such as an aging population or a population with many young people, which can shape future needs (for example, schools, jobs, healthcare, and retirement systems).
Interpreting population pyramids:
- Bottom-heavy → Indicates population growth with a high birth rate.
- Top-heavy (“Upside down”) → Suggests population decline due to low birth rates and an aging population.
- Side-skewed → Reflects gender imbalance within the population.
Key steps in population projection:
- Gathering data - Uses census records, birth/death rates, and migration statistics.
- Analyzing birth rates - Estimates how many people will be added through births.
- Assessing death rates - Estimates population loss and changes in life expectancy.
- Tracking migration - Accounts for immigration and emigration.
- Applying statistical models - Uses methods like cohort-component analysis for forecasting.
- Considering social & policy factors - Adjusts for healthcare, economic trends, and government policies.
Projection scenarios:
- High growth - Higher birth rates and lower mortality.
- Low growth - Declining fertility and an aging population.
- Stable/declining - Low fertility with longer life expectancy.
Though not exact, these projections help guide urban planning, resource management, and economic policies.
Fertility, migration, and mortality
The United Nations Population Fund (UNPF) classifies countries based on fertility rates:
- High fertility (e.g., sub-Saharan Africa) - Population expected to triple by 2100.
- Intermediate fertility (e.g., U.S., India, Mexico) - Growth projected at 26%.
- Low fertility (e.g., China, Australia, Europe) - Population expected to decline by 20%.
Patterns in fertility and mortality
- Developed nations typically have low fertility and low mortality rates, which leads to slower population growth and aging populations.
Underdeveloped nations tend to have high fertility and high mortality rates, which can produce rapid population growth alongside higher infant and child mortality.
Push and pull factors in migration
- Push factors are conditions that lead someone to leave a place. These can include discrimination, persecution, high crime, or violence. They can also include natural disasters, famine, or economic pressures such as a lack of jobs.
- Pull factors are conditions that attract someone to a new place, such as a safer environment, a more stable climate, enough resources, job opportunities in a relevant sector, or greater societal acceptance.