



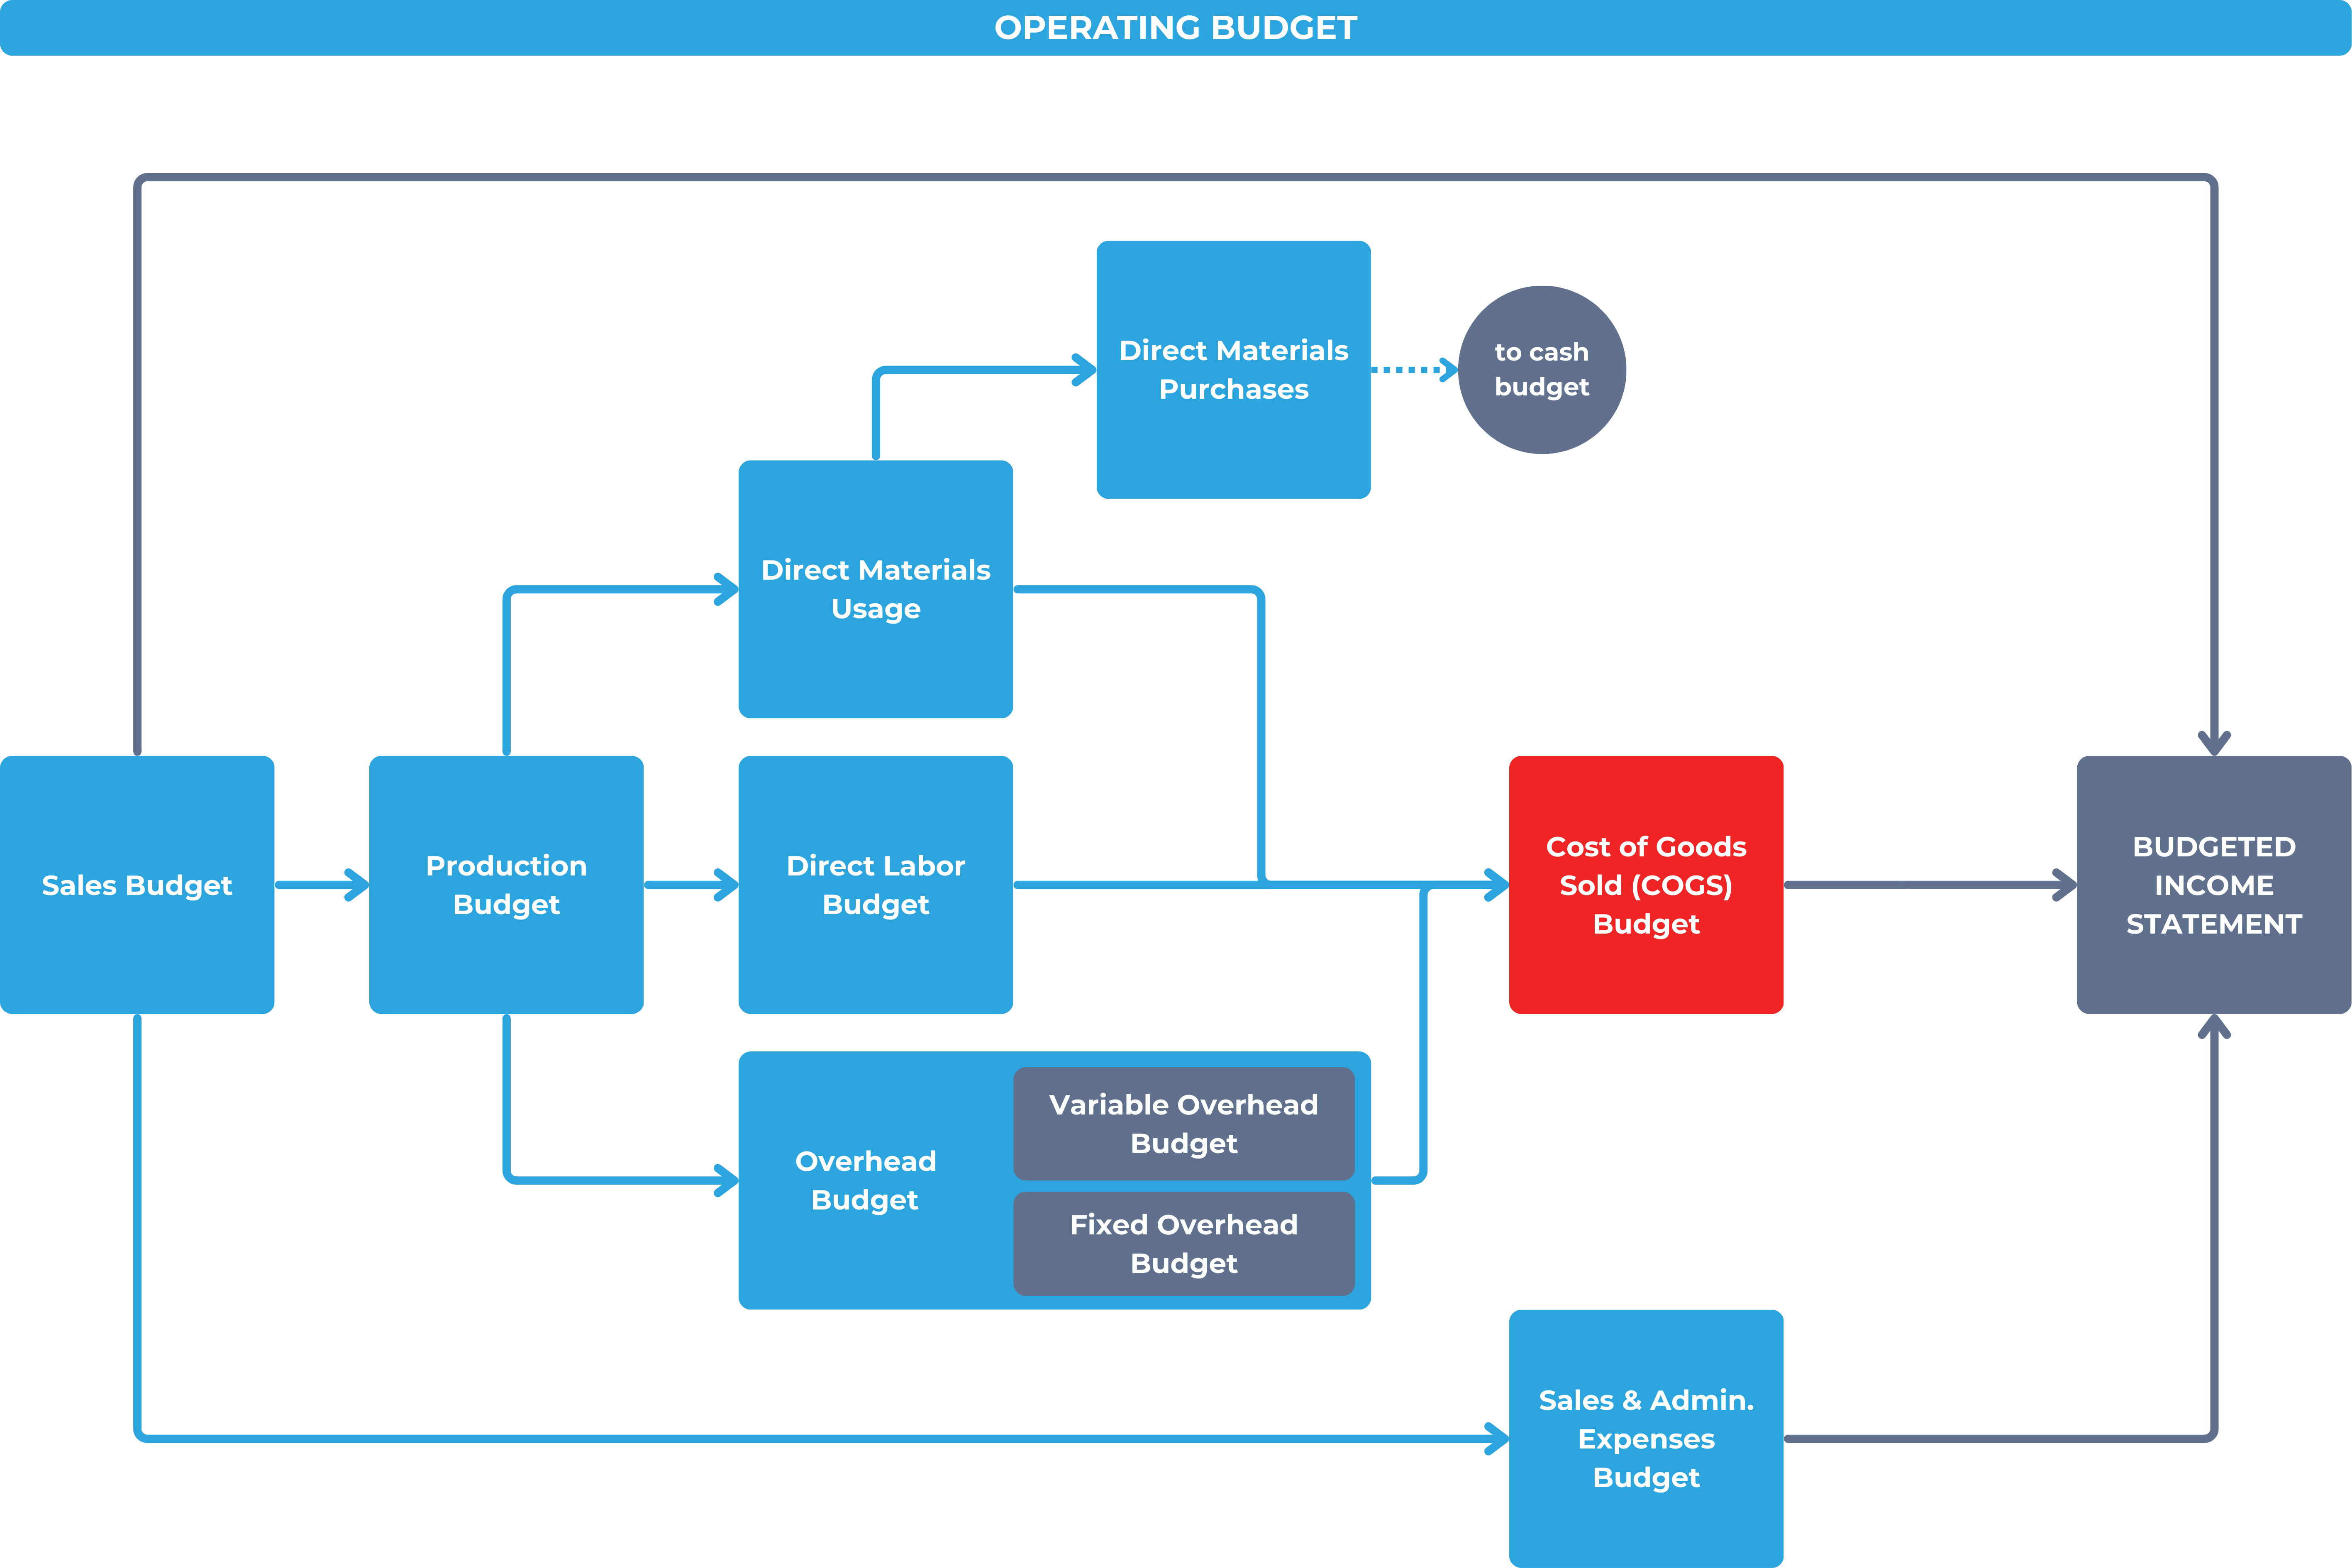
Cost of goods sold budget
Learning outcome statements
The learning outcome statements relevant for this section are:
- identify the components of a cost of goods sold budget and prepare a cost of goods sold budget
The cost of goods sold (COGS) budget details the total cost associated with units sold within the period. This budget is essential for calculating budgeted gross profit on the income statement. The COGS budget supports companies’ profitability analyses, helping track cost efficiency and project profit margins to ensure alignment with financial goals and inventory levels.
Components of the cost of goods sold (COGS) budget
The COGS budget includes three primary sections:
- Budgeted cost of goods manufactured (COGM): This encompasses all direct and indirect costs required to produce finished goods, including direct materials, direct labor, and overhead costs (both fixed and variable).
- Costing of finished goods inventory: This calculates the values of beginning inventory and ending inventory for finished goods. For inventory valuation, we apply the FIFO method for uniformity in the examples discussed in this section.
- Budgeted COGS schedule: The final schedule combines all these components, arriving at the total COGS for the period, feeding directly into the income statement.
1. Cost of goods manufactured (COGM)
The cost of goods manufactured (COGM) is a financial metric representing the total manufacturing costs incurred to produce goods that have been completed within a specific period. It includes the following:
- Direct materials
- Direct labor
- Variable overhead
- Fixed overhead
- Changes in work-in-process inventory (WIP) during the period
COGM is a key component in calculating the cost of goods sold (COGS), as it identifies the costs involved in producing finished goods available for sale. The COGM total flows into the COGS schedule, which ultimately feeds into the income statement, impacting gross profit and overall profitability.
Below are pro forma examples in table format for each type of company to illustrate the differences:
Manufacturing company (COGM calculation)
For manufacturing companies, COGM includes all production-related costs, specifically direct costs (like raw materials and labor) and indirect costs (like factory overhead).
| Cost component | Amount |
| Direct materials | XXX |
| Direct labor | XXX |
| Manufacturing overhead (variable + fixed) | XXX |
| Total manufacturing costs | XXX |
| Add: beginning WIP inventory | XXX |
| Less: ending WIP inventory | (XXX) |
| Cost of goods manufactured | XXX |
The WIP inventory represents partially completed goods still in the production phase, including costs for materials, labor, and overhead incurred up to a certain point in the manufacturing process. Unlike finished goods, WIP inventory has not yet been fully converted into saleable items, reflecting an investment in resources that will contribute to future periods’ cost of goods manufactured. WIP and its detailed cost accounting are explored further in Section C of CMA Part 1.
Retail company (COGP calculation)
Retail companies don’t manufacture products but rather purchase goods for resale, meaning they don’t incur production-related costs like direct labor or factory overhead. The equivalent of COGM for retailers is the cost of goods purchased (COGP), focusing only on costs related to purchasing and transporting inventory for resale.
| Cost component | Amount |
| Purchases of merchandise | XXX |
| Add: freight-in | XXX |
| Less: purchase returns & allowances | (XXX) |
| Total cost of goods purchased (COGP) | XXX |
The GreenLine Furniture COGM
Using GreenLine’s data, the following table outlines its cost of goods manufactured (COGM) for Q4, integrating direct and indirect costs, and adjusting for WIP inventory.
All the data presented below can be traced to the individual budgets of direct materials, direct labor and overhead from previous chapters.
- Direct materials: $12 per unit (4 direct materials required per unit at $3/direct material)
- Direct labor: $30 per unit (1.5 hours per unit at $20/hour)
- Variable overhead: $1.50 per unit (combined indirect materials and utilities)
- Fixed overhead: $4.09 per unit of allocated fixed cost - a rounded figure, since $22,500 of total fixed overhead allocated to 5,500 units produced works out to $4.0909… per unit
Total required production for Q4 = 5,500 units
Total cost per unit = $47.59 = direct materials ($12) + direct labor ($30) + variable overhead ($1.50) + fixed overhead per unit ($4.09)
Direct materials usage budget
From GreenLine Furniture’s example:
| Month | Production (units) | Material per unit | Total material required | Cost per unit of material | Total material cost |
| Total | 5,500 | 22,000 | $66,000 |
Direct labor budget
From GreenLine Furniture’s example:
| Month | Production units |
Direct labor (DL) hours per unit |
Total labor hours required (Units × DL per unit) |
Hourly DL rate | Total DL cost |
| Total | 5,500 | 8,250 | $165,000 |
Overhead budget
From GreenLine Furniture’s example:
| Month | Production units |
Variable overhead per unit |
Total variable overhead |
Rent | Insurance | Total fixed overhead |
Total overhead |
| Total | 5,500 | $8,250 | $22,500 | $30,750 |
Cost of goods manufactured
Combining all the manufacturing cost budgets above, we get the following:
| Cost component | Per unit cost | Total units produced | Total cost |
| Direct materials | $12 | 5,500 | $66,000 |
| Direct labor | $30 | 5,500 | $165,000 |
| Variable overhead | $1.5 | 5,500 | $8,250 |
| Fixed overhead | $4.09 | 5,500 | $22,500 |
| Total manufacturing costs | $261,750 | ||
| Add: beginning WIP inventory | $1,000 | ||
| Less: ending WIP inventory | ($1,500) | ||
| Cost of goods manufactured | $261,250 |
In this example, GreenLine’s beginning WIP inventory is $1,000 and its ending WIP inventory is $1,500. We’ve simplified the costing for the WIP because this is covered by another section. Because ending WIP is subtracted after beginning WIP is added, an increase in WIP (ending WIP greater than beginning WIP) lowers COGM relative to total manufacturing costs - the extra $500 stays tied up in unfinished units instead of flowing through to completed production. A decrease in WIP would have the opposite effect, raising COGM.
This completed COGM reflects all GreenLine’s production costs, which are now ready to flow into the cost of goods sold schedule as part of the larger budgeting process. This total captures the value of goods completed at the period.
2. Costing of finished goods inventory
In order to compute the COGS, we need the changes in finished goods inventory, which means that we need the costs of the beginning inventory and ending inventory.
For this example, we will use FIFO to ensure consistent valuation.
To determine the cost of the beginning inventory, the best option would be to pick-up the cost of ending inventory of the previous period and use it as the beginning inventory cost of the next period. For simplicity, we assume that the costs per unit remain the same as in the previous period. Under FIFO, ending inventory is normally valued at the most recent (current-period) per-unit cost while beginning inventory carries the prior period’s per-unit cost; here, both show $47.59 only because we’re assuming the per-unit cost didn’t change between periods. However, in practical scenarios, costs can vary due to production level changes, which would impact per-unit costs that are used to allocate to the ending inventories.
| Inventory (Q4) | Units | Cost per unit | Total cost |
| Beginning inventory | 500 | $47.59 | $23,795 |
| Ending inventory | 1,000 | $47.59 | $47,590 |
Please check the COGM section on how the cost per unit of $47.59 was computed. These computed costs will feed into the final COGS budget in the next section.
3. Cost of goods sold schedule
The relevant formula for the COGS schedule are as follows:
Here’s the final schedule for GreenLine Furniture’s COGS:
| Cost component | Amount |
| Beginning inventory | $23,795 |
| Cost of goods manufactured | $261,250 |
| Cost of goods available for sale | $285,045 |
| Less: ending inventory | $47,590 |
| Total budgeted COGS | $237,455 |
This COGS budget for GreenLine Furniture provides the total COGS as $237,455, which will flow into the income statement as the cost offsetting sales revenue for Q4 to determine the gross profit. This calculation offers a clear view of production and inventory costs, supporting GreenLine’s assessment of profitability and efficiency.