


Achievable logoAchievable logo
AP Statistics
Sign in
Sign up
Purchase
Textbook
Practice exams
Support
How it works
Resources
Exam catalog
Mountain with a flag at the peak
Textbook
Introduction
1. One variable data
2. Two variable data
2.1 Two categorical variables
2.2 Two quantitative variables
2.3 Least squares regression
2.4 Outliers, leverage, and influential points
3. Data collection
4. Probability and random variables
5. Sampling distributions
6. Categorical data
7. Quantitative data
8. Chi-square
9. Linear regression
Wrapping up
Achievable logoAchievable logo
2.1 Two categorical variables
Achievable AP Statistics
2. Two variable data
Our AP Statistics course is currently in development and is a work-in-progress.

Two categorical variables

6 min read
Font
Discuss
Share
Feedback

Data organization

When you’re studying two categorical variables, you’ll often want to know whether they’re associated. In other words, does knowing one variable give you information about the other?

A common way to organize this kind of data is with a two-way table (also called a contingency table). A two-way table shows the frequency (count) for every combination of categories. It’s also helpful to compute row totals and column totals, since those totals let you find proportions (relative frequencies).

Example:

Some people were surveyed and were asked about their hair color and whether or not they have at least one pet. Here are the results:

Brown Hair Black Hair Blonde Hair Total
Has at least one pet 55 42 32
Does not have a pet 23 17 21
Total

Before answering questions about the results, fill in the totals:

  • Row totals: add across each row to find the total number of people in each pet-status group.
  • Column totals: add down each column to find the total number of people in each hair-color group.
  • Grand total: add either all row totals or all column totals to find the total number of people surveyed.

The “total” row and “total” column should give the same grand total if everything is added correctly.

Brown Hair Black Hair Blonde Hair Total
Has at least one pet 55 42 32 55+42+32=129
Does not have a pet 23 17 21 23+17+21=61
Total 55+23=78 42+17=59 32+21=53 (78+59+53 or 129+61) =190

Practice problem

Part 1.

1. How many people were surveyed in total?

You can find this by adding the column totals (brown hair + black hair + blonde hair) or by adding the row totals (total with at least one pet + total with no pet).

Solution to part 1:

(spoiler)

190 people were surveyed in total.

Part 2.

2. How many people surveyed had black hair?

Look at the black-hair column total: 42+17=59.

Solution to part 2:

(spoiler)

59 people surveyed had black hair.

Part 3.

3. What is the relative frequency of people with black hair?

Relative frequency means “what fraction of the whole group is in this category.” Since 59 people have black hair out of 190 total, the relative frequency is 19059​.

Solution to part 3:

(spoiler)

19059​≈31%

Part 4.

4. What is the frequency of people who have at least one pet?

Look at the row total for “has at least one pet”: 55+42+32=129.

Solution to part 4:

(spoiler)

The frequency is 129.

Part 5.

5. What is the relative frequency of people who have at least one pet?

Since 129 people have at least one pet out of 190 total, the relative frequency is 190129​.

Solution to part 5:

(spoiler)

190129​≈68%

Part 6.

6. What is the conditional relative frequency of people with blonde hair given that they have at least one pet?

Conditional relative frequency means “within a specific group, what fraction is in a particular category?” Here, restrict attention to people who have at least one pet — a total of 129 people. Among them, 32 have blonde hair, so the conditional relative frequency is 12932​.

Solution to part 6:

(spoiler)

12932​≈25%

Part 7.

7. What is the conditional relative frequency of people who do not have any pets given that they have brown hair?

Restrict attention to people with brown hair — a total of 78 people. Among them, 23 do not have a pet, so the conditional relative frequency is 7823​.

Solution to part 7:

(spoiler)

7823​≈29%

Part 8.

8. What is the relative frequency of people with brown hair who have at least one pet?

This is a joint relative frequency: the fraction of the entire sample that has both brown hair and at least one pet. The count in that cell is 55, and the total surveyed is 190, so the relative frequency is 19055​.

Solution to part 8:

(spoiler)

19055​≈29%

Displaying the data

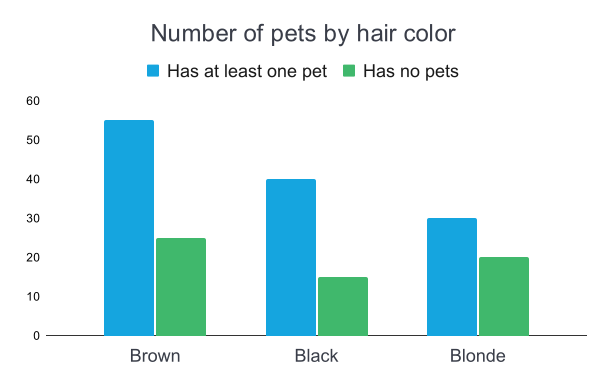
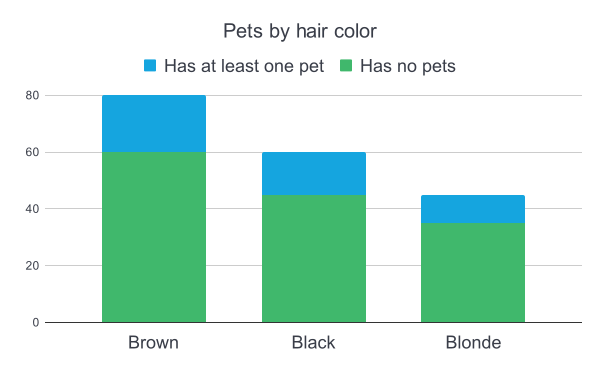
This data can also be displayed using a bar chart or a segmented bar chart. Both charts show the same data from the two-way table, just in a visual format.

In the bar chart below, each hair color has two bars side by side — one for people who have at least one pet, and one for people who don’t. This makes it easy to compare pet ownership within each hair color group.

Bar chart of pet ownership by hair color showing more people with pets than without.
Number of pets by hair color

In the segmented (stacked) bar chart below, each hair color has a single bar divided into two segments — one for pet owners and one for non-pet owners. The full height of each bar represents the total count for that hair color group. This format makes it easier to see how the two categories stack up within each group, and to compare the overall sizes of each hair color group.

Stacked bar chart of pet ownership by hair color with brown hair highest overall.
Number of pets by hair color stacked bar graph
Sidenote
Both chart types are useful!

Use a side-by-side bar chart when you want to compare counts directly, and a segmented bar chart when you want to emphasize the composition of each group.

Two-way (contingency) tables

  • Organize data for two categorical variables
  • Show frequencies for each category combination
  • Include row totals, column totals, and grand total

Calculating totals

  • Row totals: sum across each row
  • Column totals: sum down each column
  • Grand total: sum of all row or column totals; should match both ways

Frequency and relative frequency

  • Frequency: raw count for a category or combination
  • Relative frequency: proportion of total in a category
    • Formula: category count / grand total

Conditional relative frequency

  • Proportion within a specific subgroup
    • Formula: subgroup count / subgroup total
  • Used to compare categories within a group

Types of frequencies

  • Joint frequency: count in a single cell (both characteristics)
  • Marginal frequency: row or column total (one characteristic)
  • Joint relative frequency: proportion with both characteristics
  • Marginal relative frequency: proportion in one category overall
  • Conditional relative frequency: proportion within a subgroup

Visualizing two-way tables

  • Data can be shown with bar charts or segmented/stacked bar charts
  • Useful for comparing frequencies and proportions across groups

Sign up for free to take 8 quiz questions on this topic

Previous
Next  | 2.2 Two quantitative variables
All rights reserved ©2016 - 2026 Achievable, Inc.

Two categorical variables

Data organization

When you’re studying two categorical variables, you’ll often want to know whether they’re associated. In other words, does knowing one variable give you information about the other?

A common way to organize this kind of data is with a two-way table (also called a contingency table). A two-way table shows the frequency (count) for every combination of categories. It’s also helpful to compute row totals and column totals, since those totals let you find proportions (relative frequencies).

Example:

Some people were surveyed and were asked about their hair color and whether or not they have at least one pet. Here are the results:

Brown Hair Black Hair Blonde Hair Total
Has at least one pet 55 42 32
Does not have a pet 23 17 21
Total

Before answering questions about the results, fill in the totals:

  • Row totals: add across each row to find the total number of people in each pet-status group.
  • Column totals: add down each column to find the total number of people in each hair-color group.
  • Grand total: add either all row totals or all column totals to find the total number of people surveyed.

The “total” row and “total” column should give the same grand total if everything is added correctly.

Brown Hair Black Hair Blonde Hair Total
Has at least one pet 55 42 32 55+42+32=129
Does not have a pet 23 17 21 23+17+21=61
Total 55+23=78 42+17=59 32+21=53 (78+59+53 or 129+61) =190

Practice problem

Part 1.

1. How many people were surveyed in total?

You can find this by adding the column totals (brown hair + black hair + blonde hair) or by adding the row totals (total with at least one pet + total with no pet).

Solution to part 1:

(spoiler)

190 people were surveyed in total.

Part 2.

2. How many people surveyed had black hair?

Look at the black-hair column total: 42+17=59.

Solution to part 2:

(spoiler)

59 people surveyed had black hair.

Part 3.

3. What is the relative frequency of people with black hair?

Relative frequency means “what fraction of the whole group is in this category.” Since 59 people have black hair out of 190 total, the relative frequency is 19059​.

Solution to part 3:

(spoiler)

19059​≈31%

Part 4.

4. What is the frequency of people who have at least one pet?

Look at the row total for “has at least one pet”: 55+42+32=129.

Solution to part 4:

(spoiler)

The frequency is 129.

Part 5.

5. What is the relative frequency of people who have at least one pet?

Since 129 people have at least one pet out of 190 total, the relative frequency is 190129​.

Solution to part 5:

(spoiler)

190129​≈68%

Part 6.

6. What is the conditional relative frequency of people with blonde hair given that they have at least one pet?

Conditional relative frequency means “within a specific group, what fraction is in a particular category?” Here, restrict attention to people who have at least one pet — a total of 129 people. Among them, 32 have blonde hair, so the conditional relative frequency is 12932​.

Solution to part 6:

(spoiler)

12932​≈25%

Part 7.

7. What is the conditional relative frequency of people who do not have any pets given that they have brown hair?

Restrict attention to people with brown hair — a total of 78 people. Among them, 23 do not have a pet, so the conditional relative frequency is 7823​.

Solution to part 7:

(spoiler)

7823​≈29%

Part 8.

8. What is the relative frequency of people with brown hair who have at least one pet?

This is a joint relative frequency: the fraction of the entire sample that has both brown hair and at least one pet. The count in that cell is 55, and the total surveyed is 190, so the relative frequency is 19055​.

Solution to part 8:

(spoiler)

19055​≈29%

Displaying the data

This data can also be displayed using a bar chart or a segmented bar chart. Both charts show the same data from the two-way table, just in a visual format.

In the bar chart below, each hair color has two bars side by side — one for people who have at least one pet, and one for people who don’t. This makes it easy to compare pet ownership within each hair color group.


In the segmented (stacked) bar chart below, each hair color has a single bar divided into two segments — one for pet owners and one for non-pet owners. The full height of each bar represents the total count for that hair color group. This format makes it easier to see how the two categories stack up within each group, and to compare the overall sizes of each hair color group.

Sidenote
Both chart types are useful!

Use a side-by-side bar chart when you want to compare counts directly, and a segmented bar chart when you want to emphasize the composition of each group.

Key points

Two-way (contingency) tables

  • Organize data for two categorical variables
  • Show frequencies for each category combination
  • Include row totals, column totals, and grand total

Calculating totals

  • Row totals: sum across each row
  • Column totals: sum down each column
  • Grand total: sum of all row or column totals; should match both ways

Frequency and relative frequency

  • Frequency: raw count for a category or combination
  • Relative frequency: proportion of total in a category
    • Formula: category count / grand total

Conditional relative frequency

  • Proportion within a specific subgroup
    • Formula: subgroup count / subgroup total
  • Used to compare categories within a group

Types of frequencies

  • Joint frequency: count in a single cell (both characteristics)
  • Marginal frequency: row or column total (one characteristic)
  • Joint relative frequency: proportion with both characteristics
  • Marginal relative frequency: proportion in one category overall
  • Conditional relative frequency: proportion within a subgroup

Visualizing two-way tables

  • Data can be shown with bar charts or segmented/stacked bar charts
  • Useful for comparing frequencies and proportions across groups

More from Two variable data

  • Two quantitative variables
  • Least squares regression
  • Outliers, leverage, and influential points