



Outliers, leverage, and influential points
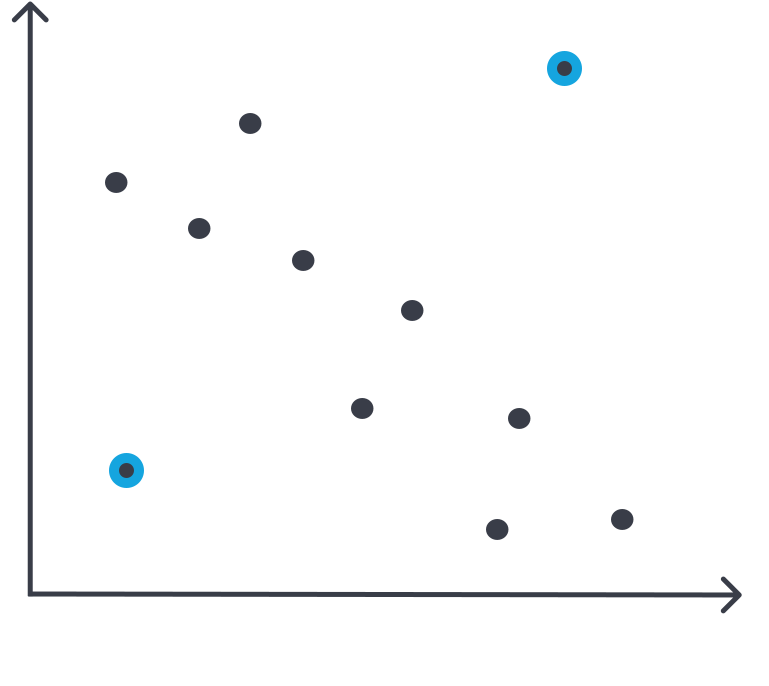
A regression outlier is easy to spot visually — it’s any point that stands out from the general trend of the data. The example below shows what this looks like on a scatterplot.
Example:
The points highlighted in blue are regression outliers because both fall far from the overall pattern in the data, which is roughly linear.
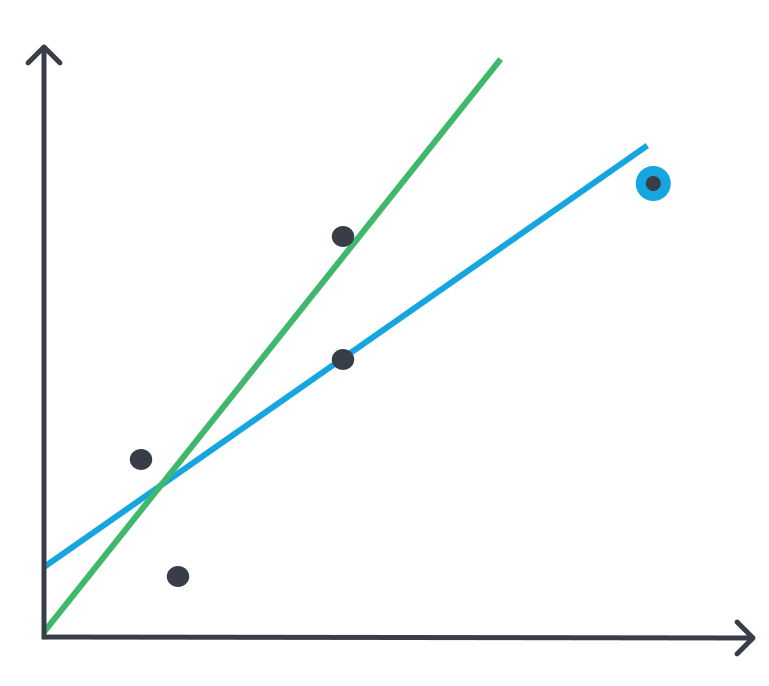
An influential point is closely related to outliers, but the key question is whether removing the point would noticeably change the regression line. The best way to check is to compare the regression line with and without the point included.
Example:
The blue line is the regression line using all the points, including the highlighted one. The red line is the regression line after removing the highlighted point (with all other points unchanged). Because the regression line changes noticeably when that point is removed, the highlighted point is an influential point.
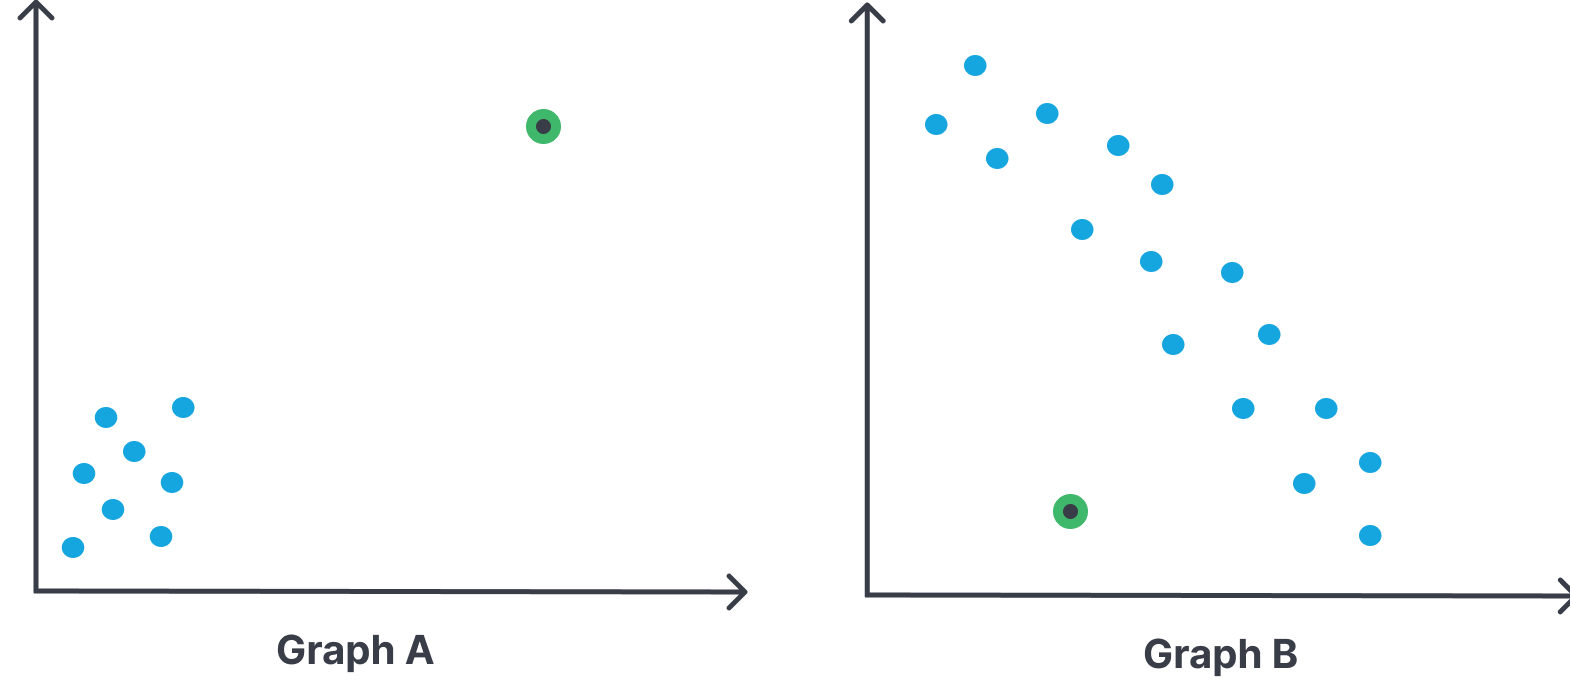
High leverage is about x-values, not y-values. A point can have high leverage without being an outlier at all — what matters is how far its x-value sits from the rest of the data. The example below compares a high-leverage point to one with little leverage.
Example:
In graph A, the point highlighted in purple has high leverage because its x-value is much larger than the x-values of the other points. In graph B, the point highlighted in purple has little to no leverage because its x-value is close to the mean of the other x-values.
It’s important to understand how these three concepts relate to each other — they often overlap, but they don’t always go together.
Practice problem
The following example brings all three concepts together. As you work through it, think about how the point relates to the overall trend, how it affects the regression line, and where its x-value falls relative to the rest of the data.
Part a.
Example: A scatter plot contains the following points: , , , , , , , , , .
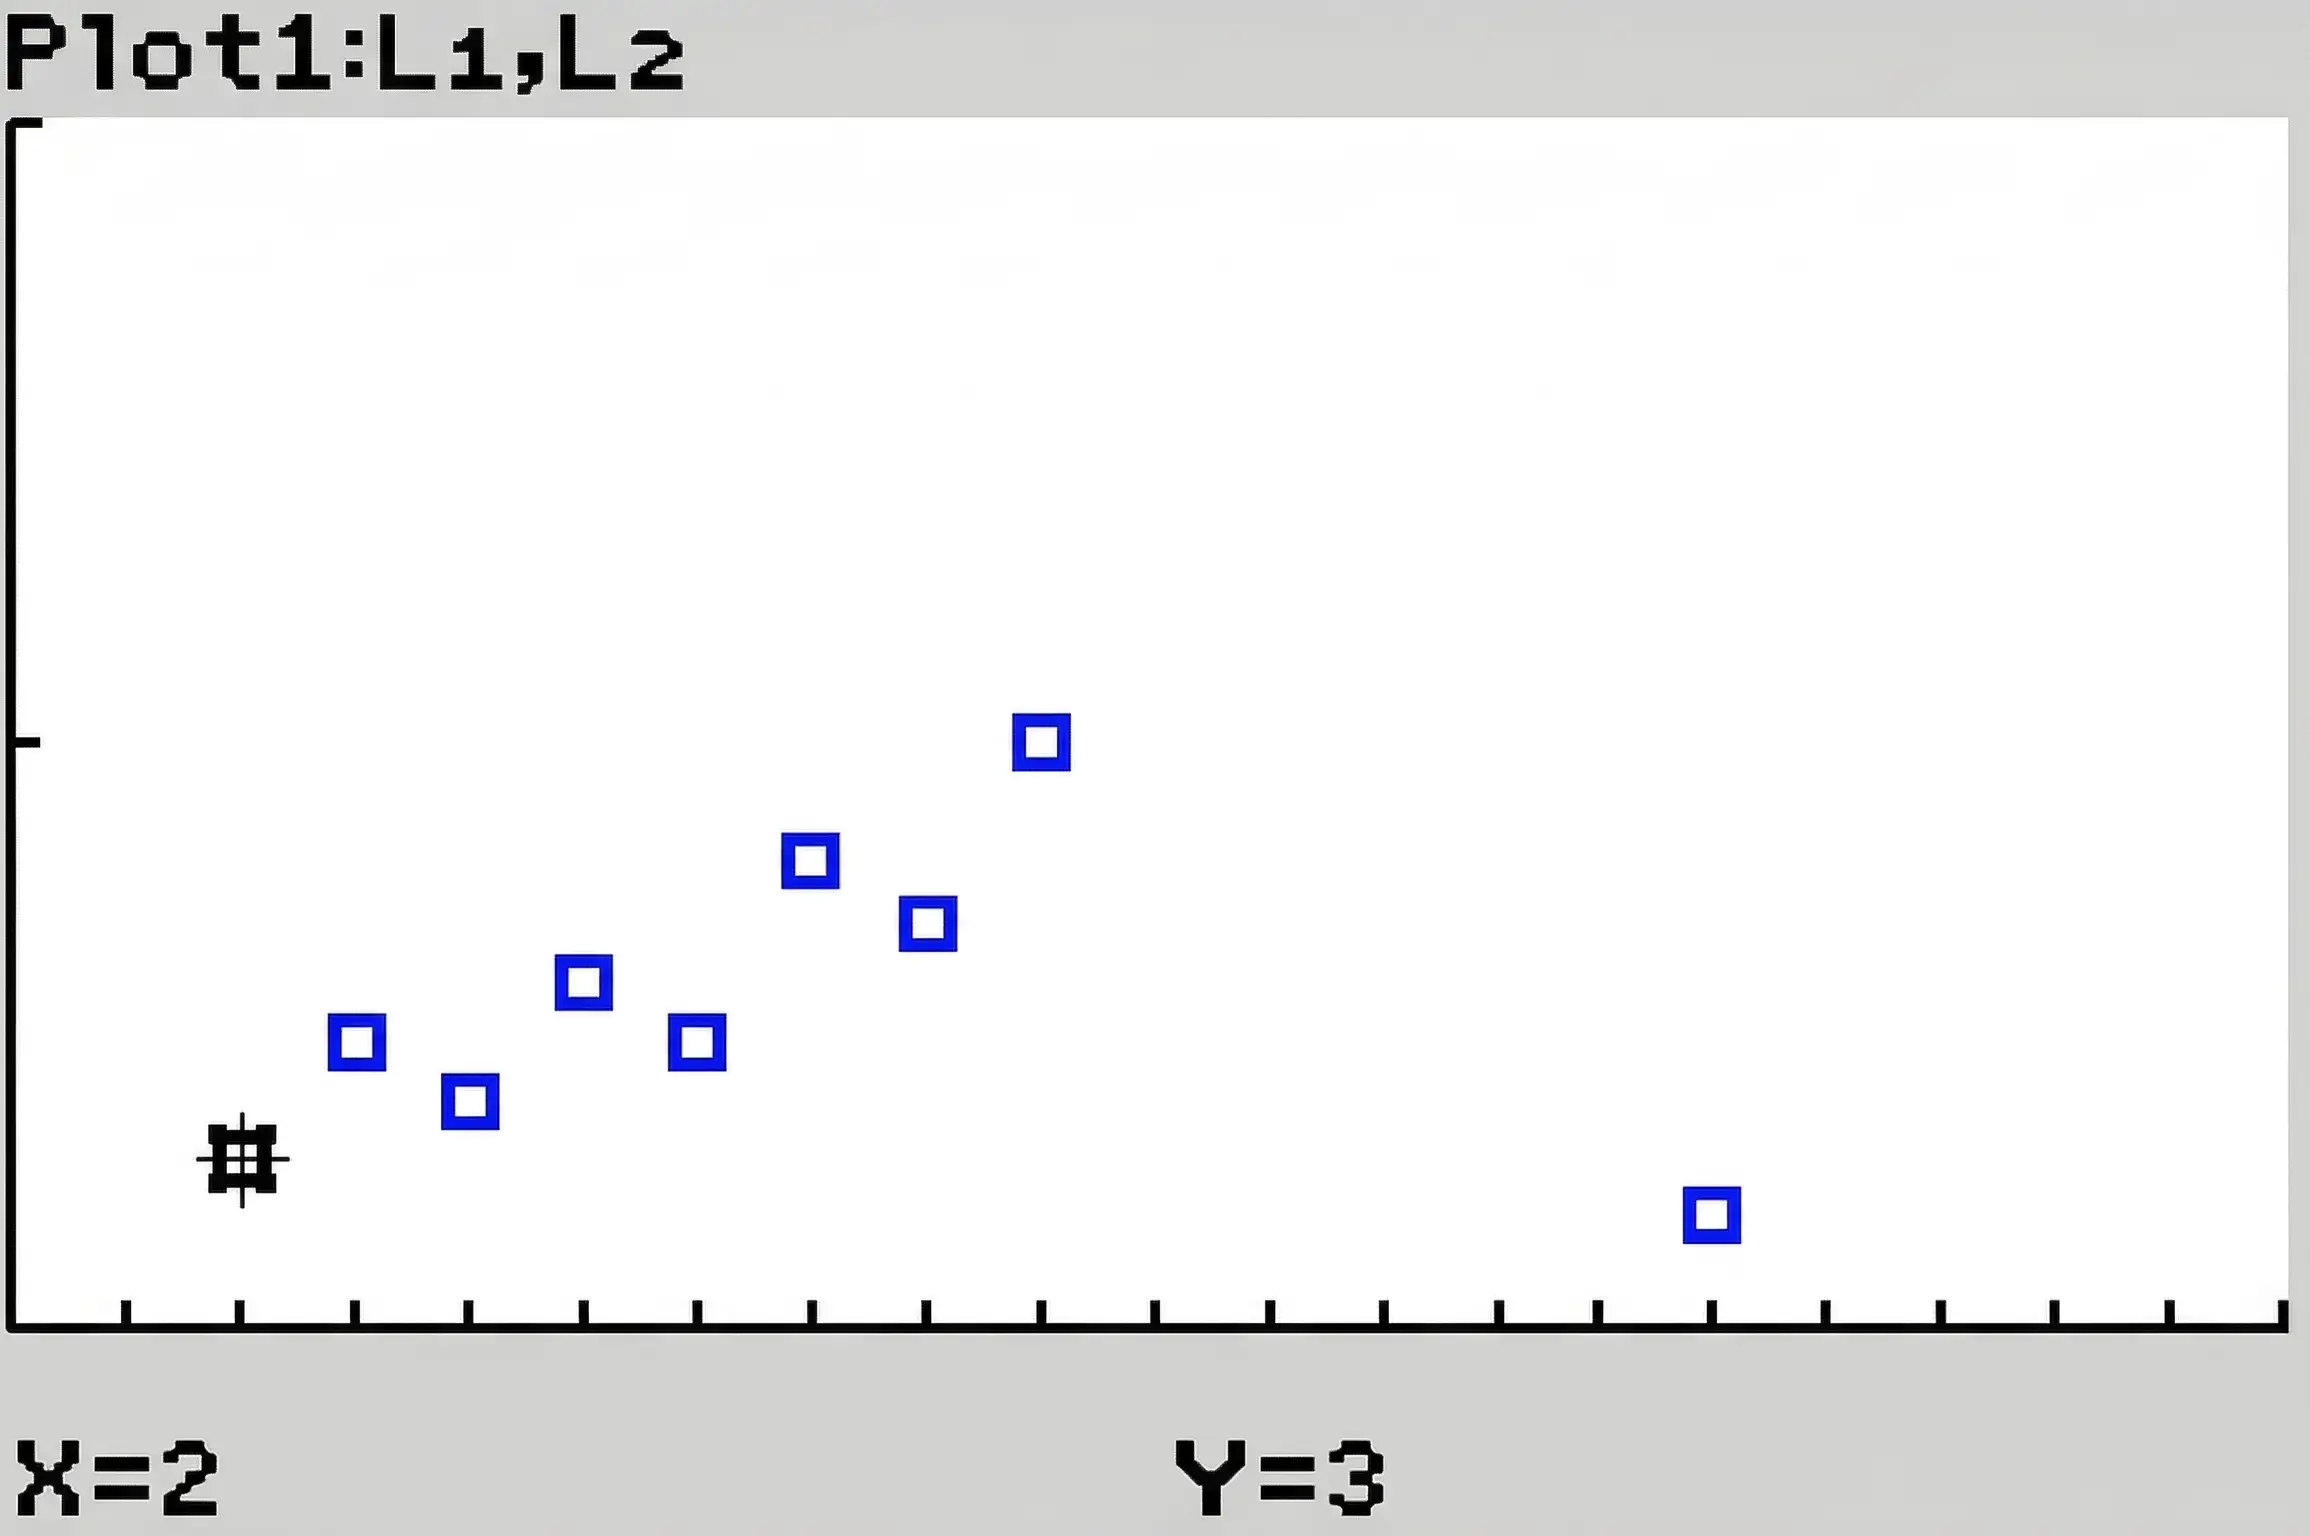
a. Plot the data in a scatter plot using your TI-84 calculator (or similar).
Use the video below for guidance on how to create a scatter plot on a TI-84 calculator.
Solution to part a:
Part b.
b. Explain why the point is an outlier, an influential point, and a high-leverage point.
Consider how compares to the overall pattern of the data, what happens to the regression line when it is removed, and where its x-value sits relative to the other x-values.
Solution to part b:
is an outlier because it falls far from the linear pattern shown by the rest of the data. It is an influential point because including it in the line of best fit would make the slope much less steep than it would be if the point were removed. is also a high-leverage point because its x-value is far from the mean of the x-values in the data set. :::"