Catalytic receptors: These are membrane-bound enzymes with both a ligand-binding site and a catalytic site. When a ligand binds, it changes the receptor’s catalytic activity. Examples include receptors for insulin, AT 2 angiotensin receptor, natriuretic peptide, prolactin, TLR and TNF. Insulin and prolactin receptors have tyrosine kinase activity.
Nuclear receptors: These receptors are activated by lipid-soluble agents that can easily cross the plasma membrane. They contain:
Nuclear receptors can exist as monomers, homodimers, or heterodimers. They recognize specific DNA sequences called hormone response elements. Once activated, they influence transcription through interactions with co-activators and co-repressors.
Estrogen, testosterone, glucocorticoids, mineralocorticoids, progesterone, retinoic acid, PPAR gamma, thyroid hormone and Vitamin D3
G protein coupled receptors (GPCR) or metabotropic receptors: When a ligand binds to a GPCR, the receptor undergoes a conformational change. This activates an associated G protein by exchanging bound GDP for GTP. The α subunit (with GTP bound) then dissociates from the β and γ subunits. This triggers an intracellular signaling cascade that activates or inhibits target enzymes. The specific second messengers produced depend on the type of G protein activated.
| Gq | Gs | Gi/o |
| Alpha 1, angiotensin AT1, bradykinin, calcitonin, muscarinic, 5 HT, CCK, endothelin, glutamate, GnRH, histamine, motilin, oxytocin, PTH, vasopressin (V1) | Adenosine,beta receptors, calcitonin, CCK, CRH, dopamine, endothelin, estrogen, glucagon, PTH, vasopressin (V2) | 5 HT, muscarinic, adenosine, alpha 2, chemokines, dopamine, endothelin, GABA B, glutamate, histamine, melatonin, opioid, oxytocin, |
Ionotropic receptors: These are membrane-bound, ligand-gated ion channels. Ligand binding changes ion flow through the channel into and out of the cell. Examples include 5HT 3, nicotinic, GABA A, glutamate (NMDA, kainate), and glycine receptors.
Soluble receptors: Some receptors exist in both membrane-bound and soluble forms. The soluble forms are extracellular portions of the membrane-bound receptor. Soluble forms are seen in receptors for cytokines like TNF alpha, IL and interferons, GH, erythropoietin and thrombopoietin. Soluble receptors can bind the ligand away from the cell and block the ligand’s action on the cell. For example, etanercept is a decoy (soluble) receptor for TNF alpha; it binds TNF alpha and blocks its action, so it’s used as therapy for RA and psoriasis.
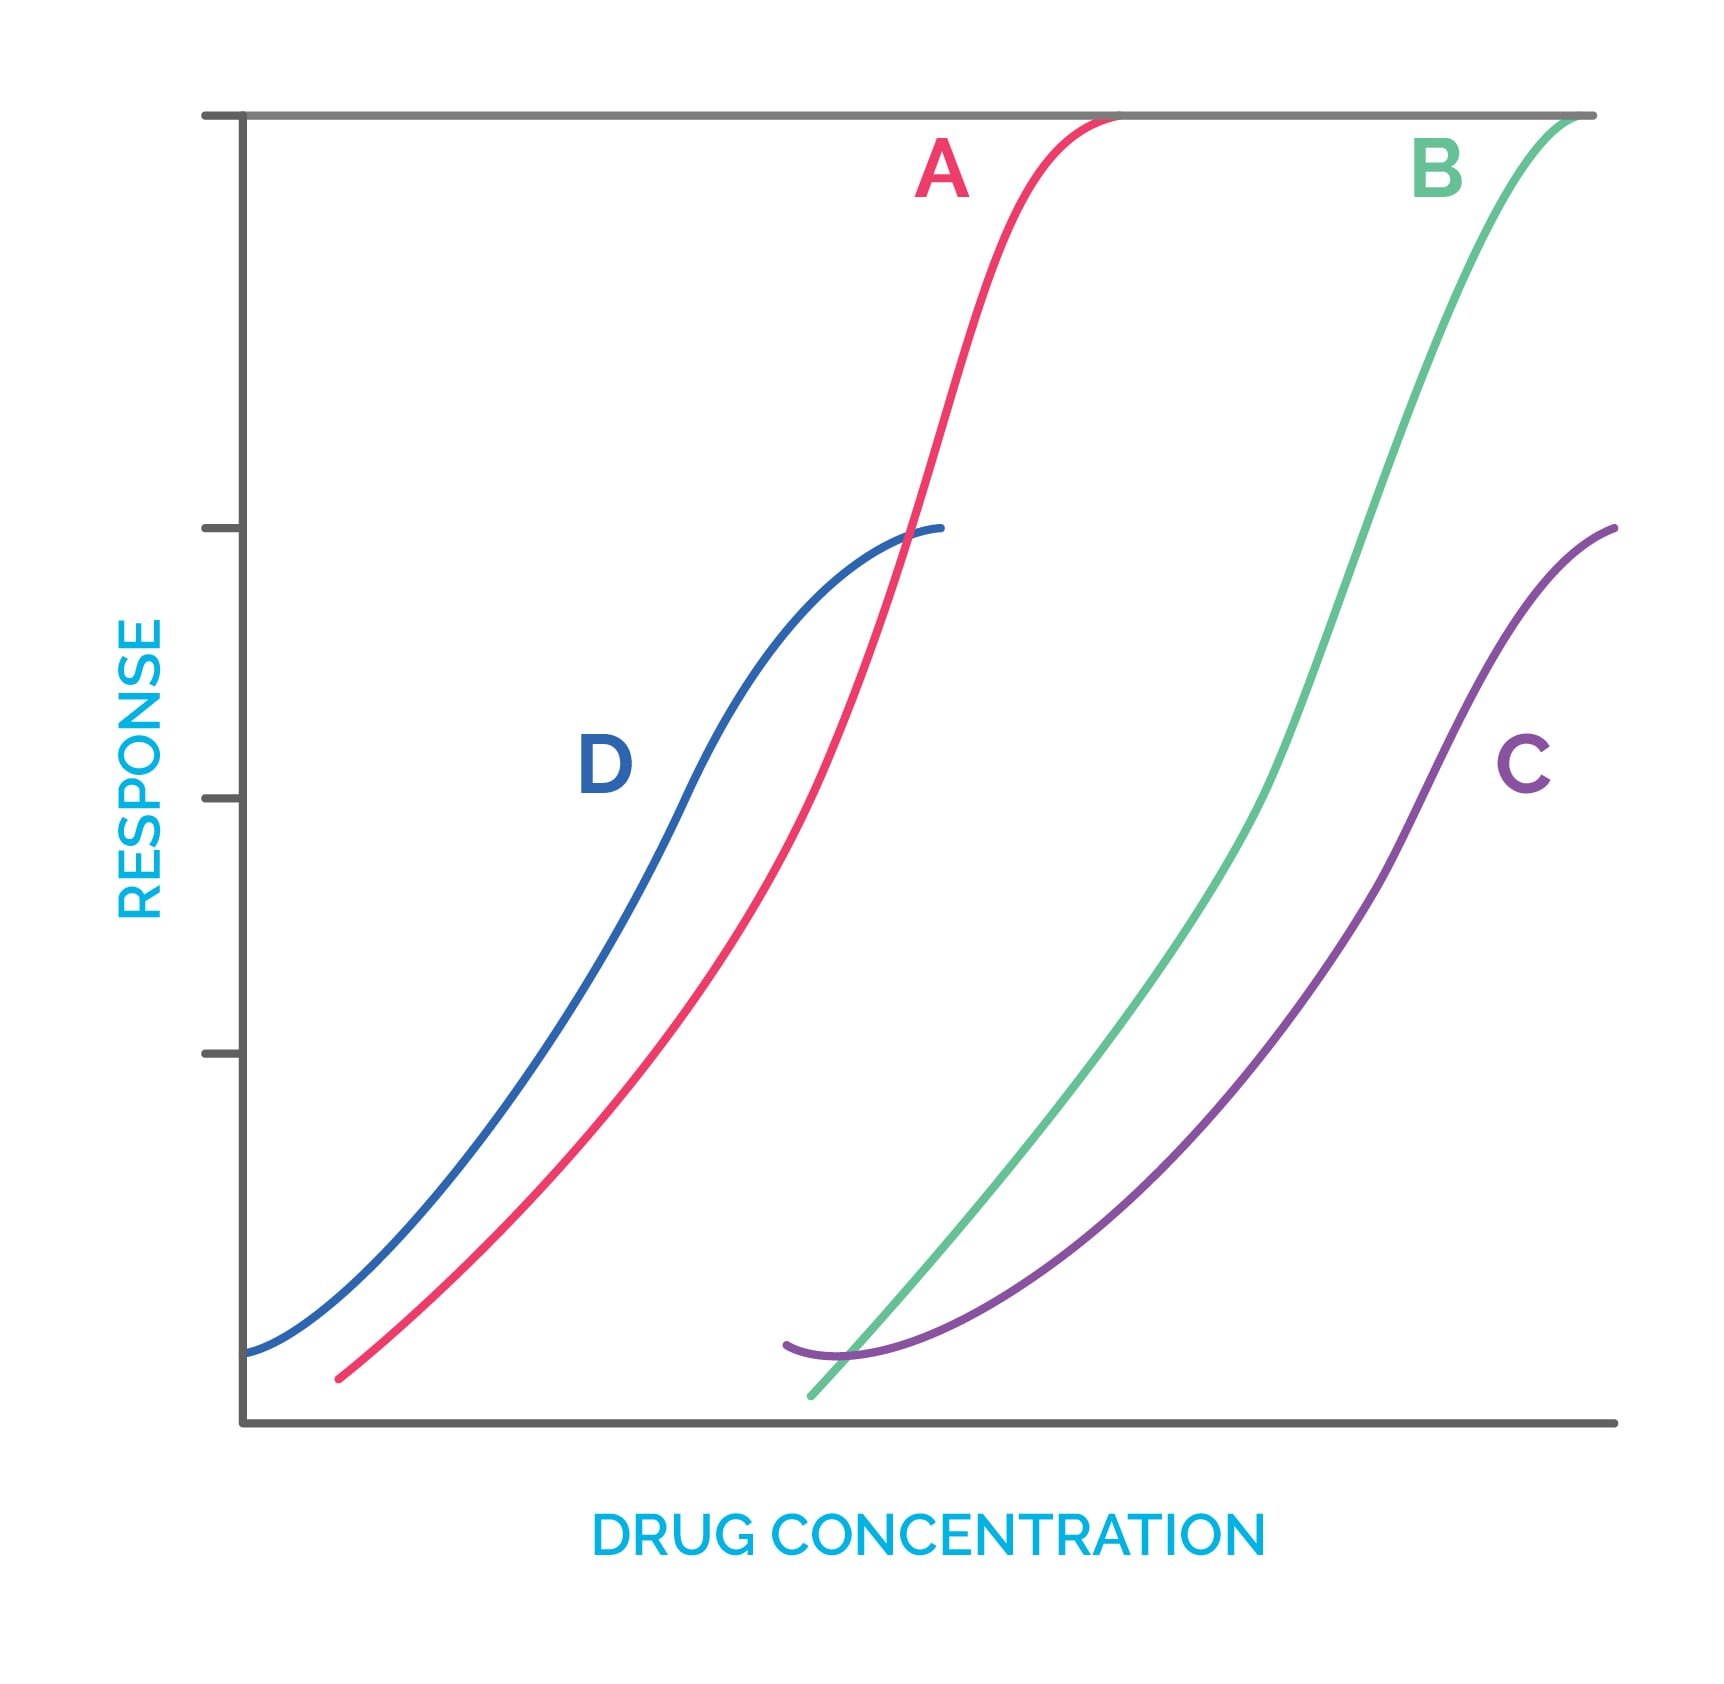
Dose response curves, efficacy and potency: A dose-response curve plots drug dose (or log dose) on the X axis and effect/response on the Y axis. Drug effect is related to the concentration of drug at its site of action. Typically, the dose-response curve is hyperbolic because the maximum effect is reached when all receptors are occupied. If you plot drug concentration on a logarithmic scale, the curve becomes sigmoid (S-shaped).
Potency is the amount of drug required to produce a desired effect. EC50 or ED50 can be used to evaluate or compare the potency of drug(s).
If two drugs have different potencies, then to get the same effect you must increase the dose of the less potent drug. A more potent drug can be said to have a higher affinity to the receptor, and vice versa.

Efficacy is the maximum effect produced by a drug. It can be evaluated by the height of the dose-response curve. Full agonists have more efficacy than partial agonists. Partial agonists bind to a receptor but produce less than maximal activation.
Drug-receptor interaction: Kd (equilibrium dissociation constant) is the concentration of ligand that occupies half of the maximum receptor population. It measures affinity. Emax is the maximum response, while B max is the total number of receptors. A full response can be elicited by an agonist drug even if only 10% of receptors are occupied. Antagonists can be either competitive (reversible) or non-competitive (irreversible).
Allosteric modulators: These drugs bind to a receptor at a site distinct from the active site and induce a conformational change that alters the receptor’s affinity for the endogenous ligand. Positive allosteric modulators increase affinity, while negative allosteric modulators decrease affinity. Examples include benzodiazepines and barbiturates acting on GABA A receptors.
Sign up for free to take 3 quiz questions on this topic