
Sensitivity, specificity and predictive values
Sensitivity, specificity and predictive values: These terms are used to evaluate screening and diagnostic tests.
-
Sensitivity is the true positive rate (TPR). It describes a test’s ability to correctly identify people who do have the condition.
-
Specificity is the true negative rate (TNR). It describes a test’s ability to correctly identify people who do not have the condition.
-
Positive predictive value (PPV) is the probability that a person who tests positive actually has the condition.
-
Negative predictive value (NPV) is the probability that a person who tests negative truly does not have the condition.
Predictive values depend on disease prevalence:
- If disease prevalence is high, PPV tends to be high (and vice versa).
- If disease prevalence is low, NPV tends to be high (and vice versa).
From the 2 X 2 table,
Sensitivity = [a/a+c] X 100 = TP / [TP + FN]
Specificity = [d/b+d] X 100 = TN/ [TN + FP]
Positive predictive value or PPV = [a/a+b] X 100
Negative predictive value or NPV = [d/c+d] X 100
Accuracy = [TP + TN] / [TP + TN + FP + FN]
False positive rate = 1 - specificity
TP = true positives; TN = true negatives; FP = false positives; FN = false negatives.
Sensitivity and PPV both use the same numerator (true positives), but they answer different questions:
- Sensitivity divides true positives by the total number of people with disease (TP + FN).
- PPV divides true positives by the total number of positive test results (TP + FP).
Similarly, specificity and NPV both use the same numerator (true negatives):
- Specificity divides true negatives by the total number of people without disease (TN + FP).
- NPV divides true negatives by the total number of negative test results (TN + FN).
Screening tests should have high sensitivity. Confirmatory tests should have high specificity. It is always best to have the highest sensitivity and specificity possible, but such choices may not be available. If the available treatment has serious adverse effects or is not cost effective, then use a test with high specificity. If the disease has a high fatality rate and effective treatment is available, use a test with high sensitivity.
Likelihood ratio or LR: This tells you how much a positive or negative test result changes the likelihood that a subject has the disease.
The LR of a positive test result (LR+) = sensitivity/(1 − specificity)
The LR of a negative test result (LR−) = (1 − sensitivity)/specificity.
For example, if the positive LR of a test for Pneumococcal pneumonia is +25, it means an individual is 25 times more likely to have a positive test result if they have Pneumococcal pneumonia than if they do not have the disease. If a test for (e.g.) shigellosis has a negative LR of -1, it means that when the test is negative, the likelihood of shigellosis given a negative test result is very low.
In general, for a diagnostic test:
- The higher the positive LR, the better.
- The lower the negative LR, the better.
Positive LR > 10 and negative LR < 0.1 indicate a useful test.
Pretest odds X LR = Post-test odds
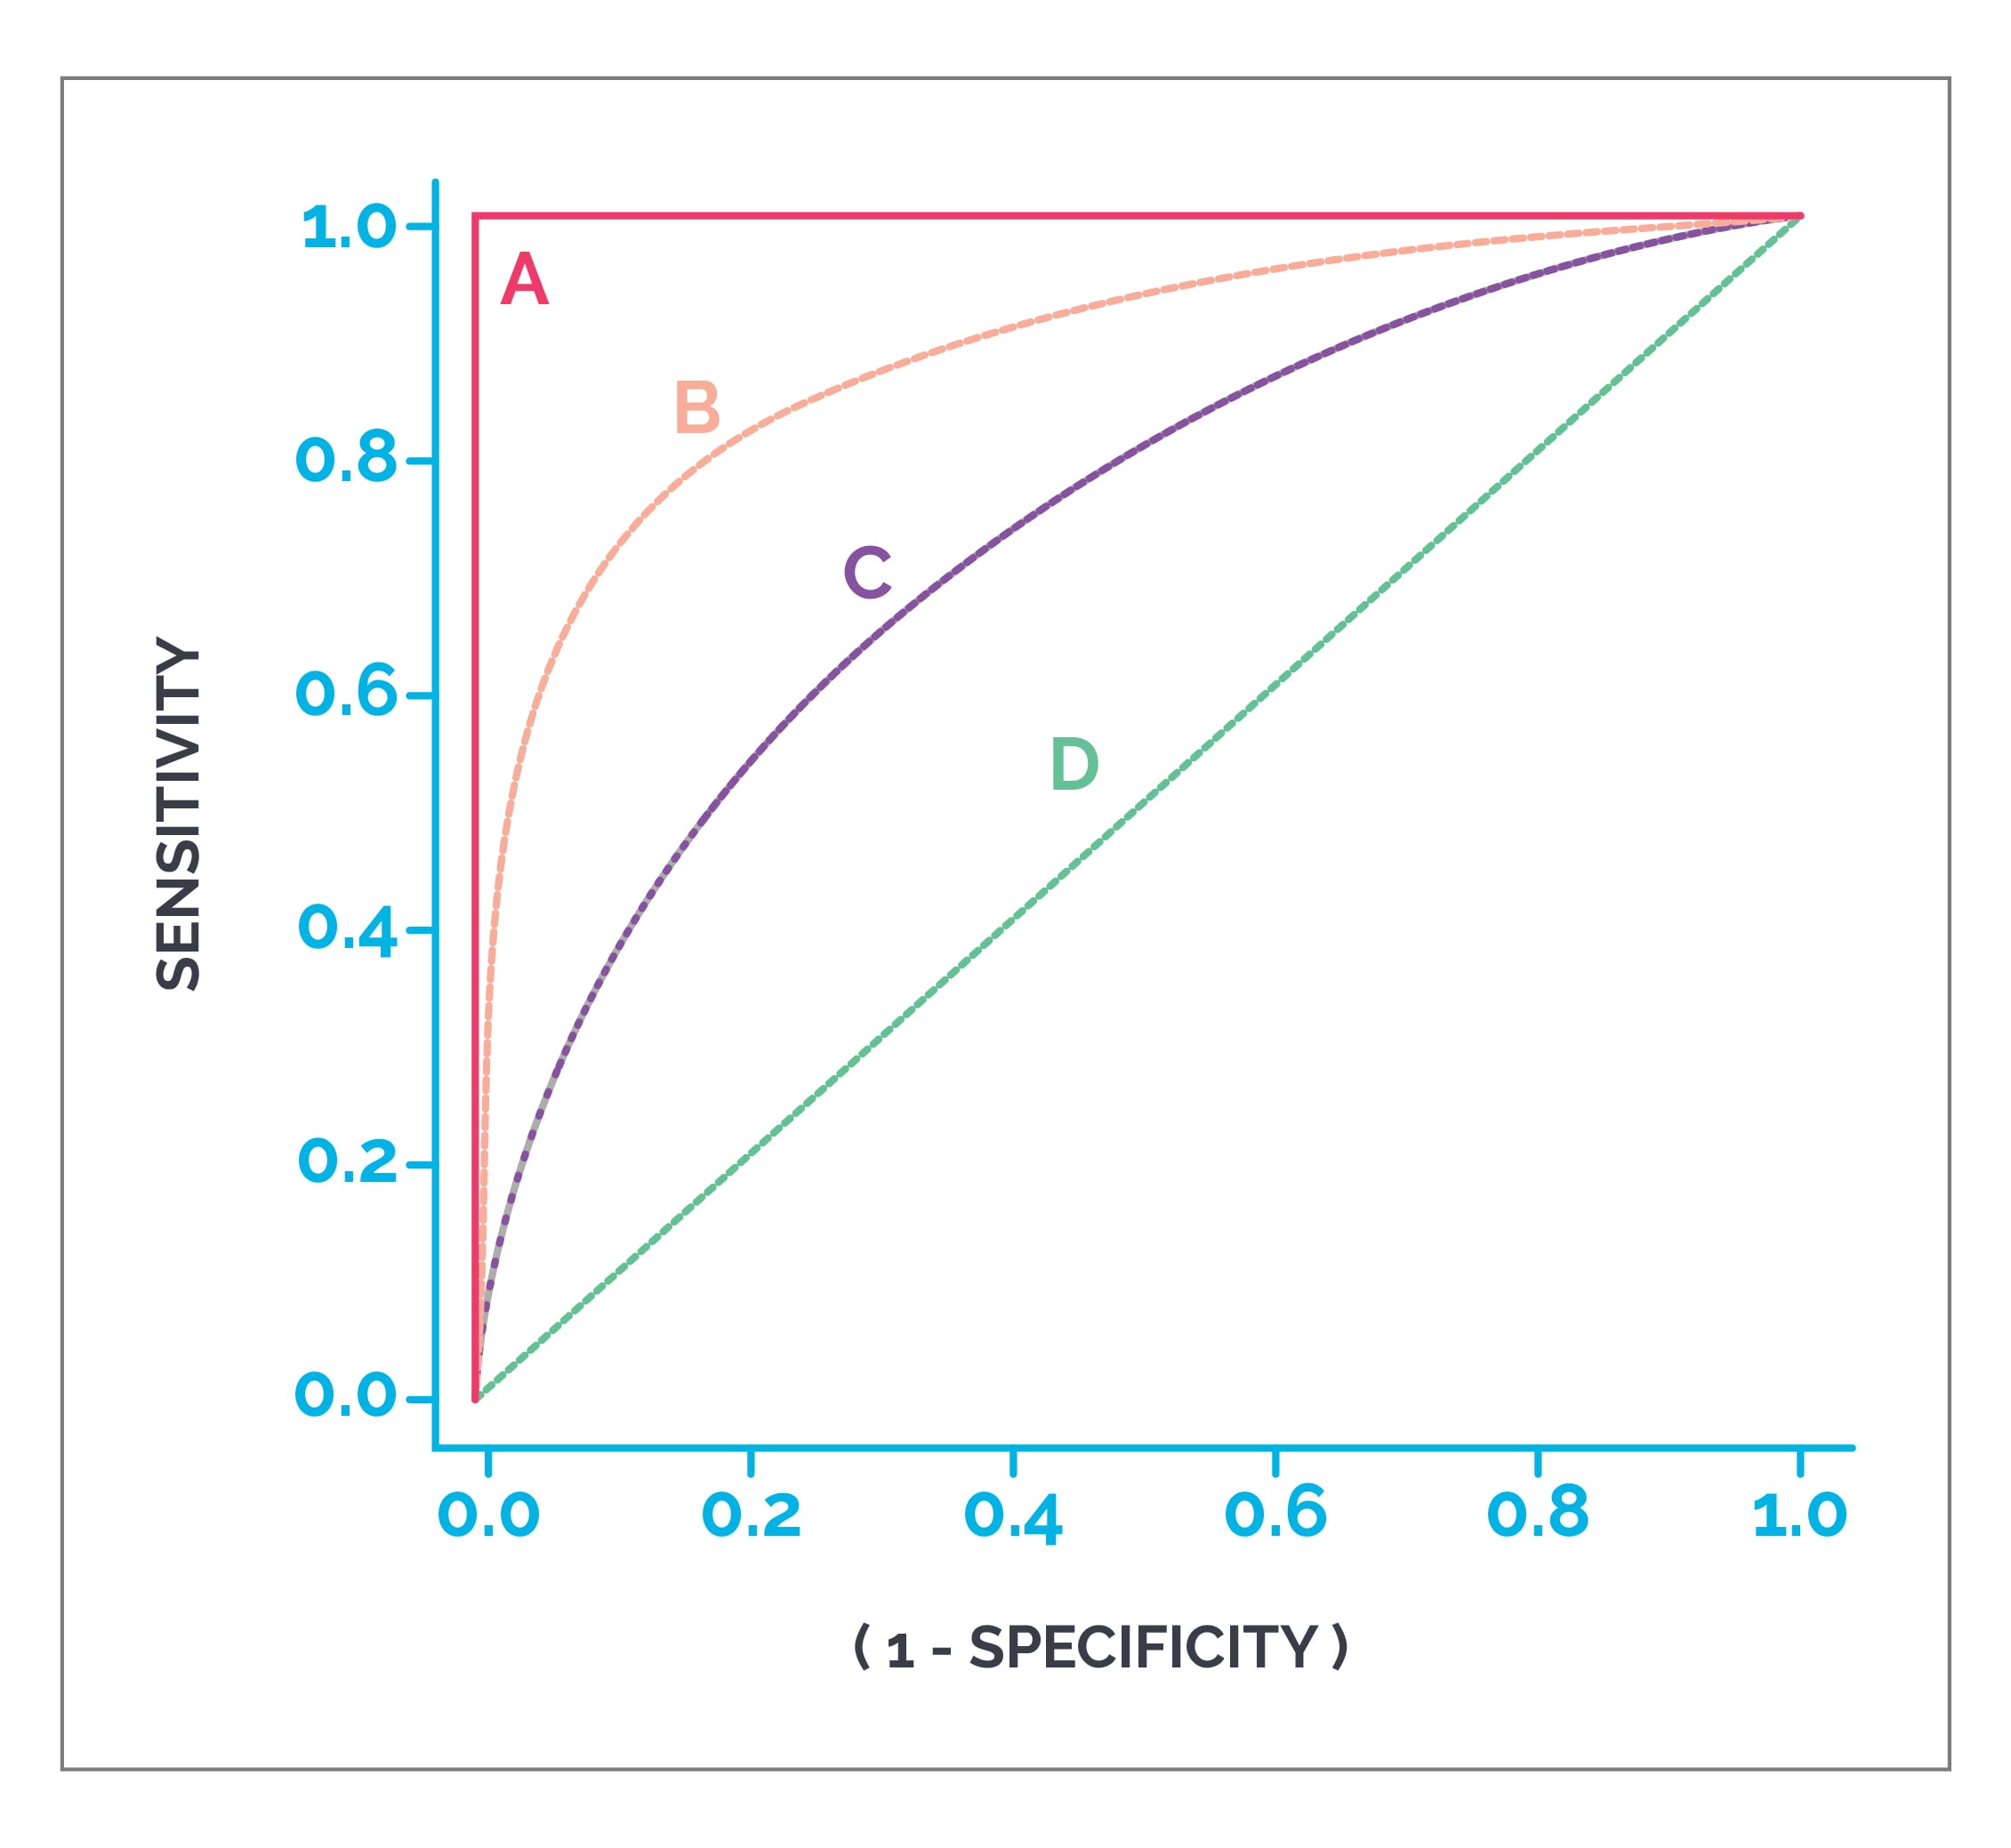
ROC curves or receiver operating curves: These are plotted with false positive rate (1 - specificity) on the X axis and sensitivity (true positive rate) on the Y axis. All possible combinations of TPR and FPR compose a ROC space. If the intersection of TPR and FPR falls in the area above a diagonal line that splits the ROC into two triangles, then that test is a good test. AUC or area under the ROC can be used to predict accuracy of a test. An AUC > 0.8 means it is a good test.
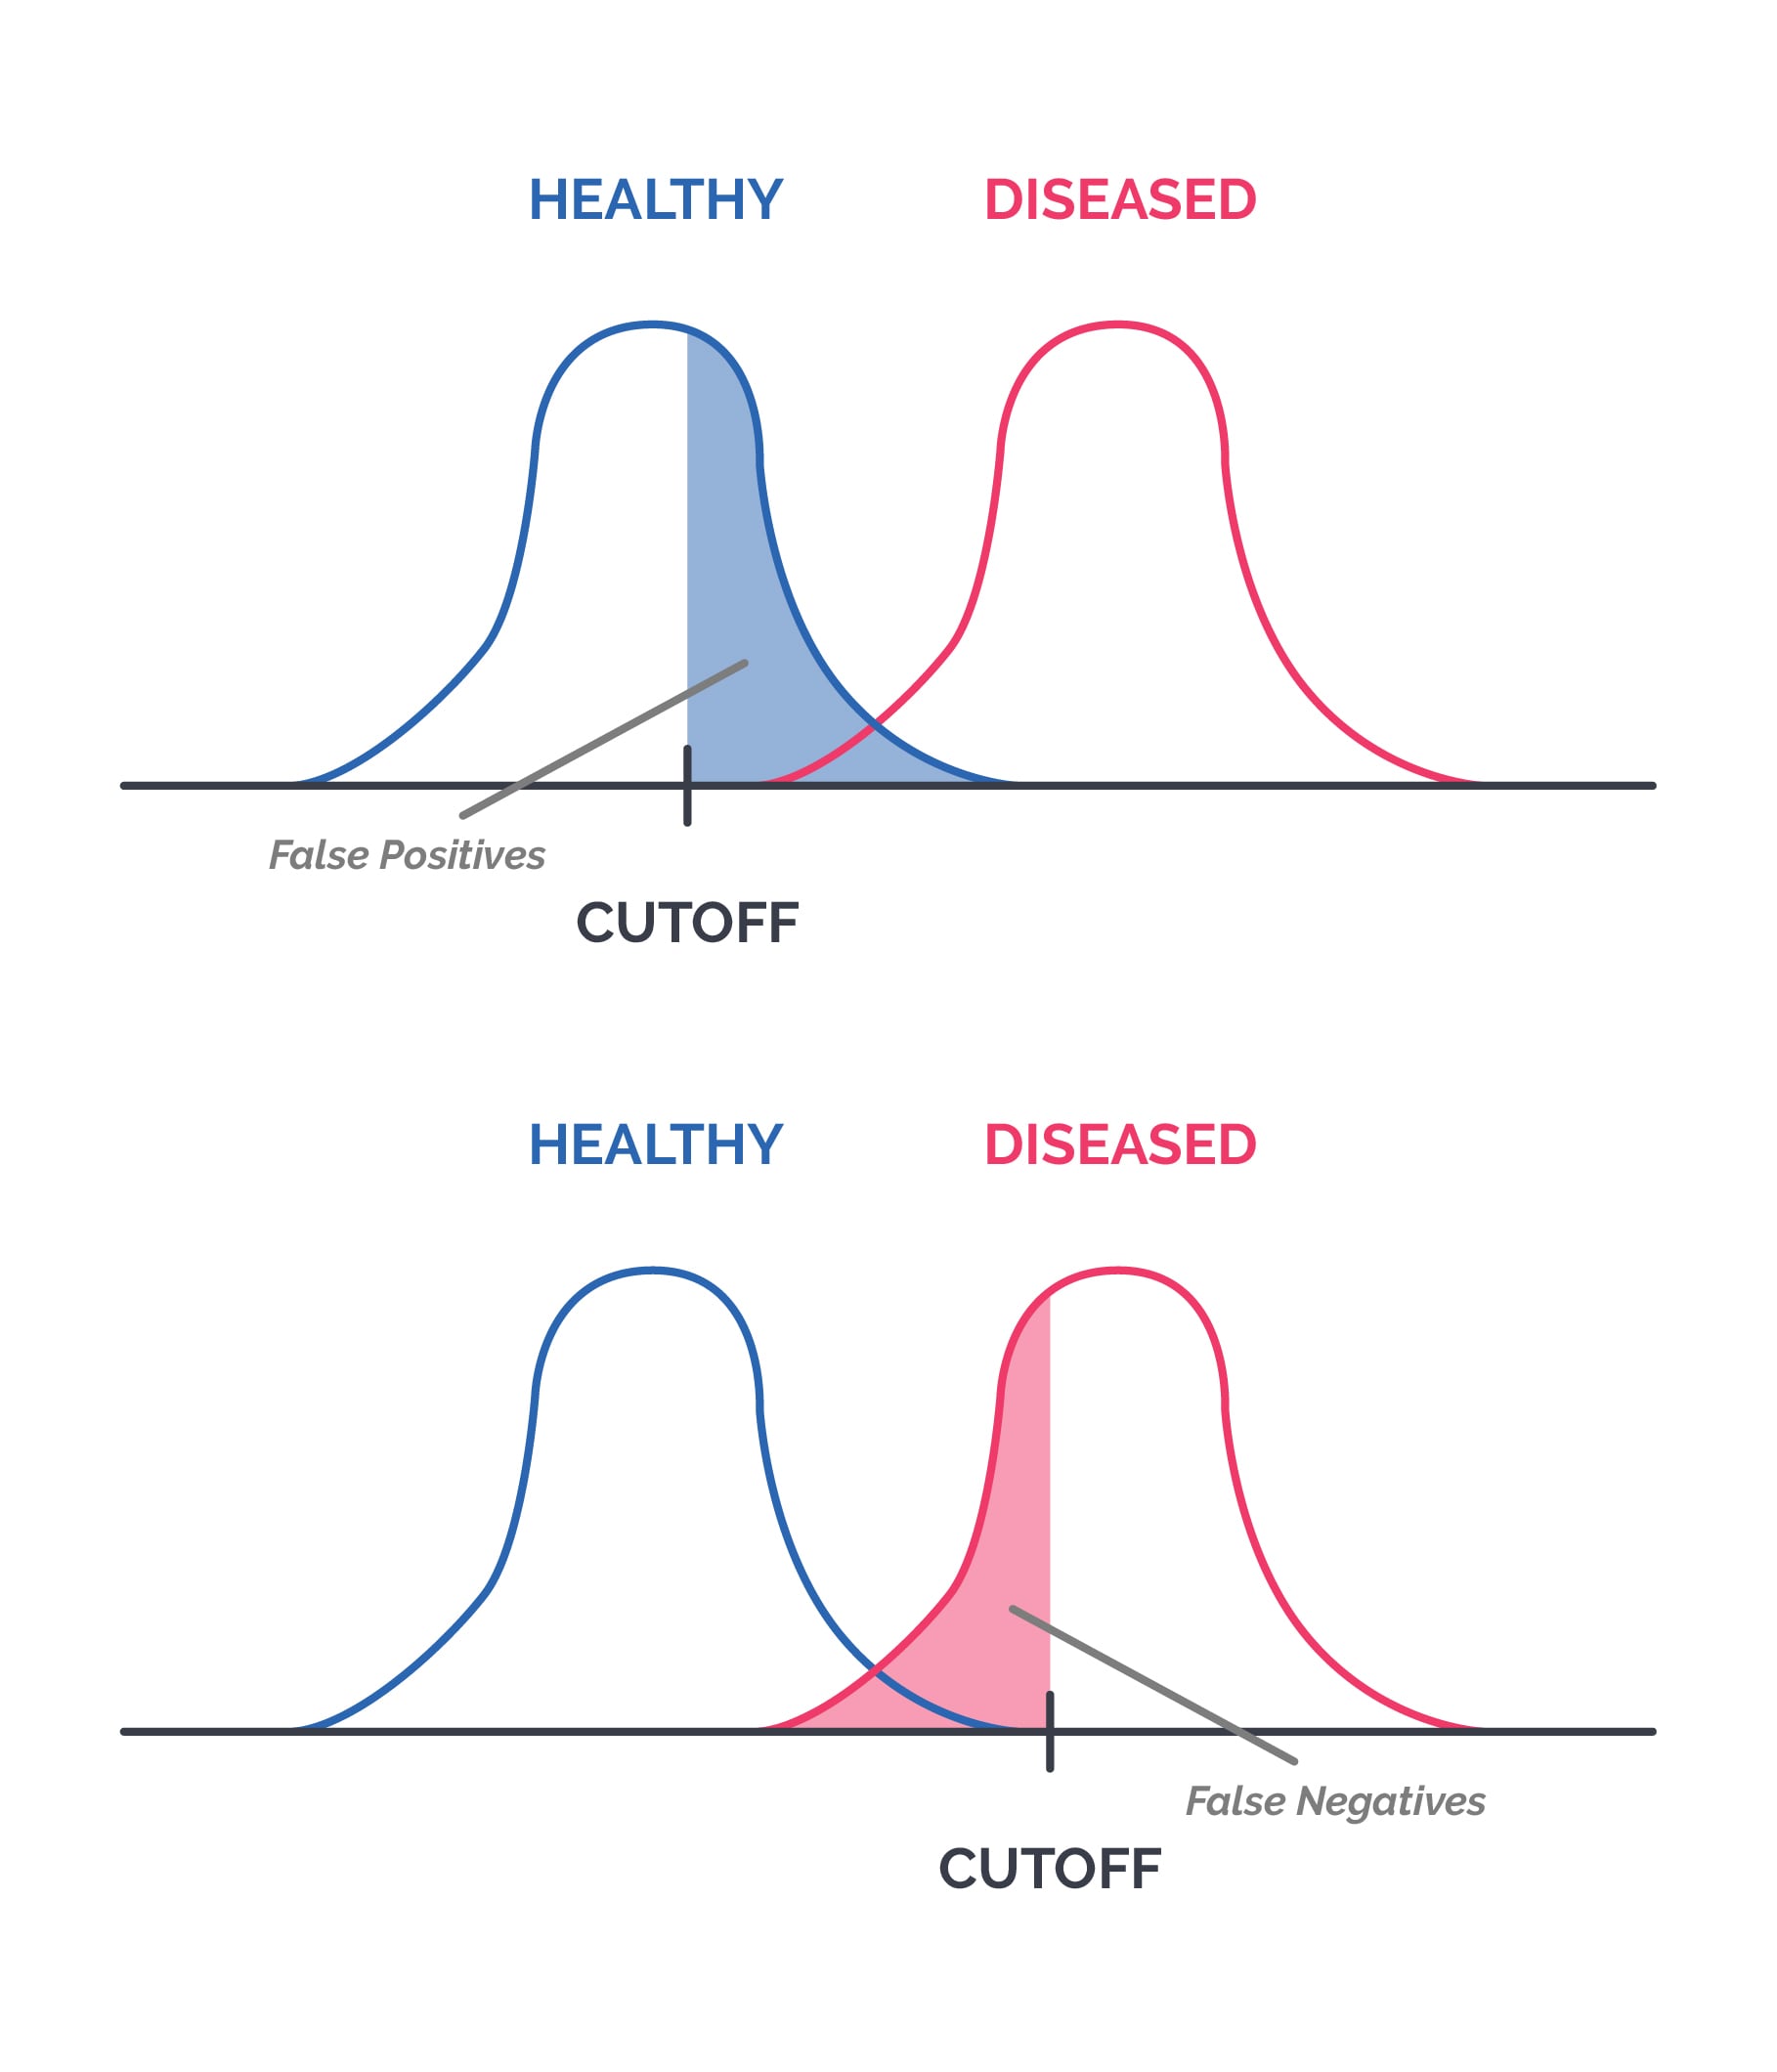
Choosing an appropriate cut-off value for a test: Many lab tests are reported on a numerical scale. Choosing a cut-off value affects both sensitivity and specificity. Because test values for diseased and disease-free individuals often overlap, any cut-off will usually create some false positives and false negatives.
For example:
-
If a lower value is selected as the cut-off, sensitivity increases, but false positives increase, so specificity decreases. For a disease with a high mortality rate, increasing sensitivity can be helpful.
-
If a higher value is selected as the cut-off, false negatives increase, so sensitivity decreases, but specificity increases. If standard treatment has a high risk of adverse effects, increasing specificity matters.
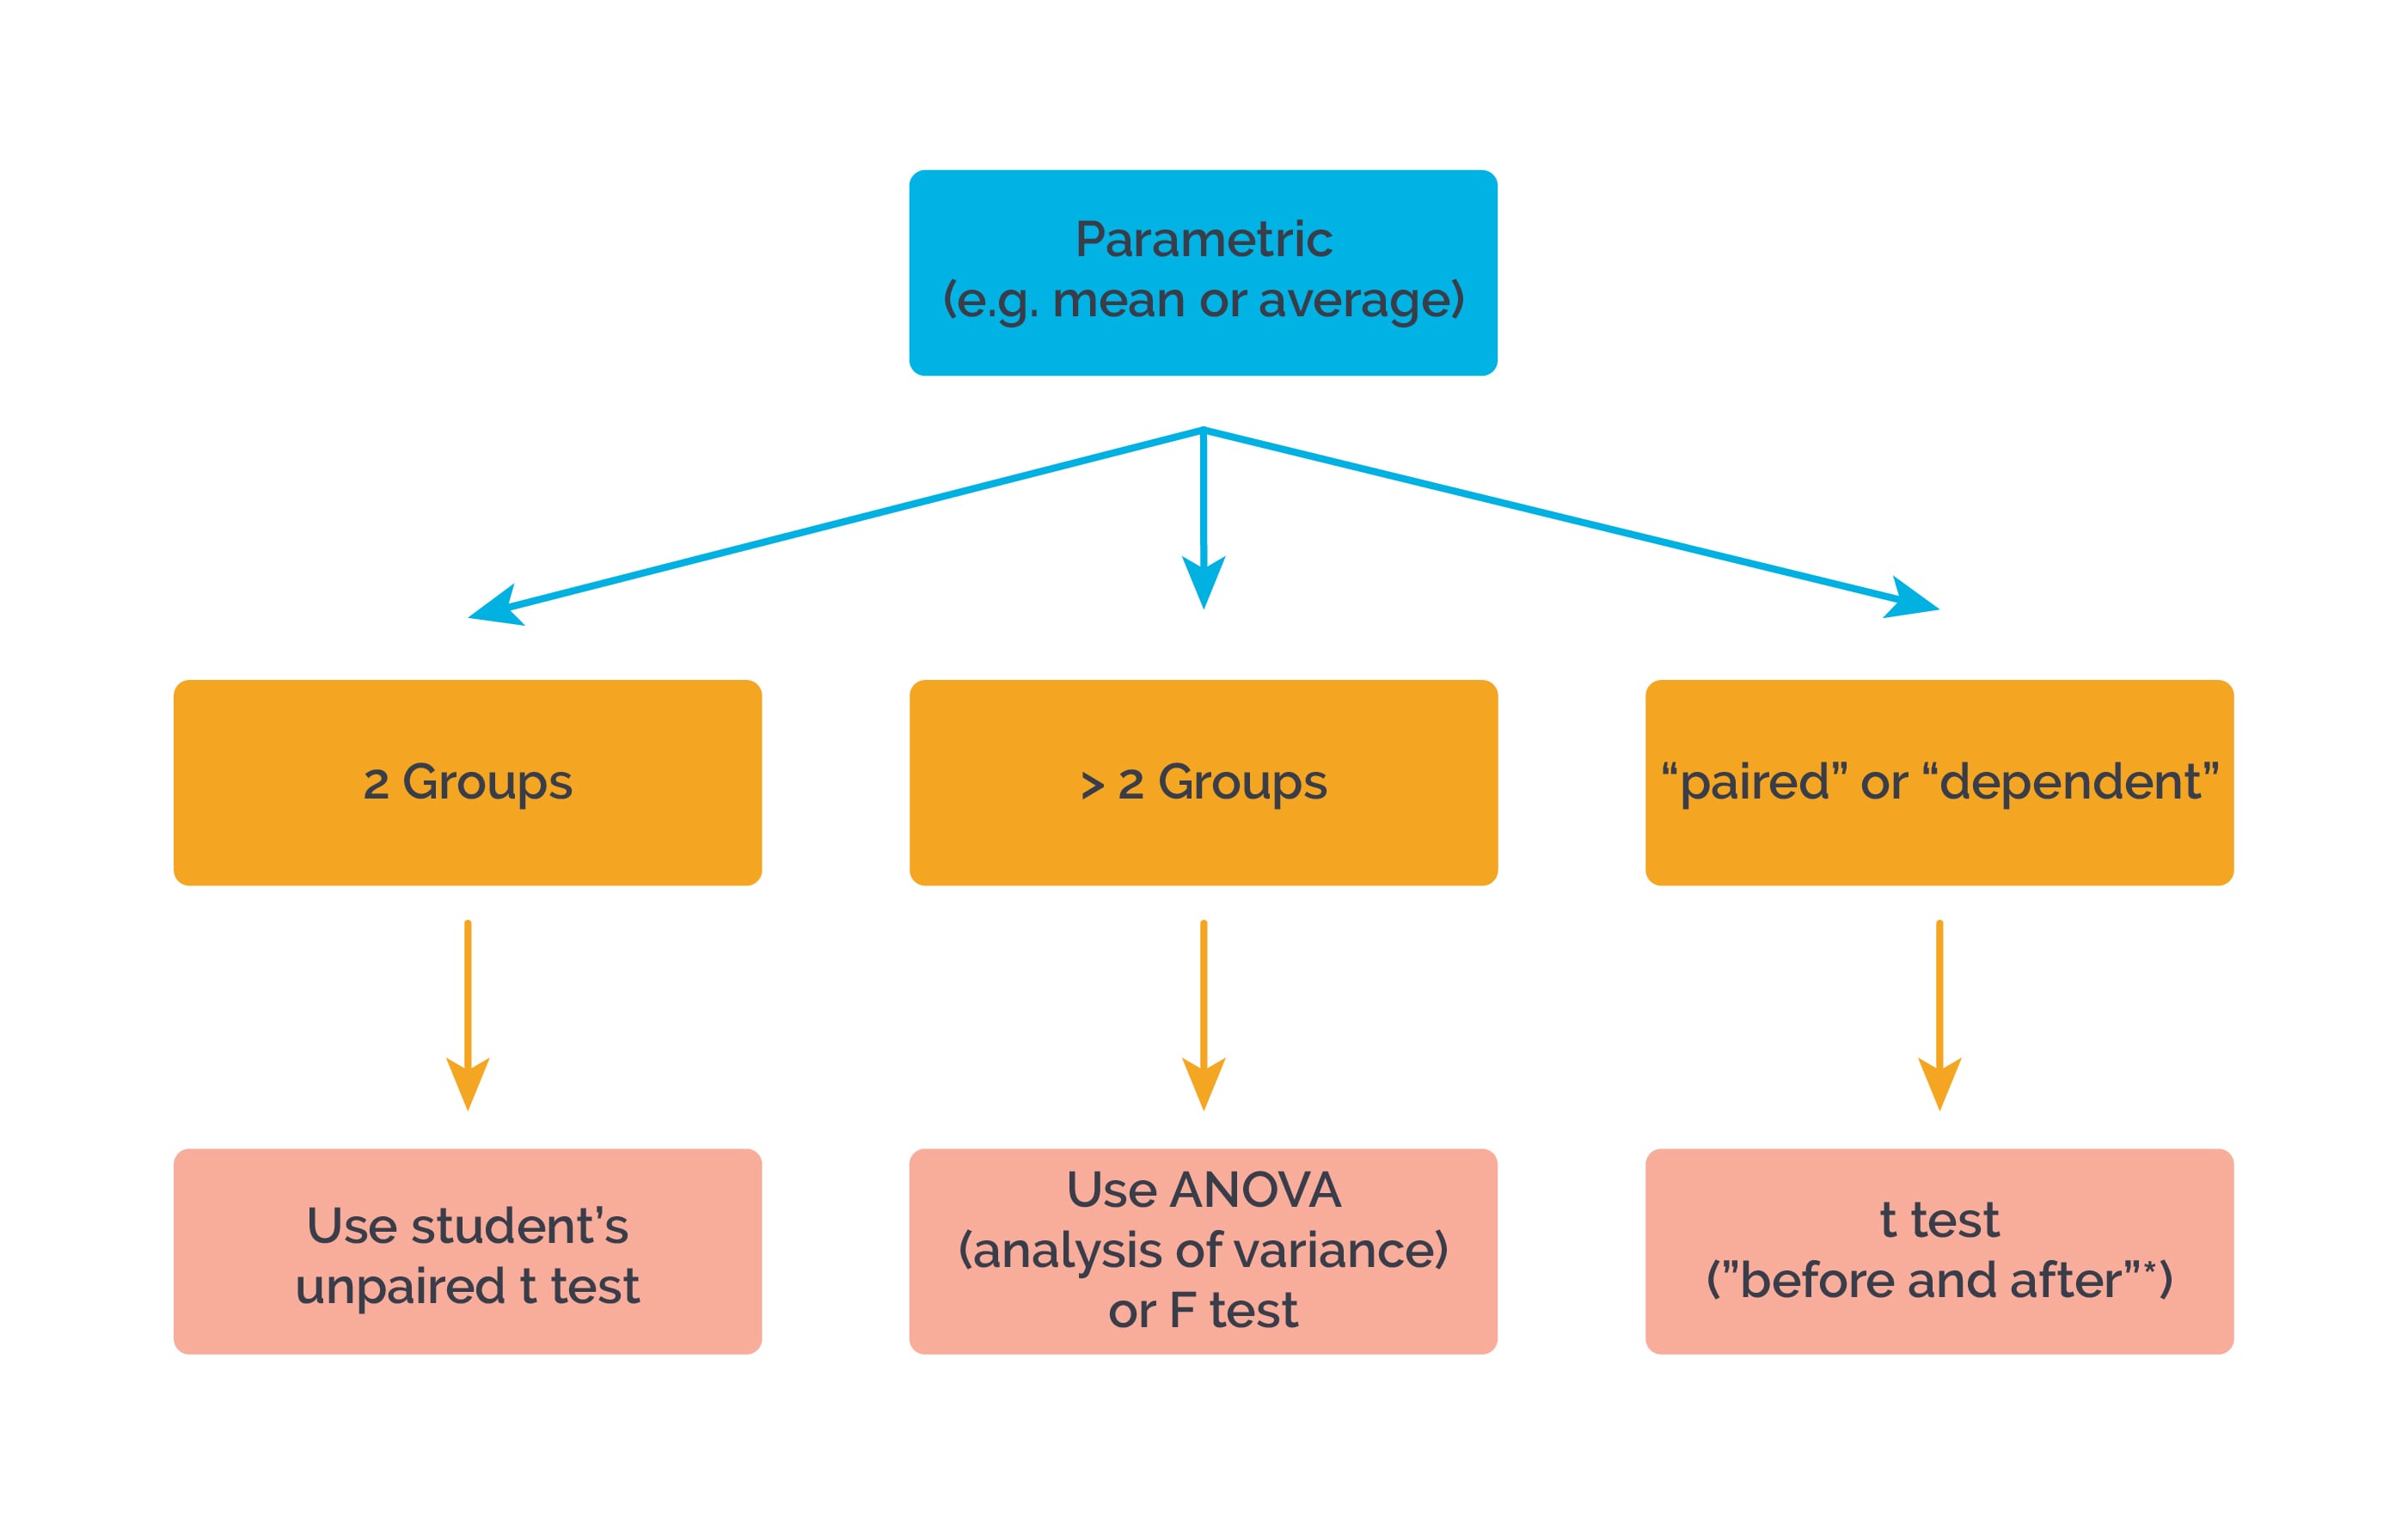
Tests to assess statistical significance: Which test to apply depends on the type of data.
For “before and after”* measurements in the same group or individual, use a “paired” or “dependent” t test. For example:
- What happens to an individual’s blood pressure before and after administration of drug A?
- What happens to blood glucose levels in group A before and after administration of drug B?