Measures of disease frequency:
Incidence: The number of new cases that occur during a specified time interval, divided by the population at risk during that same interval. Cohort studies are used to calculate incidence.
Prevalence: The total number of people with a disease at a specific point in time (point prevalence) or over a specified period (period prevalence), divided by the population at risk.
Prevalence depends on disease duration:
If the average duration of a disease increases, prevalence increases. For example, a new treatment that prevents death but doesn’t cure the disease increases the number of people living with the disease, which increases prevalence.
Point prevalence is commonly measured using cross-sectional studies.
Prevalence can also be given as Incidence rate X duration of disease
Problem 1: Calculate the incidence and prevalence of hypertension in female residents of town A. It has a total population of 24,000 with 10,000 female residents of which 1000 have hypertension. 100 new cases of hypertension in females have been diagnosed in the year 2019.
Prevalence = total number of individuals with a disease/ population at risk = 1000/10,000 = 1/10 or 10%
Note that although the total population of the town is 24,000, we are not using it in the denominator because the question asks for prevalence in the female population.
Incidence = number of new cases/population at risk = 100/9000 = 1/90 = 1.11% approx.
Note that hypertension is a chronic disease, so you subtract the number of individuals already diagnosed with hypertension to get the population at risk:
10,000 - 1000 = 9000.
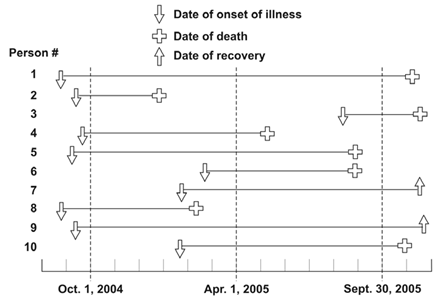
Problem 2: The figure represents 10 new cases of illness over about 15 months in a population of 20 persons. Each horizontal line represents one person. The down arrow indicates the date of onset of illness. The solid line represents the duration of illness. The up arrow and the cross represent the date of recovery and date of death, respectively.

"New Cases of Illness from October 1, 2004-September 30, 2005
Before October 1, six people became ill; 2 of them died before April 1. Between October 1 and September 30, four more persons became ill. Six more persons died after April 1. "
Using the figure, solve the problems below:
i) Calculate the incidence rate from October 1, 2004, to September 30, 2005, using the midpoint population (population alive on April 1, 2005) as the denominator. Express the rate per 100 population.
Steps: Incidence rate numerator = number of new cases between October 1 and September 30 = 4 (the other 6 had onsets before October 1, so they are not included)
Incidence rate denominator = April 1 population = 18 (persons 2 and 8 died before April 1)
Incidence rate = (4 ⁄ 18) × 100 = 22 new cases per 100 population
ii) Calculate the point prevalence on April 1, 2005. Point prevalence is the number of persons ill on the date divided by the population on that date. On April 1, seven persons (persons 1, 4, 5, 7, 9, and 10) were ill.
Point prevalence = (7 ⁄ 18) × 100 = 38.89%
iii) Calculate the period prevalence from October 1, 2004, to September 30, 2005. The numerator of period prevalence includes anyone who was ill any time during the period. In the figure, the first 10 persons were all ill at some time during the period.
Period prevalence = (10 ⁄ 20) × 100 = 50.0%
Sign up for free to take 1 quiz question on this topic