Enzymes and substrates
Enzymes are protein catalysts that increase the rate of reactions. They provide an energetically favorable pathway by lowering the free energy of activation, so reactions can proceed more easily. RNAs with catalytic activity are called ribozymes.
The active site of an enzyme is the substrate-binding site. kcat is the number of substrate molecules converted to product per enzyme molecule per second.
Holoenzyme: active enzyme with its nonprotein component
Apoenzyme: inactive enzyme without its non-protein component
Cofactors: metal ions (e.g., iron, copper) that form the non-protein component of an enzyme
Coenzyme: small organic molecule that forms the non-protein component of an enzyme
Cosubstrate: a coenzyme that is temporarily associated with a substrate (e.g., NAD)
Prosthetic group: a coenzyme that is permanently associated with the enzyme (e.g., FAD)
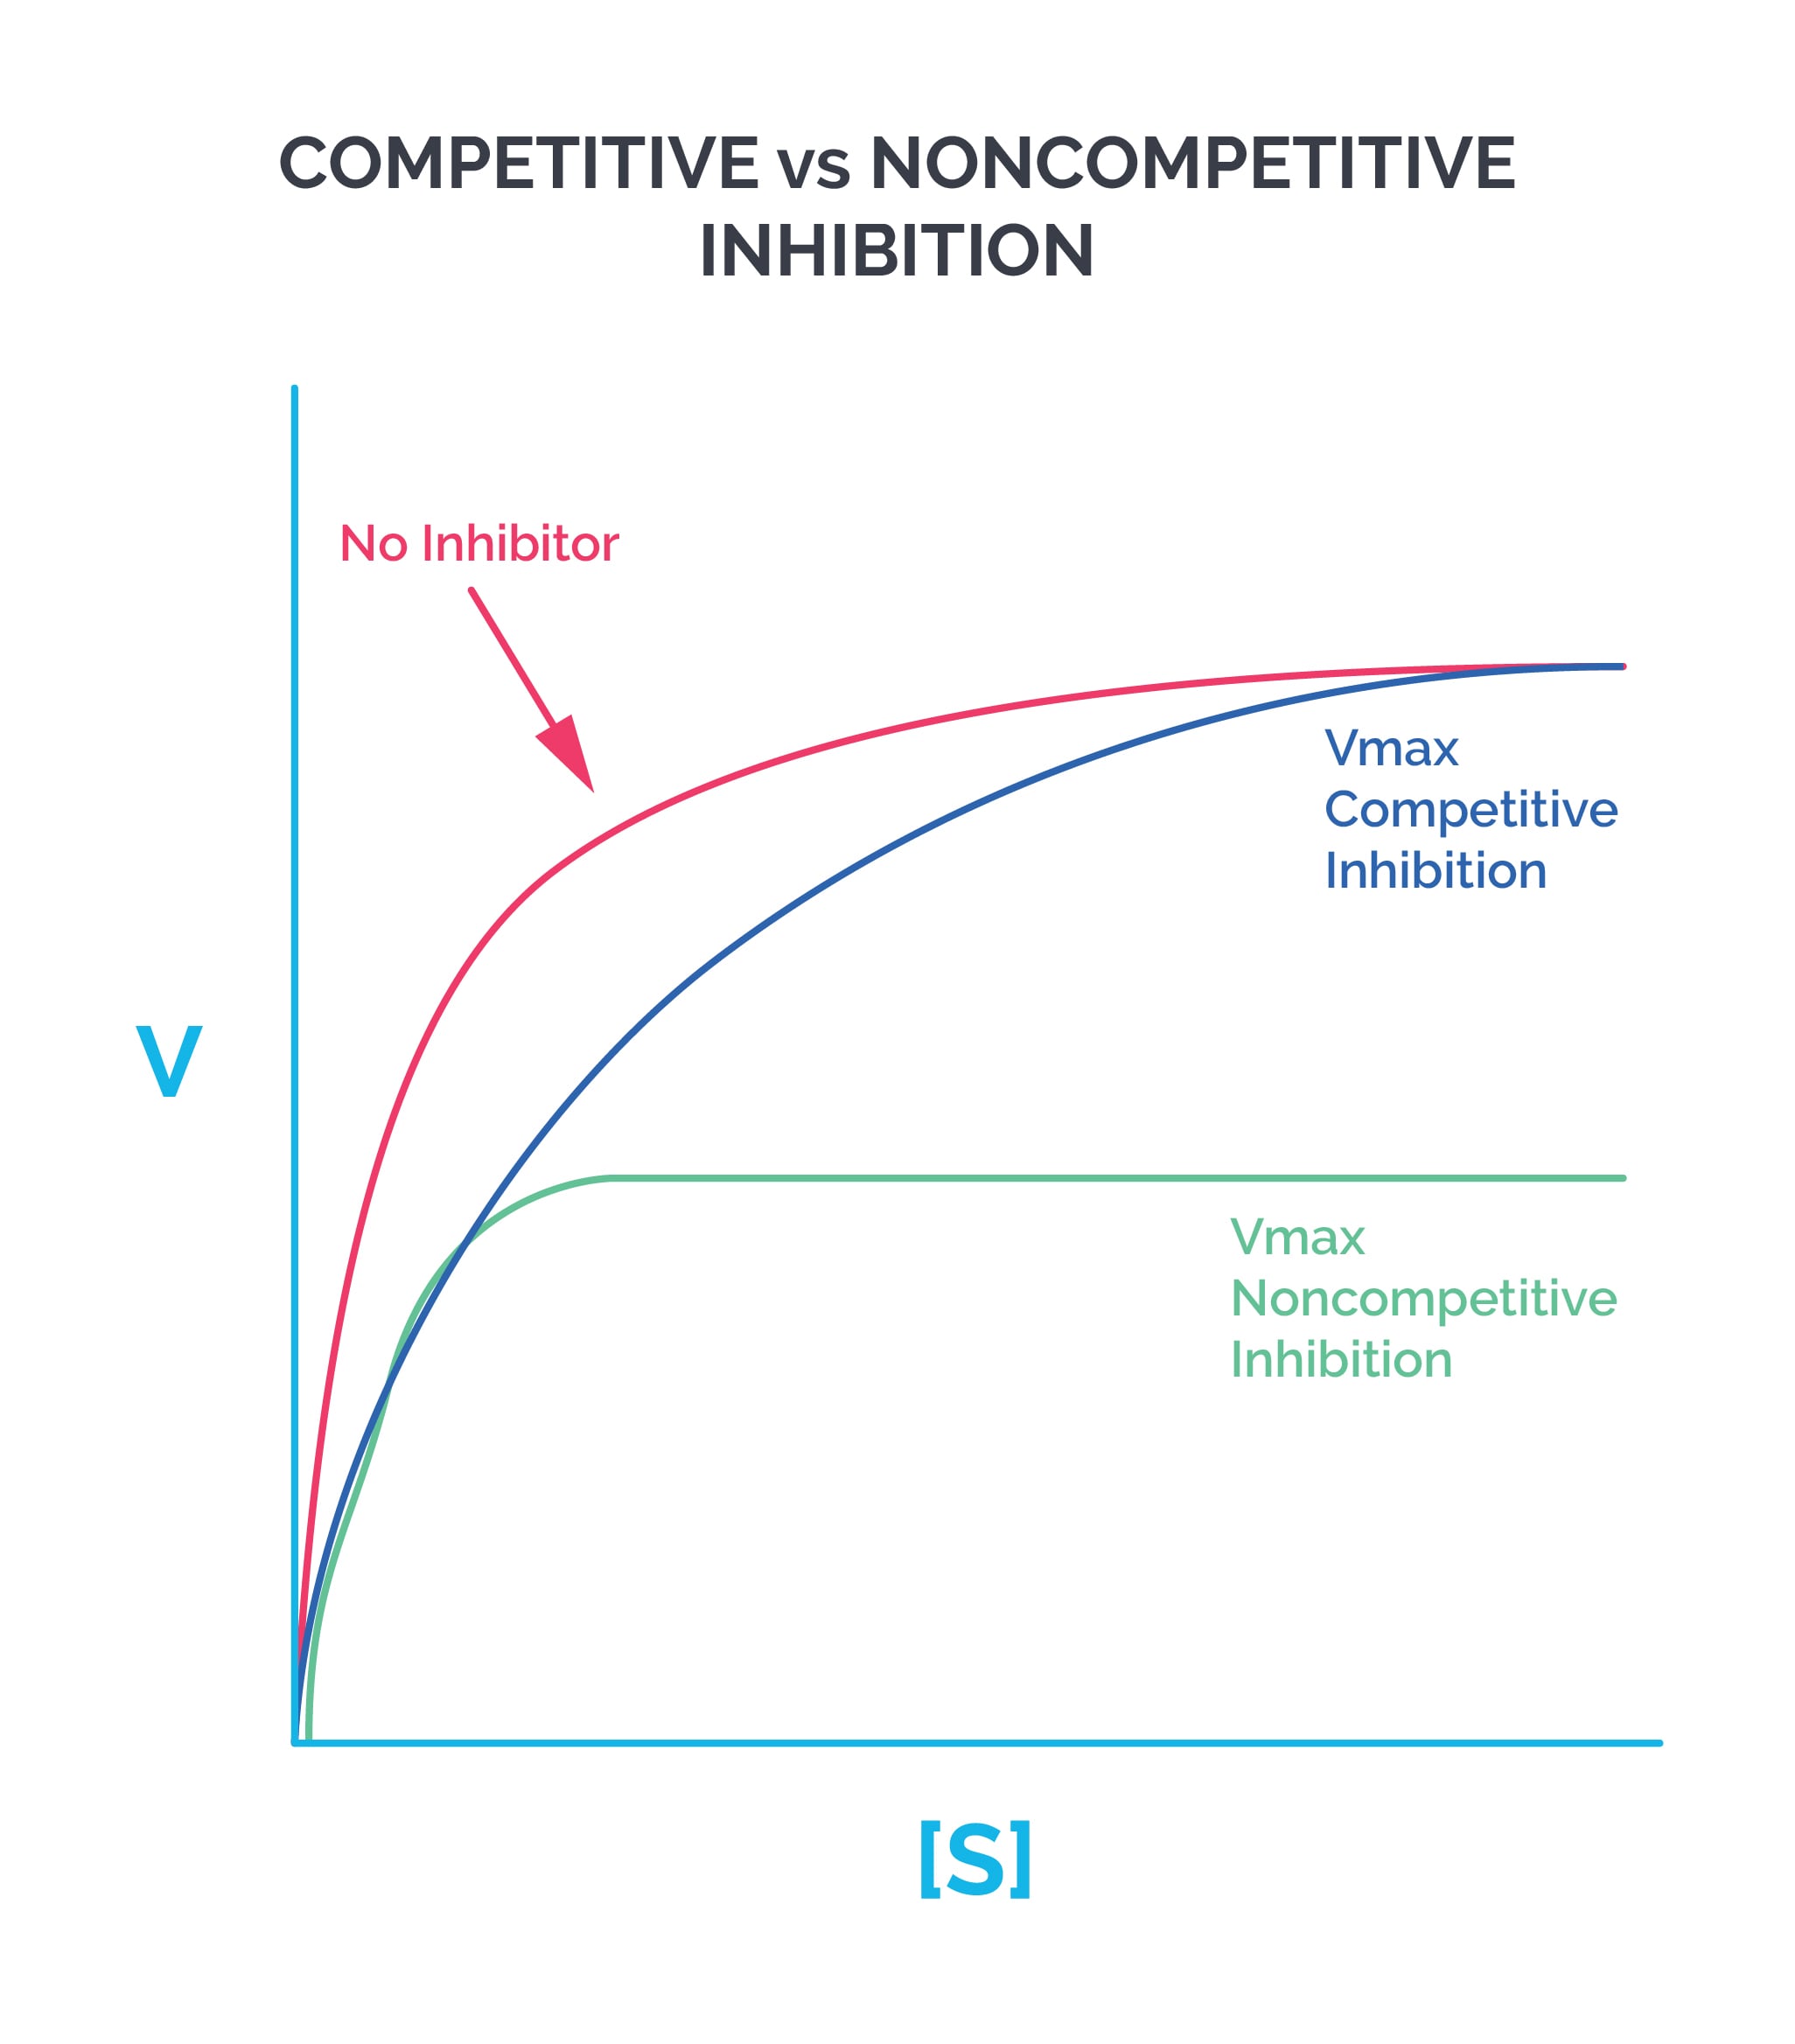
Effect of substrate concentration on enzymes: Enzymes that follow Michaelis-Menten kinetics produce a hyperbolic curve when substrate concentration (S) is plotted on the X axis and reaction velocity (V) is plotted on the Y axis. Allosteric enzymes produce a sigmoidal curve when plotted the same way.
The leveling off of the hyperbolic curve at high substrate concentrations happens because all available active (substrate-binding) sites become saturated. Reaction velocity is directly proportional to enzyme concentration.
Km is the Michaelis-Menten constant. It equals the substrate concentration at which the reaction velocity is half of Vmax.
Small Km = high affinity Large Km = low affinity
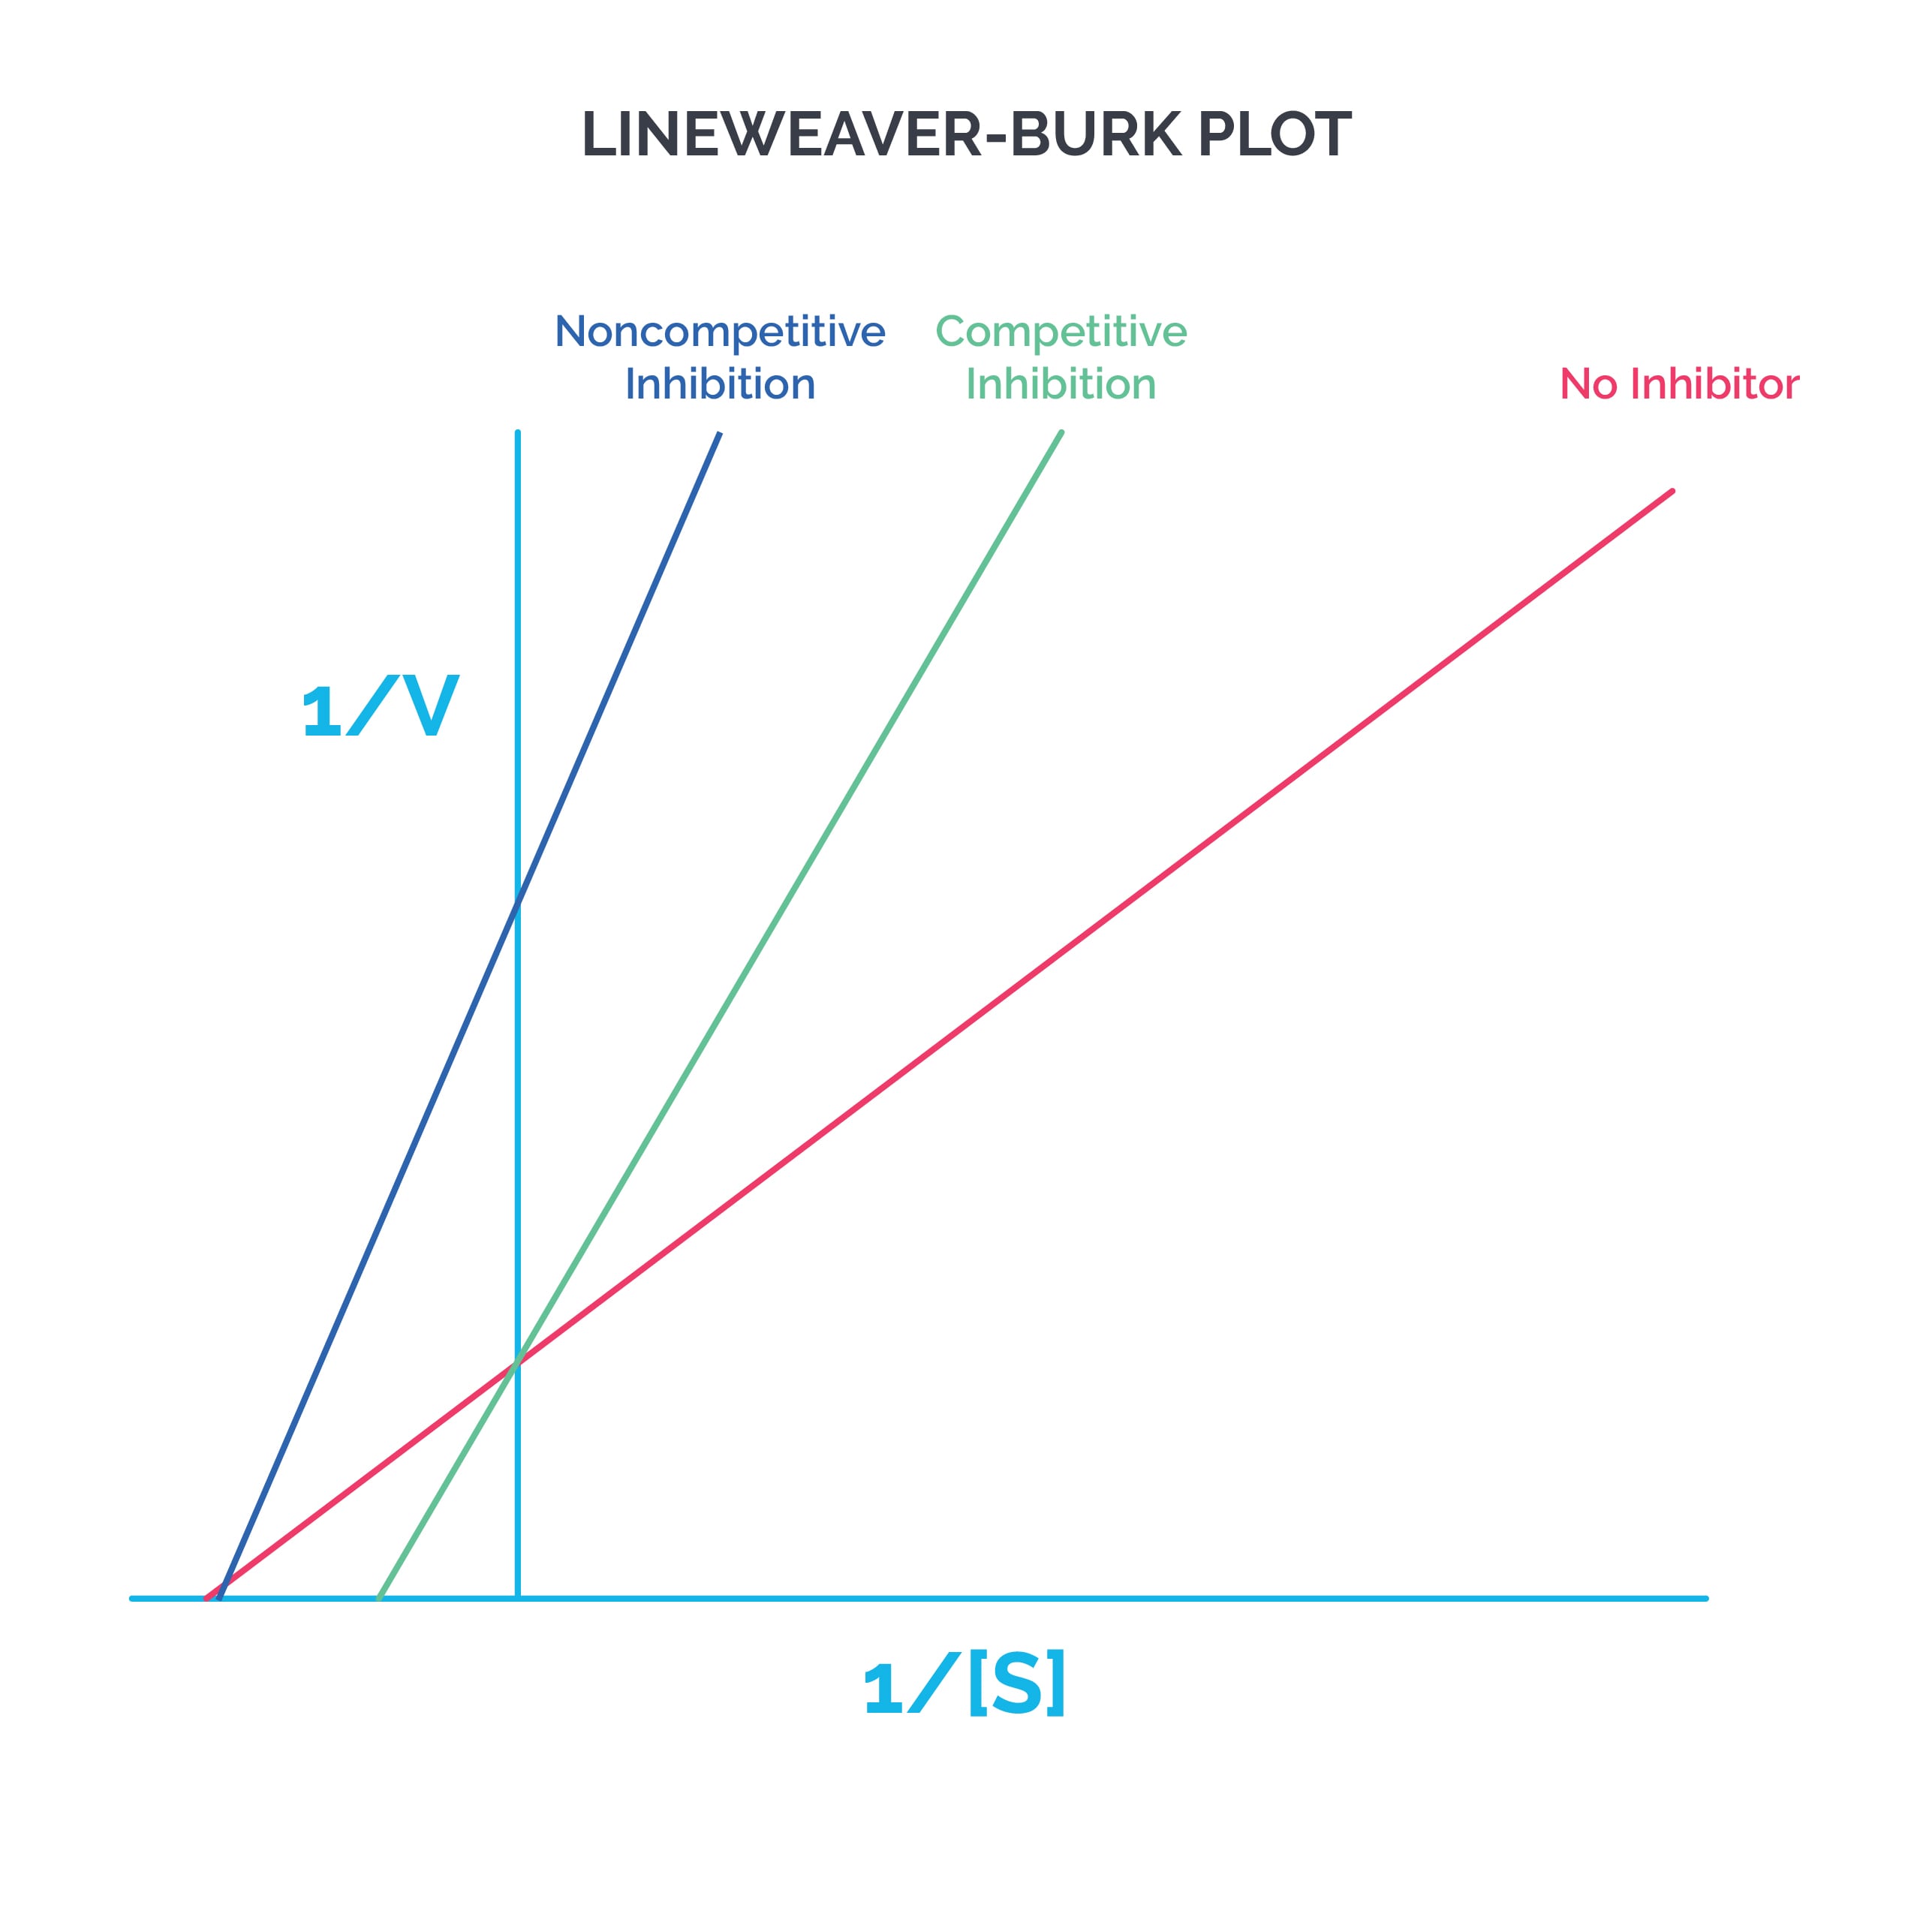
The Lineweaver-Burk graph is plotted with 1/S on the X axis and 1/V on the Y axis.
Enzyme inhibition:
i) Irreversible inhibitors bind to enzymes through covalent bonds.
ii) Reversible inhibitors bind to enzymes through non-covalent bonds.
There are two types of reversible inhibition: competitive and noncompetitive.
Competitive inhibition: The inhibitor binds to the same site as the substrate. Vmax stays the same, while Km increases (affinity decreases). The X intercept gets smaller, while the Y intercept stays the same. Example: statins inhibit HMG-CoA reductase.
Noncompetitive inhibition: The inhibitor binds to a different site than the substrate. Vmax decreases, but Km remains the same. The Y intercept gets larger, while the X intercept remains the same. Example: ferrochelatase is inhibited by lead, which forms bonds with cysteine in the enzyme.
Tip: If the lines cross, it is competitive inhibition. If the lines do not cross, it is noncompetitive inhibition. Note that the graphs of irreversible competitive inhibition and noncompetitive inhibition will be the same.
Regulation of enzyme activity:
i) Allosteric enzymes: Effectors (modifiers) bind noncovalently at a site other than the active site, called an allosteric site. Effectors can be positive or negative.
Homotropic effectors: The substrate itself serves as an effector. Usually, it acts as a positive effector: binding at one site increases catalytic activity at other substrate-binding sites (cooperative kinetics). These enzymes show a sigmoidal V versus S curve.
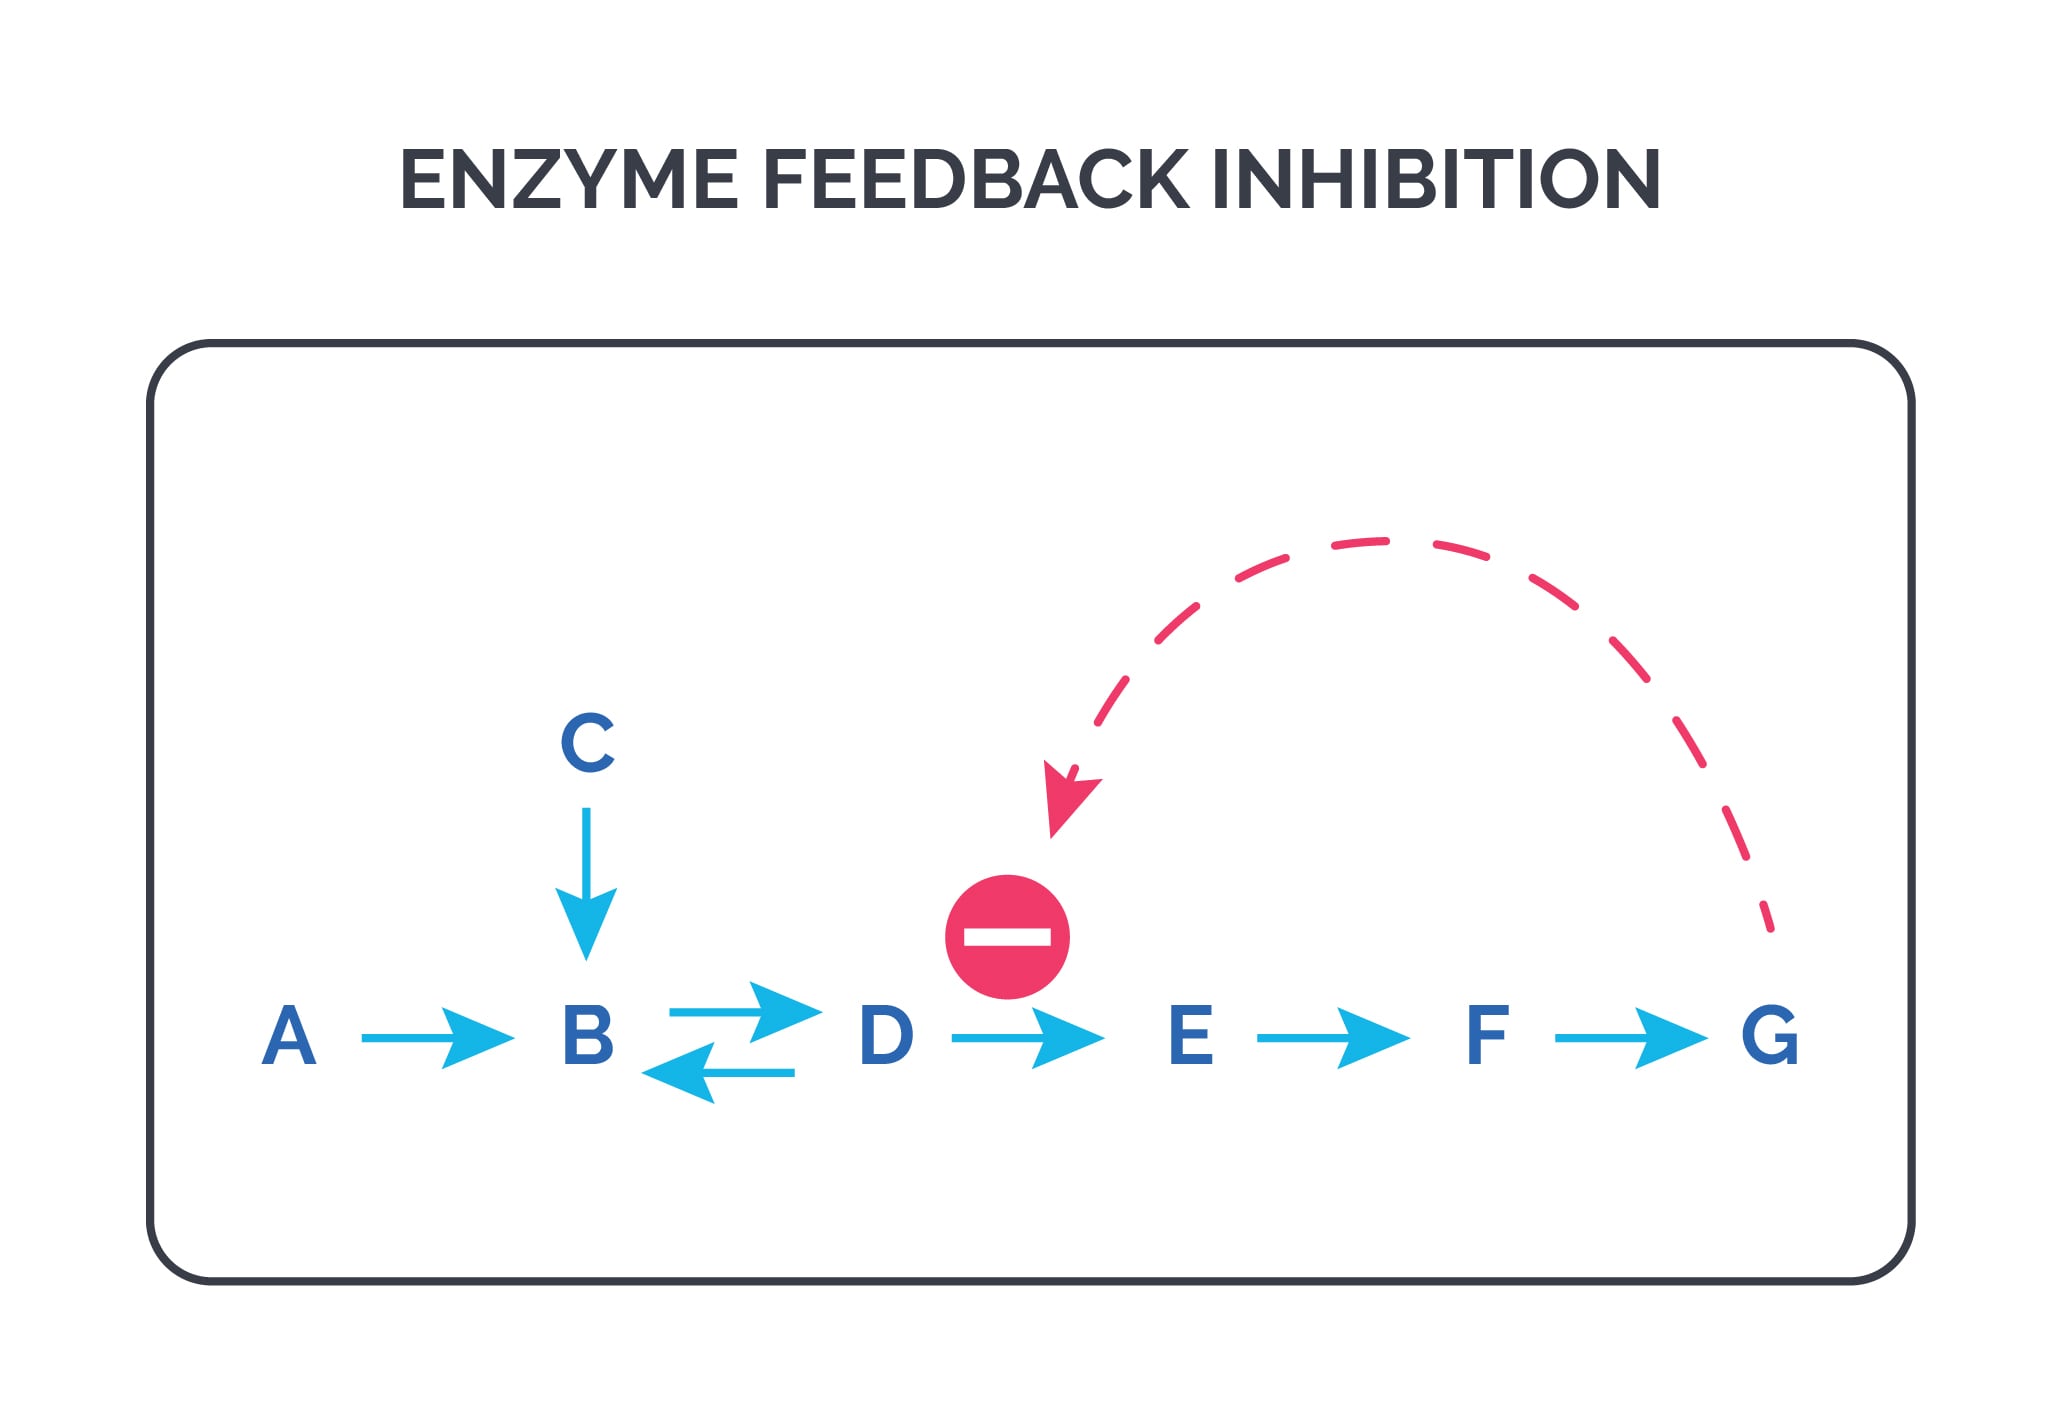
Heterotropic effectors: The effector is not the substrate. This is commonly used in feedback regulation.
In the figure above, the enzyme that converts D to E has an allosteric site that binds the end product G. If the concentration of G increases, the first irreversible step of the pathway is inhibited.
e.g. PFK-1 is inhibited by citrate.
ii) Other methods of regulating enzyme activity include covalent modification (adding or removing phosphate groups at serine, threonine, or tyrosine residues by kinases and phosphatases, respectively) and inducing or repressing enzyme synthesis.
Delta G: Delta G is the change in free energy.
- If Delta G is negative, there is a net loss of free energy and the reaction proceeds spontaneously (an exergonic reaction).
- If Delta G is positive, there is a net gain of free energy and the reaction does not proceed spontaneously (an endergonic reaction).
Anabolic processes are endergonic reactions, while catabolic processes that release energy (e.g., fatty acid oxidation) are exergonic reactions.
When Delta G is zero, reactants and products are at equilibrium. Reactions proceed until Delta G becomes zero. The free energy change of the forward reaction is equal in magnitude but opposite in sign to that of the reverse reaction.
Delta G depends on the concentration of reactants and products, temperature, and pressure. A reaction with a positive Delta G can still move forward if the ratio of products to reactants is sufficiently small.
Delta G values for consecutive reactions are additive. For example, if the first reaction is -4000 and the next is +400, then the total Delta G is -3600. Delta G values for pathways are additive.
Enzymes lower activation energy, increasing the rate of a reaction. Enzymes do not change the free energy change (Delta G) of the reaction.
Solve the example below:
{`∆G°
V↔W -4.0
W↔X +0.4
X↔Y -3.4
Y↔Z +5.7
`}
From the values of ∆G° given in the table, which compound in the overall metabolic pathway V↔W↔X↔Y↔Z will accumulate in the largest amount at equilibrium?
A) V
B) W
C) X
D) Y
E) Z
Answer is option D or product Y. The step from Y to Z has the largest positive ∆G° (+5.7), so it is the least favorable step in the forward direction; as a result, Y tends to accumulate.
If you look at the overall pathway from V to Z, the ∆G° values add up:
-4 + 0.4 - 3.4 + 5.7 = -1.3
Because the overall ∆G° is negative, the pathway as a series is likely to proceed. This is common in human metabolic pathways: for a pathway to proceed overall, the total ∆G° needs to be negative.
Enzymes can still be important for individual steps (e.g., Y to Z), because they decrease activation energy and increase reaction rate, even though they do not change ∆G°.