Functions, graphs, and set relationships
Defining functions
A relation is any collection of ordered pairs . A function is a relation with one key rule: each input is paired with exactly one output .
So, one input can’t produce two different outputs. However, different inputs can share the same output.
For example:
- The pairs and can both belong to a function because the inputs are different.
- The pairs and cannot belong to a function because the same input is paired with two different outputs.
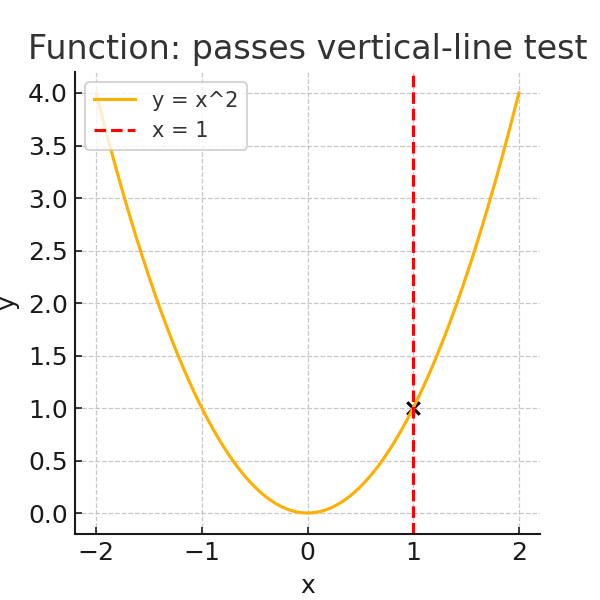
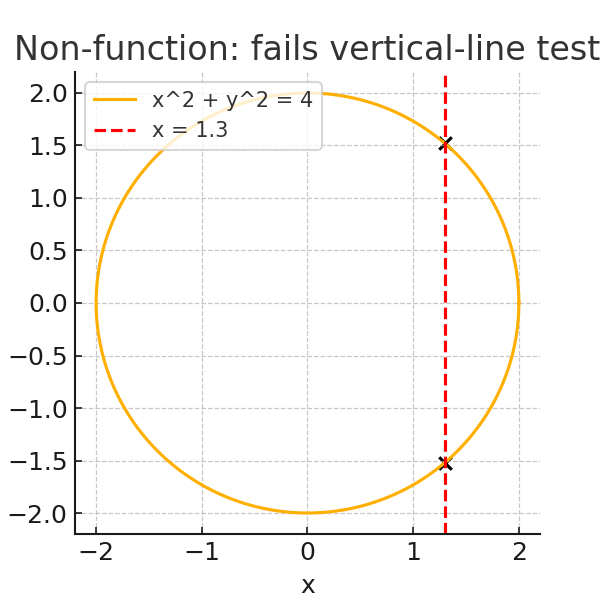
Vertical-line test
The vertical-line test checks whether a graphed relation is a function.
- Draw (or imagine) vertical lines through the graph.
- If any vertical line intersects the graph more than once, the relation is not a function.
- If every vertical line intersects at most once, the relation is a function.
A graph is a picture of a relation or function made by plotting points on the -plane.
Example: Determine if a relation is a function
Given the ordered pairs , , ,
- List the inputs: .
- Each input appears only once, so no input is paired with two different outputs.
Answer: Function
Evaluating functions
Evaluating a function means finding the output for a specific input. The notation means “the value of the function when .”
The main skill is substitution:
- Replace every in the formula with the given input value.
- Use parentheses around the substituted value.
- Simplify using the order of operations.
Parentheses matter most when the input is negative or when the expression includes exponents or fractions.
Example: Evaluate a quadratic function with a negative input
Let . Find .
- Substitute, keeping parentheses around : .
- Compute each term: .
Answer:
Domain and range
The domain of a function is the set of all input values for which the function is defined. In practice, you look for inputs that make the expression invalid and exclude them.
Common restrictions include:
- Division by zero: denominators cannot equal .
- Even roots (such as square roots): the expression inside the root must be greater than or equal to .
The range is the set of all possible output values produced by inputs in the domain. On the Praxis exam, range questions are typically limited to cases you can read from the form or the graph. For example, if a graph shows the lowest point at and extends upward forever, the range is .
Example: Find the domain
For : the denominator cannot equal , so solve and exclude it. Domain: .
For : the radicand must be nonnegative, so . Domain: .
Graphing linear functions
Graphing a linear function shows all solutions to the equation. Each point on the graph is an ordered pair that satisfies the equation, and all of those points lie on a straight line.
Because a linear function has a constant rate of change, its graph extends infinitely in both directions unless the problem states a restriction.
The method you use depends on the form of the equation:
- Some forms make slope and intercepts easy to read.
- Other forms are more convenient when you’re given a point on the line.
Being able to move between equations, tables, and graphs makes these questions much faster.
Slope-intercept form
Use slope-intercept form when you can read the slope and -intercept directly from the equation. It’s the most convenient form for quickly sketching a line.
For :
- Plot the -intercept .
- Use slope to find a second point.
- Draw the line through both points.
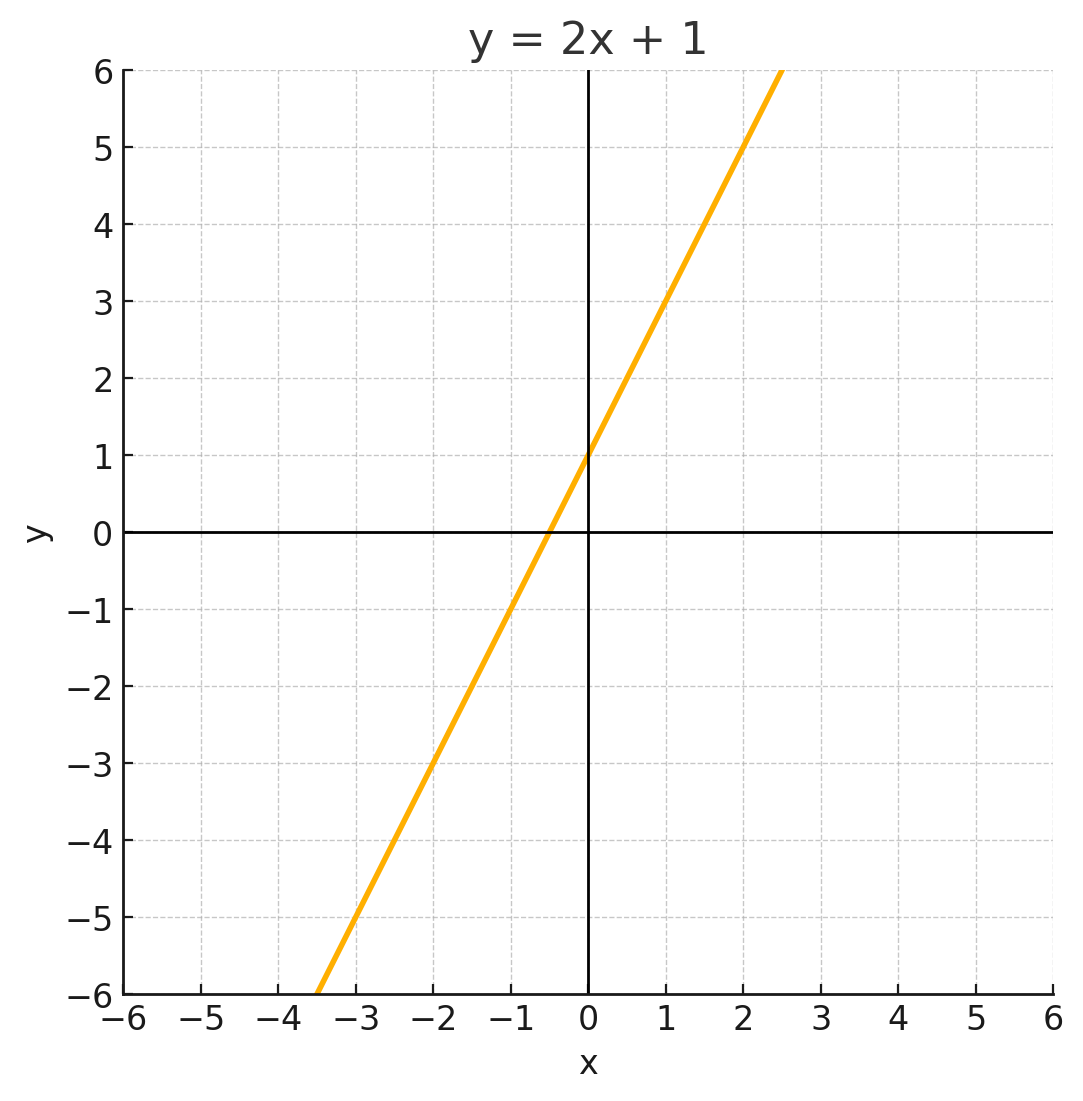
Example: Graph
- -intercept: .
- Slope , so from go right and up to .
Answer: See graph
Horizontal and vertical lines
Two special cases come up often on the Praxis and are easy to confuse.
Horizontal lines have the equation , where is a constant. Every point on the line has the same -value, so the slope is (zero rise, any run). For example, is a horizontal line crossing the -axis at .
Vertical lines have the equation , where is a constant. Every point on the line has the same -value. Moving from one point to another involves zero run, so slope , which is undefined. A vertical line itself is intersected by a vertical line at infinitely many points, so it fails the vertical-line test and is not a function.
Point-slope form
Use point-slope form when you know a point on the line and the slope, but the point isn’t the -intercept. It’s especially handy when you derive a line from two given points (see the next section).
The form
builds the line around the anchor point .
When you know and slope :
- Write .
- Use the slope to plot additional points, or rearrange into slope-intercept form if needed.
Example: Graph using point-slope form
Graph slope through .
- Start with the point-slope formula and substitute the given values: .
- Simplify the equation: , so .
- Plot the given point .
- Use the slope to move right and up to .
Answer: See graph
Finding a line from two points
When a problem gives you two points but no slope, you need to calculate the slope first, then use point-slope form to write the equation.
Step 1: Compute the slope using the two points and :
Keep the order consistent - use the same point as “point 2” in both the numerator and denominator, or you’ll flip the sign of the slope.
Step 2: Substitute and either point into point-slope form:
Step 3: Simplify into slope-intercept form if needed.
Example: Find the equation of a line through two points
A line passes through and .
- Compute the slope: .
- Substitute into point-slope form using : .
- Simplify: .
Answer:
Standard form and intercept method
Use standard form when the equation is already written as and you want to graph it quickly without rearranging - the intercept method gets you two points with minimal algebra.
The idea is to find where the line crosses each axis:
- The -intercept occurs where the graph crosses the -axis, which happens when .
- The -intercept occurs where the graph crosses the -axis, which happens when .
Once you have both intercepts, plot them and draw the line through the two points.
Example: Find the intercepts of
- Set to find the -intercept: , so .
- Set to find the -intercept: , so .
Answer: and