The basics
In the previous subchapter, you learned about fundamental analysis, which involves evaluating a company by reviewing its financial information. Now we’re shifting to a different approach.
Technical analysis involves identifying and forecasting trends in the stock market. Technical analysts typically pay little to no attention to a company’s fundamentals (like expenses, revenue, or earnings). Instead, they focus on price and trading patterns, looking for setups that have tended to repeat in the past.
Fundamental vs technical analysis
Fundamental and technical analysis are two different approaches to evaluating investments.
Fundamental analysis focuses on what to buy by examining a company’s financial health and broader economic conditions. Investors look at factors like earnings, revenue, price-to-earnings (P/E) ratio, dividends, and balance sheets to estimate a stock’s intrinsic value. This method is often used by long-term investors who want to find undervalued companies with strong growth potential. For example, an investor might buy a stock because it has consistent earnings growth and a low P/E ratio compared to its industry.
Technical analysis focuses on when to buy (and when to sell) by analyzing price trends, charts, and market patterns. It’s based on the idea that market behavior can form recognizable patterns and that those patterns may repeat. This method is commonly used by short-term traders, but it can also be used over longer time horizons to take advantage of price swings. For instance, a trader might buy a stock because it has broken above a key resistance level, signaling potential upward momentum.
A useful way to separate the two is this:
- Fundamental analysis helps you decide whether a stock is attractive based on financial and economic information.
- Technical analysis helps you time entries and exits based on price behavior and trends.
Many investors use both methods together.
Technical analysts often describe their work as studying how history “rhymes” in the market. To see what that means, let’s look at a stock chart:
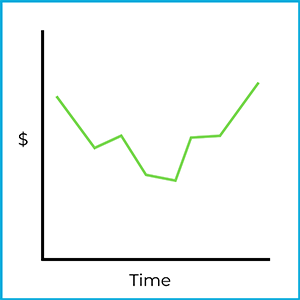
This may look like a basic stock chart, but a technical analyst would recognize it as a specific formation. In this case, it’s a head and shoulders bottom formation, which you’ll learn more about later in this subchapter.
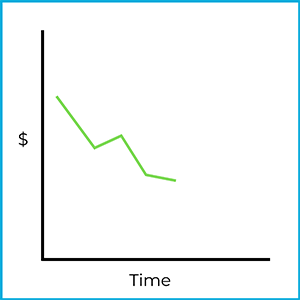
Even though the price movement in the chart above has already happened, technical analysts use patterns like this to form expectations about what might happen next. For example, imagine that a few days later the same stock starts fluctuating like this:
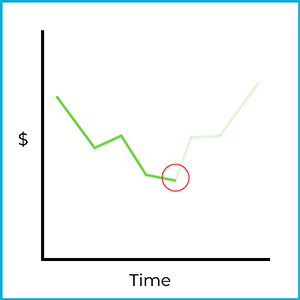
There’s no guarantee the price will move the same way again, but technical analysis is built on the idea that repeating patterns can provide evidence about likely future direction. If this stock follows the same trajectory as before, buying at this point could be profitable:
Of course, markets are unpredictable and the price could move the other way. Technical analysis is a forecasting tool, and not every forecast will be correct. Finding and interpreting these patterns takes careful chart work, which is why technical analysts are sometimes called “chartists” (chart artists).
In this subchapter, you’ll explore several ways technical analysts interpret and use market data to make investment decisions.