Resistance & support
If a market or stock price repeatedly struggles to move above or below certain price points, you can identify resistance and support levels. For example:
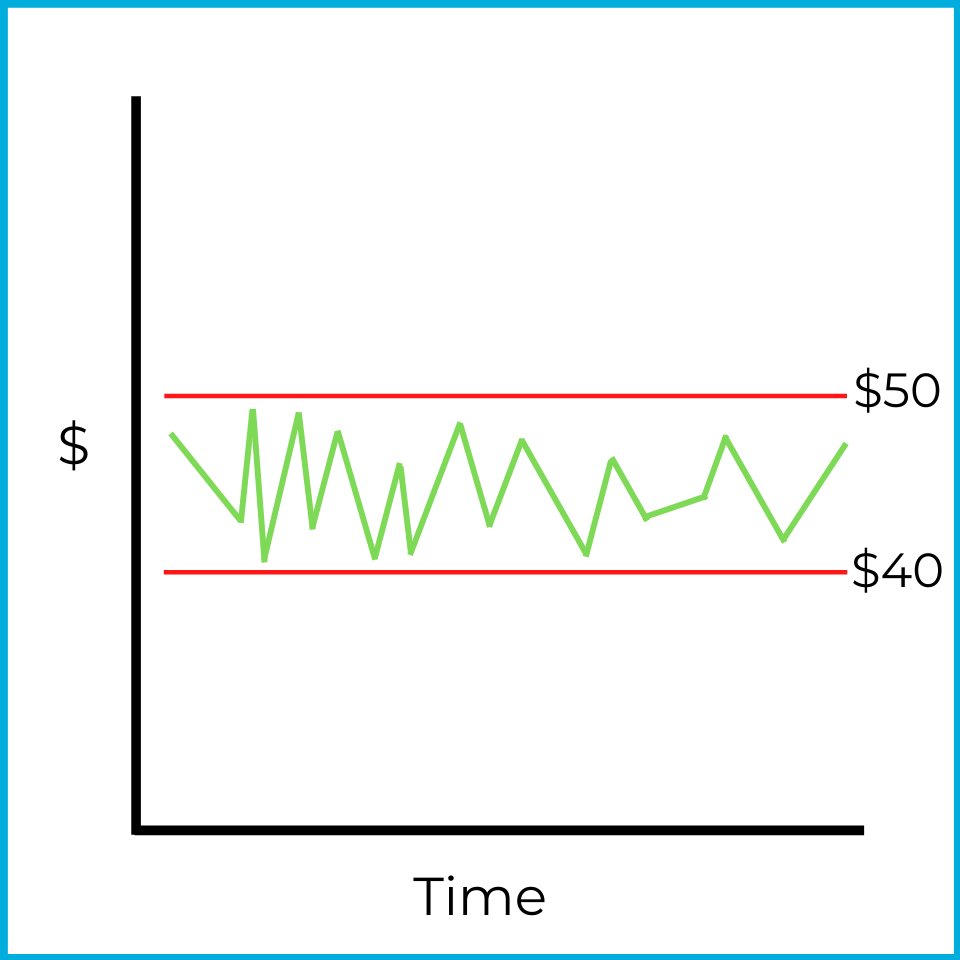
In this chart, when the stock approaches $50, it tends to reverse and move back down. That price level is the resistance level ($50 in this example). When the stock approaches $40, it tends to reverse and move back up. That price level is the support level ($40 in this example).
As we learned earlier in this subchapter, this is an example of a consolidating market, which makes it difficult to assign a clear market trend. While the price stays between resistance and support, a neutral strategy (like covered calls or short straddles) could be profitable.
A breakout must occur before you can identify a bullish or bearish trend. Here’s an example of an upside breakout:
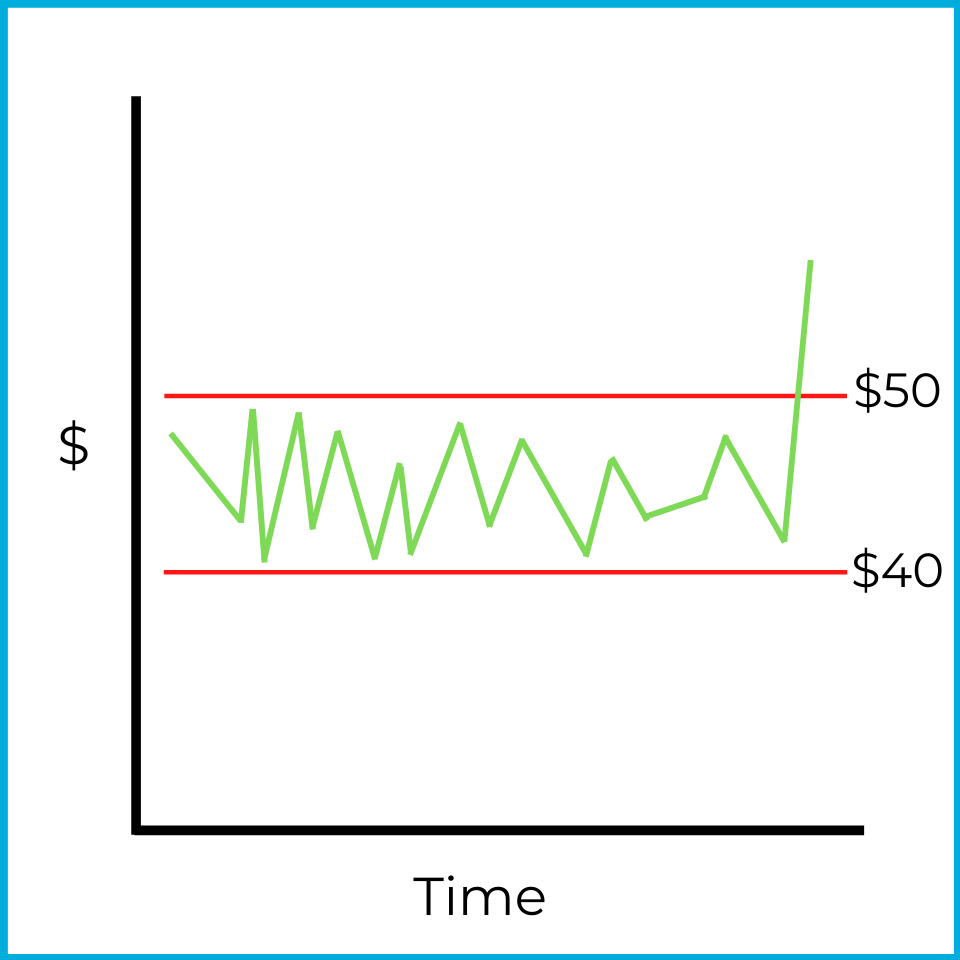
When a breakout occurs, stock prices tend to keep moving in the same direction. One reason is that many investors may be watching the same levels, which can create a self-fulfilling effect. When the price rises above resistance, investors may try to “jump on the bandwagon,” buy the stock, and ride the move upward. That added demand can push the price higher. For that reason, an upside breakout is a bullish indicator.
A downside breakout is the opposite:
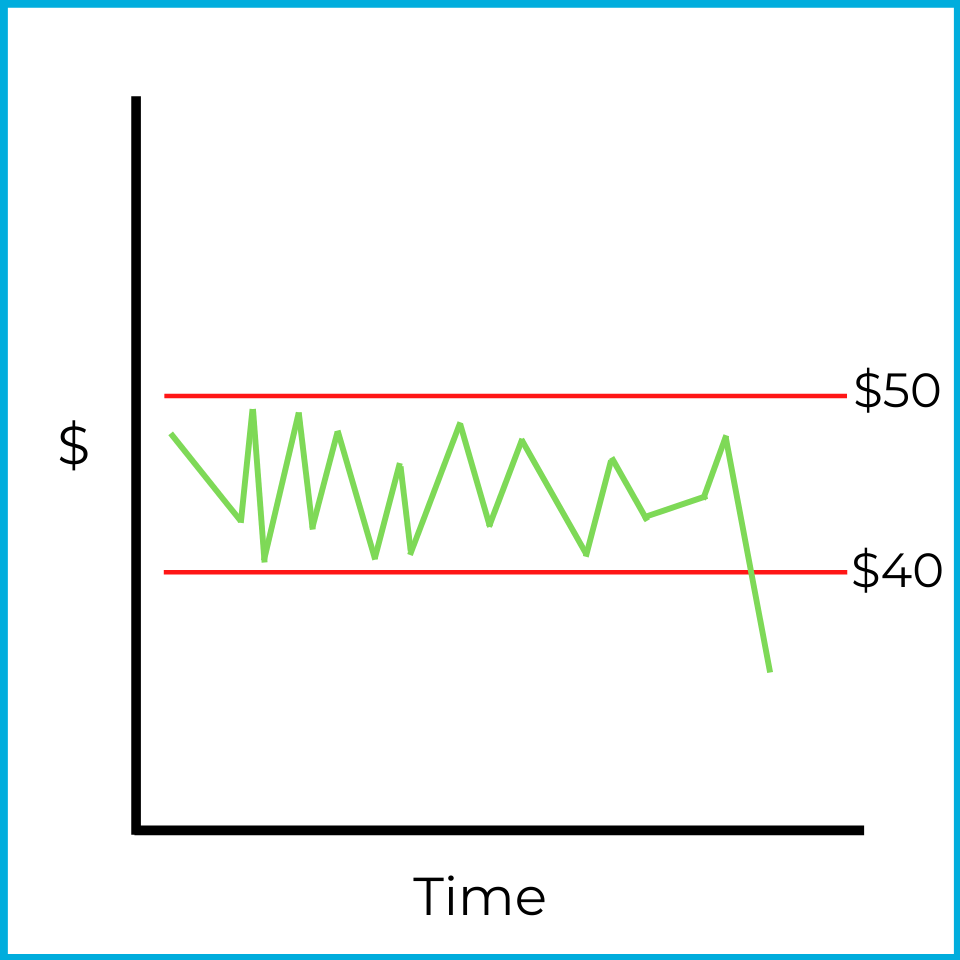
Again, a breakout trend tends to continue in the same direction. When the price falls below support, investors may try to “jump off the bandwagon” and sell to avoid further losses. A more savvy technical analyst might even sell short and profit if the market continues to fall. As more investors sell, the increased supply can drive the price down further.
In the secondary markets chapter, we’ll discuss what types of orders investors can place to benefit from an upside or downside breakout.