Head & shoulders formations are market trends that include a reversal, like saucers. There are two types of head & shoulder formations: head & shoulders top formations and head & shoulder bottom formations.
A head and shoulders top formation looks something like this:
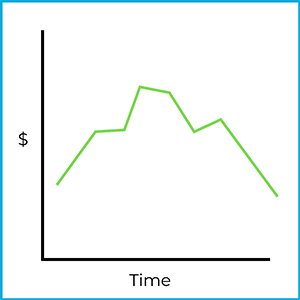
Hopefully, you see a basic outline of a person. A head & shoulders top formation rises, flattens, rises again, flattens again, falls, flattens one last time, and falls again. Initially, the stock price was trending upwards, but then it reversed at the top and moved back downward. This is an example of a reverse upward trend.
Technical analysts are on the lookout for the beginning of a head & shoulders formation. For example:
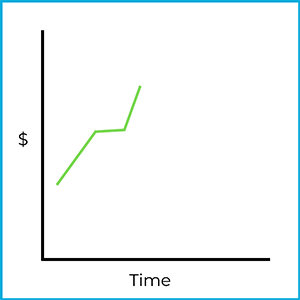
It may not look like much, but a skilled technical analyst may pick this out as the beginning of a head & shoulders top formation. If they are correct, they could make a return by going short (selling short) the stock:
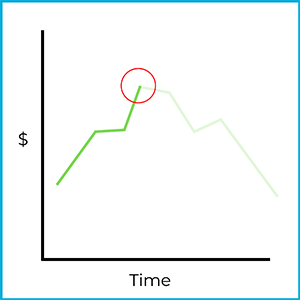
Borrowing shares and selling them at this point could return a large profit, although the investment is subject to considerable risk. Remember, short selling subjects investors to unlimited risk potential! Stock movements are never 100% predictable, but a confident chartist might pull the trigger and short the stock at this point. If the market trends in the expected direction, a large profit could be made!
A head & shoulders bottom formation is basically an upside version of a top formation:
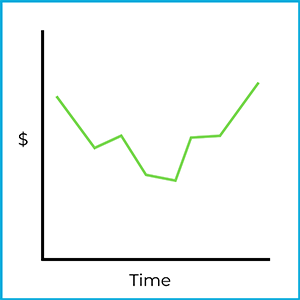
Does it look like a person hanging upside down? A head & shoulders bottom formation falls, flattens, falls again, flattens again, rises, flattens one last time, and rises again. Initially, the stock price was trending downwards, but then it reversed at the top and moved back upward. This is an example of a reverse downward trend.
Chartists watch the market for the initial stages of head & shoulders formations:
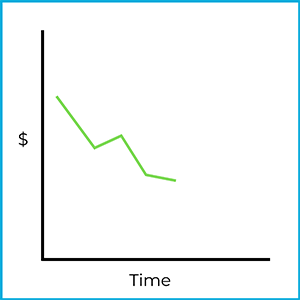
An experienced chartist may identify this as the beginning of a head & shoulders bottom formation. If they are correct, they could make a profit by going long (buying) the stock:
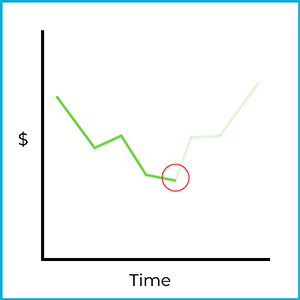
Again, stock movements are never 100% predictable, but a confident technical analyst may buy a bunch of stock if they spotted this trend. If they’re right, they can make an unlimited return the further the market rises.
Sign up for free to take 3 quiz questions on this topic