Saucers
Saucer formations are market trends that include a reversal. There are two types of saucer formations: saucer bottom formations and saucer top formations.
A saucer bottom formation looks something like this:
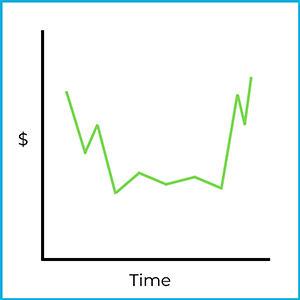
It resembles a saucer (a bowl). Technical analysts look for patterns like this because they may help predict future price movement. In this example, the stock price starts and ends in roughly the same area, but after reaching a low point it begins moving upward. This is a reverse downward trend: the price was trending down, then reversed and began trending up.
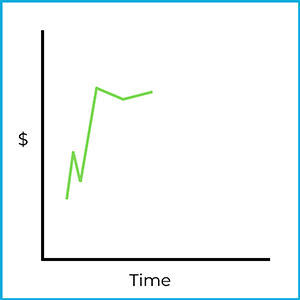
Technical analysts watch for the early stages of a saucer bottom formation. For example:
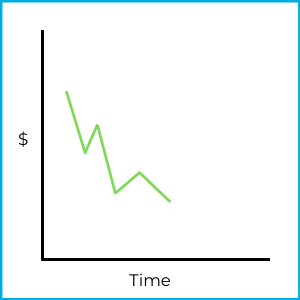
If a chartist identified this as the beginning stage of a saucer bottom formation, they might try to profit by going long (buying) the stock at this point:
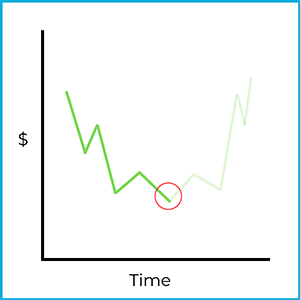
Of course, the market is unpredictable and could move in a different direction. Still, prices sometimes trend in recognizable ways. A technical analyst who acts on this pattern is taking a risk, and that risk may or may not pay off.
If you flip the previous stock charts upside down, you get a saucer top formation. It looks like this:
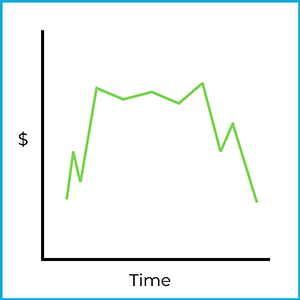
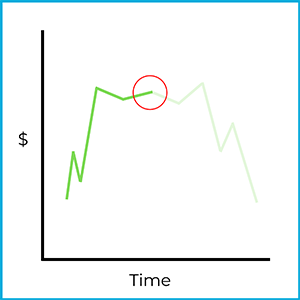
This resembles an upside-down saucer (a bowl). Here, the market was trending upward, then flattened out, and then reversed downward. This is a reverse upward trend: the price was trending up, then reversed and began trending down. Chartists watch for the early stages of a saucer top formation.
If an investor correctly identifies the beginning of a saucer top formation, they might try to profit by going short (short selling) the stock at this point:
Again, the market is unpredictable and could move in a different direction. An investor who sells short is taking a significant risk (short selling comes with unlimited risk), but the trade could pay off. If the trend continued downward beyond this chart, the investor would make a significant profit.