Market trends
A market trend describes the market’s overall direction. On any given trading day, prices move up and down. A trend line helps you see the “big picture” by smoothing out those short-term fluctuations.
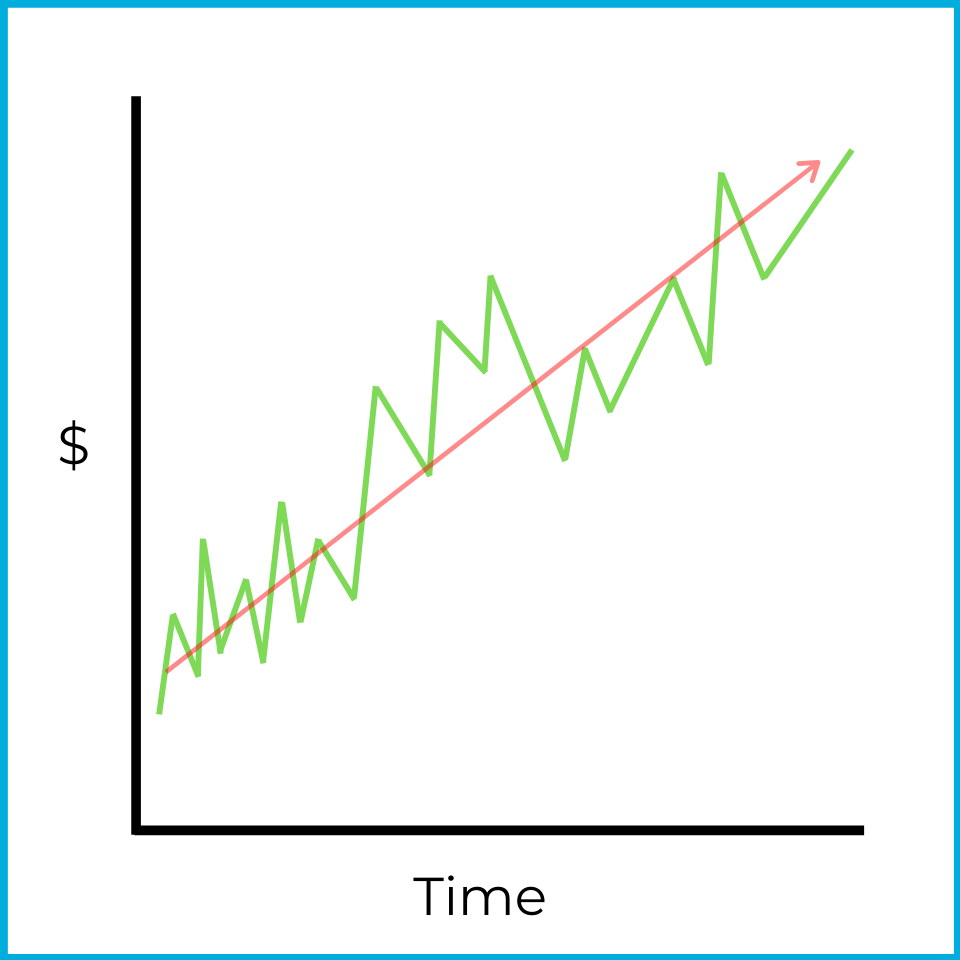
Even though this chart shows several up-and-down moves, the stock is clearly trending upward overall. If this chart covered a month of trading, you’d describe the market as bullish over that timeframe. Temporary pullbacks are normal in bull markets, but the higher-level view still shows a rising market.
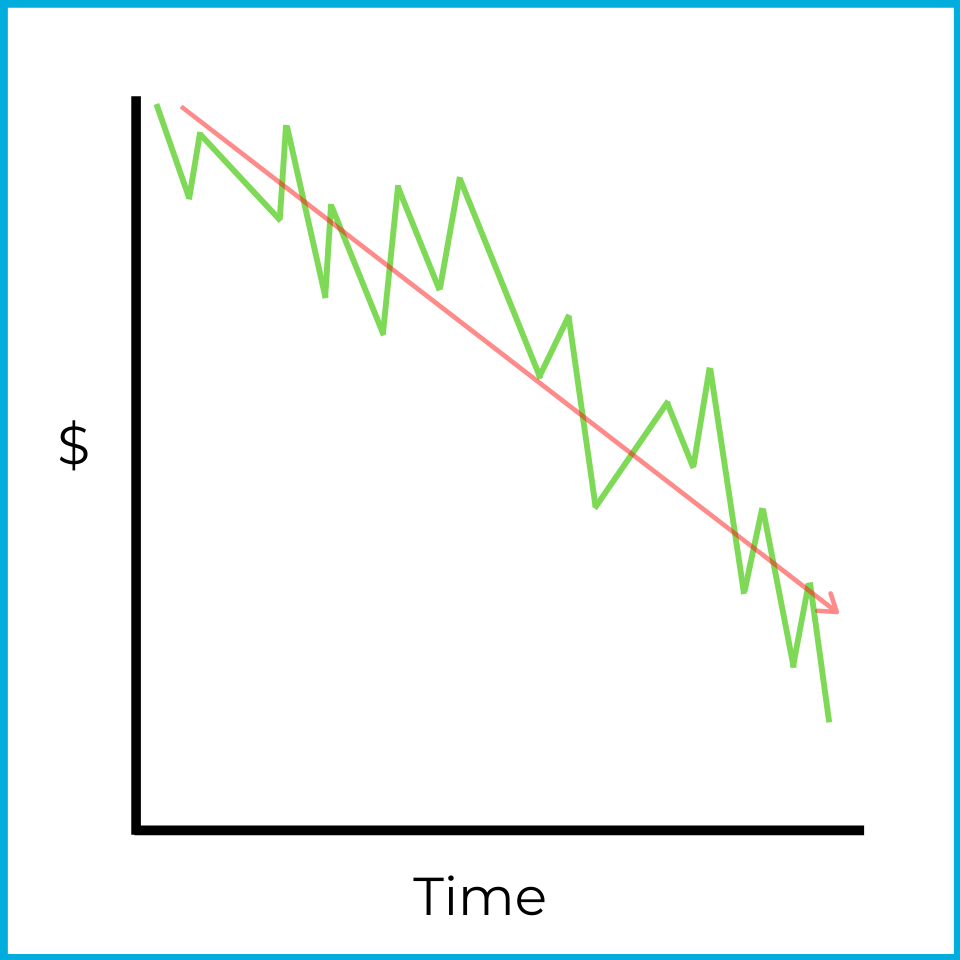
Trend lines can also describe bearish markets. Here, there are some upward moves, but prices are generally falling over the period shown.
Trends can be identified with charts, but you can also spot them using number-based data. The S&P 500 is an index of 500 large publicly traded companies in US markets. One way to gauge the market’s overall direction is the advance/decline line, which compares how many stocks rose versus fell.
For example:
S&P 500 stocks
| Date | Price increases | Price decreases |
|---|---|---|
| Monday | 425 stocks | 75 stocks |
| Tuesday | 375 stocks | 125 stocks |
| Wednesday | 350 stocks | 150 stocks |
Over these three days, more stocks rise than fall each day, so the market’s overall direction is upward. This idea is called market breadth, which refers to the general direction of price movements across the market.
At the same time, notice what’s changing: the number of declining stocks increases each day (75 → 125 → 150). That shift suggests the market may be approaching a reversal. In this context, the market is described as overbought.
An overbought market occurs when overall prices are still rising, but the market is starting to lose upward momentum and may be moving toward a decline. In chart form, it could look like this:
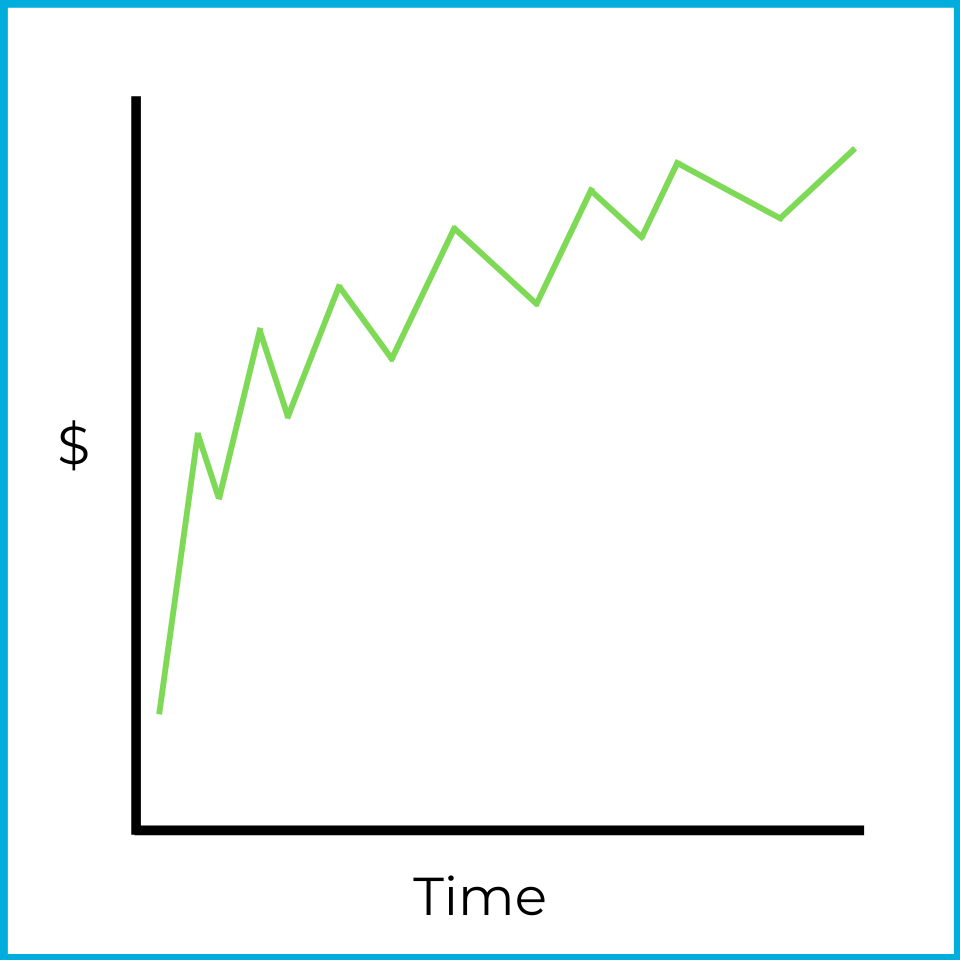
The market is still moving higher, but not as strongly as before. If that pattern continues, eventually more stocks may fall than rise, leading to an overall market decline.
Now look at the advance/decline line from the other direction:
S&P 500 stocks
| Date | Price increases | Price decreases |
|---|---|---|
| Monday | 50 stocks | 450 stocks |
| Tuesday | 90 stocks | 410 stocks |
| Wednesday | 160 stocks | 340 stocks |
Over these three days, more stocks fall than rise each day, so the market’s overall direction is downward. Again, this is market breadth.
But the number of advancing stocks increases each day (50 → 90 → 160), which suggests the decline may be weakening and a reversal could be developing. This situation is described as an oversold market.
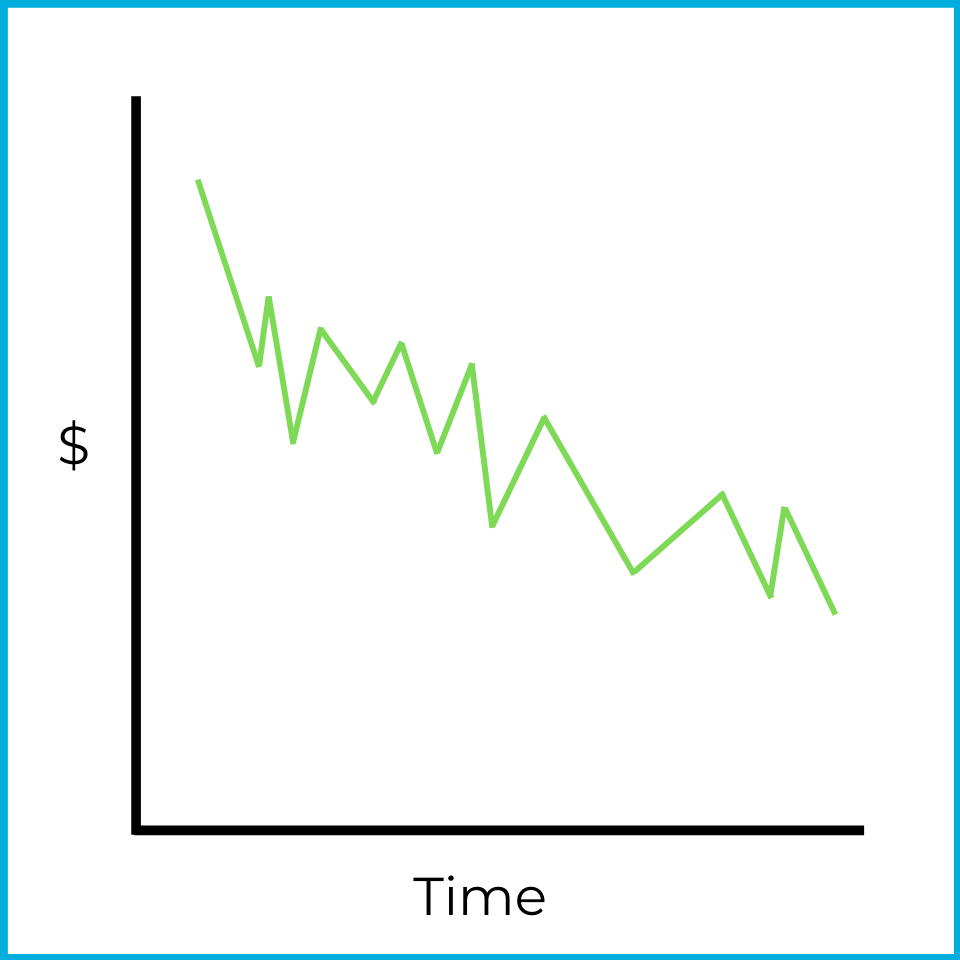
An oversold market occurs when overall prices are still falling, but the market is starting to lose downward momentum and may be moving toward a rise. Prices aren’t dropping as sharply as they were earlier. If the trend continues, eventually more stocks may rise than fall, leading to an overall market increase.
When a stock price (or the overall market) shows reduced volatility, a consolidation may be occurring. If price movements look indecisive and stay within a specific range, it’s difficult to draw a clear trend. For example:
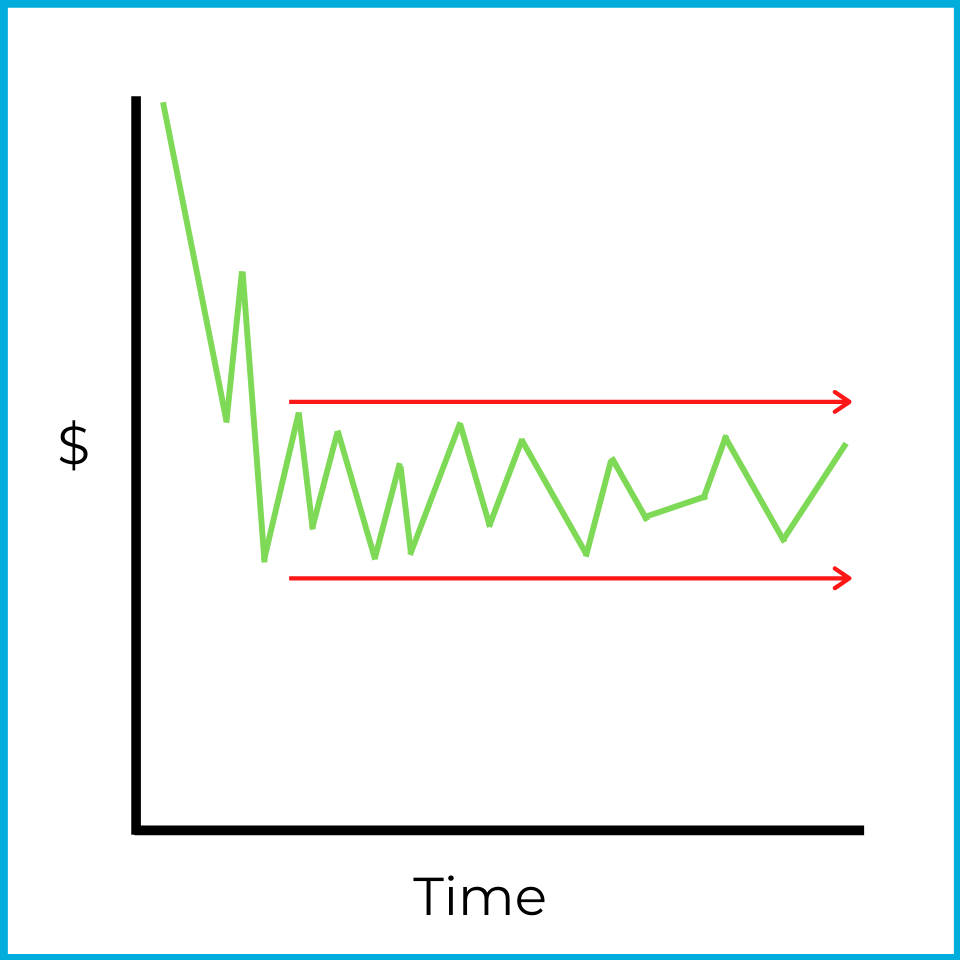
While prices were falling at first, they then stabilized and stayed within a narrow range. In many cases, traders looking for quick price movement avoid stocks showing this behavior. However, this can be a useful environment for flat-market strategies (like covered calls or short straddles, which you’ll learn about later).
Market volume is another trend technical analysts watch. Volume measures how much trading occurs in a stock (or in the overall market). For example, the average daily trading volume of Snapchat stock (ticker: SNAP) is approximately 52 million shares (3-month average as of June 2026). If the number of shares traded changes dramatically on a given day (for example, 150 million shares of SNAP traded in one day), that would stand out to a technical analyst. The meaning of a volume change can vary, but it’s an important data point that chartists track.
In conclusion, market trends come in different shapes and sizes, and technical analysts use them to inform trading decisions. In real markets, consistently timing investments for positive returns takes knowledge, experience, and luck. For the Series 7 exam, focus on the basics: how to recognize these trends and what they suggest about possible future market movement.