Head & shoulders
Head & shoulders formations are chart patterns that signal a reversal, similar to saucers. There are two types:
- Head & shoulders top formations
- Head & shoulders bottom formations
A head and shoulders top formation looks something like this:
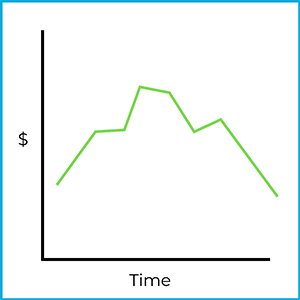
You can think of this pattern as the outline of a person (left shoulder, head, right shoulder). In price terms, a head & shoulders top formation:
- Rises, then flattens
- Rises again to a higher peak, then flattens again
- Falls, flattens one last time, then falls again
The key idea is the trend change. The stock was trending upward, but then it reverses and starts moving downward. This is a reverse upward trend (an uptrend that turns into a downtrend).
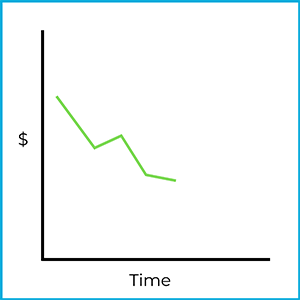
Technical analysts watch for the early stages of a head & shoulders formation. For example:
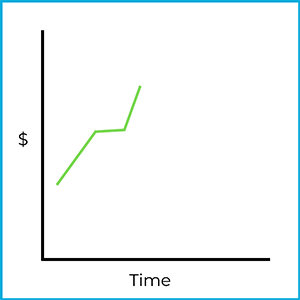
At this stage, the full pattern isn’t complete yet, but an experienced chartist may recognize it as the start of a head & shoulders top formation. If they’re correct, they might try to profit by going short (selling short) the stock:
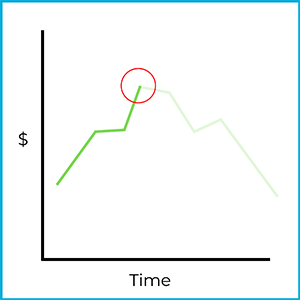
Borrowing shares and selling them at this point could lead to a profit if the price falls as expected. This strategy also carries significant risk. Remember, short selling exposes investors to unlimited risk potential. Stock movements are never 100% predictable, so even a strong-looking pattern can fail.
A head & shoulders bottom formation is essentially the upside-down version of a top formation:
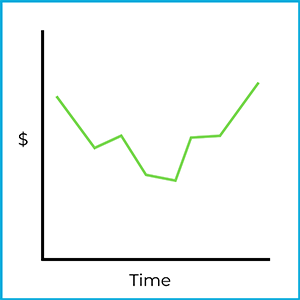
This can look like a person hanging upside down. In price terms, a head & shoulders bottom formation:
- Falls, then flattens
- Falls again to a lower low, then flattens again
- Rises, flattens one last time, then rises again
Here, the stock was trending downward, but then it reverses and starts moving upward. This is a reverse downward trend (a downtrend that turns into an uptrend).
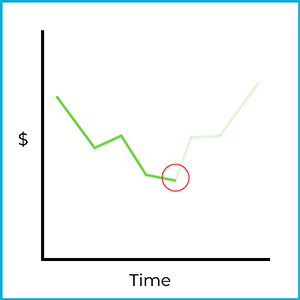
Chartists also watch for the initial stages of head & shoulders bottom formations:
An experienced chartist may identify this as the beginning of a head & shoulders bottom formation. If they’re correct, they could try to profit by going long (buying) the stock:
As with any chart pattern, the market isn’t perfectly predictable. A technical analyst who believes this reversal is forming may buy shares expecting the price to rise. If the market moves higher, the potential gain increases as the price continues to rise.