


Achievable logoAchievable logo
FE Civil
Sign in
Sign up
Purchase
Textbook
Practice exams
Support
How it works
Exam catalog
Mountain with a flag at the peak
Textbook
Introduction
1. Mathematics
2. Combinatorics, probability and statistics
3. Engineering economics
4. Statics
5. Materials
5.1 Behavior and properties
5.2 Testing, mix design, and durability
6. Dynamics
7. Mechanics of materials
8. Fluid mechanics
9. Soil mechanics
10. Structural engineering
11. Concrete structure design
12. Water resources engineering
13. Environmental engineering
14. Transportation engineering
15. Surveying, construction, ethics and professional practice
16. Wrapping up
(change me)
Achievable logoAchievable logo
5.1 Behavior and properties
Achievable FE Civil
5. Materials
Our FE Civil course is currently in development and is a work-in-progress.

Behavior and properties

8 min read
Font
Discuss
Share
Feedback

This chapter covers the following:

  • Material properties of steel reinforcement
  • Tensile testing of reinforcement
  • Plain concrete compressive stress vs. strain behavior
  • General properties of concrete
  • Types of portland cement

Material properties of steel reinforcement

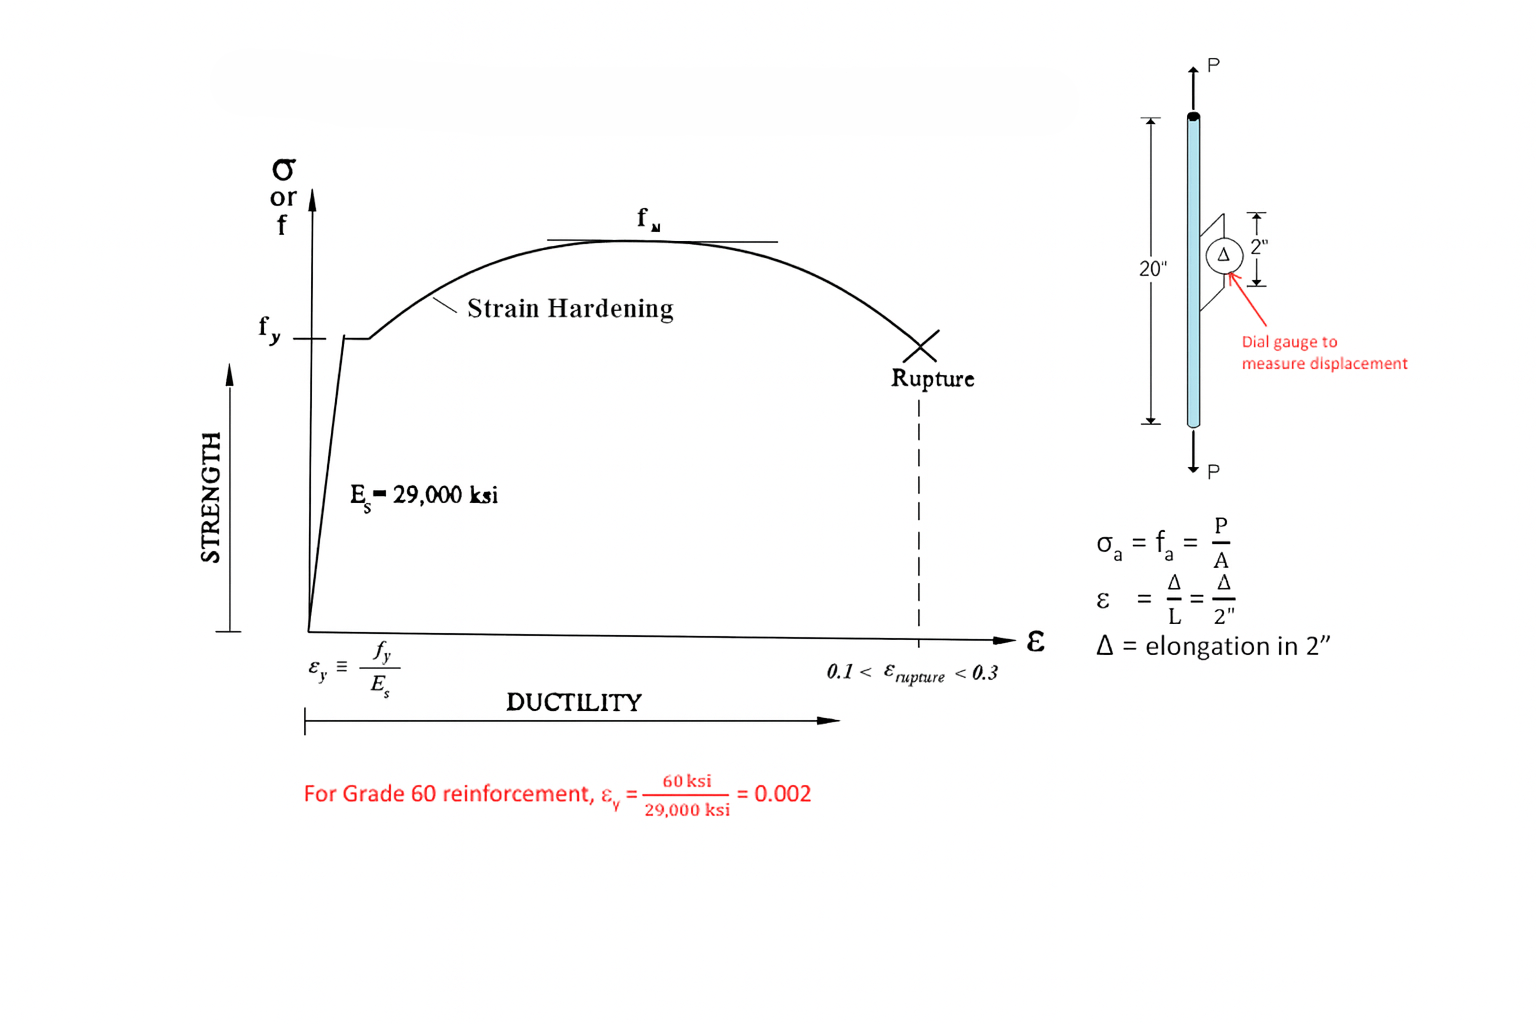
Stress-strain behavior of steel reinforcement, showing elastic region, yield point, strain hardening, ductility, and rupture, along with a tensile test setup for measuring elongation.
Material properties of steel reinforcement

The figure shows a typical stress-strain curve for reinforcing steel in axial tension. You’ll usually describe the curve in these regions:

  • Elastic region: The initial linear portion where Hooke’s law applies.
  • Yield plateau: Stress stays roughly constant while strain increases.
  • Strain hardening: Stress increases again after yielding.
  • Necking and rupture: The final stage where the bar fractures.

Here Es​=29,000 ksi is the elastic modulus of steel. It’s the slope of the initial linear (elastic) portion of the stress-strain curve. For Grade 60 reinforcement, fy​=60 ksi. The yield strain is:

εy​=Es​fy​​=29,000 ksi60 ksi​=0.002

Rupture strain typically falls in this range:

0.1<εrupture​<0.3

Tensile testing of reinforcement

The right-hand diagram shows a typical tensile test setup used to measure elongation in a reinforcing bar.

  • Total bar length: 20 inches
  • Gage length: 2 inches (between displacement gauges)
  • Load: Axial tensile load P applied at both ends
  • Dial gauge: Measures elongation Δ over the 2-inch gage length

The axial stress is:

σa​=fa​=AP​

where:

  • P = applied force
  • A = cross-sectional area of the steel bar

The corresponding strain is:

ε=LΔ​=2′′Δ​

where:

  • Δ = elongation in the 2 inches gage length
  • L=2 inches

Some interesting facts on steel

The resistance of steel to deformation can be increased through alloying and hardening processes. Adding alloying elements improves strength and hardness by altering the steel’s microstructure, while hardening treatments increase resistance to plastic deformation. Hot working generally improves ductility rather than increasing hardness, and tempering mainly reduces brittleness after hardening. Among the common steel microstructures, martensite is the hardest form due to its highly strained crystal structure created during rapid quenching. Ferrite is soft and ductile, pearlite has moderate hardness, and bainite provides a balance between strength and toughness. Corrosion of iron depends on the electrochemical relationship between iron and the coating metal. More electropositive metals such as magnesium, zinc, and aluminum provide sacrificial protection to iron, reducing corrosion. However, a less electropositive or more noble metal like gold can accelerate corrosion of exposed iron through galvanic action if the coating is damaged.

Plain concrete compressive stress vs. strain behavior

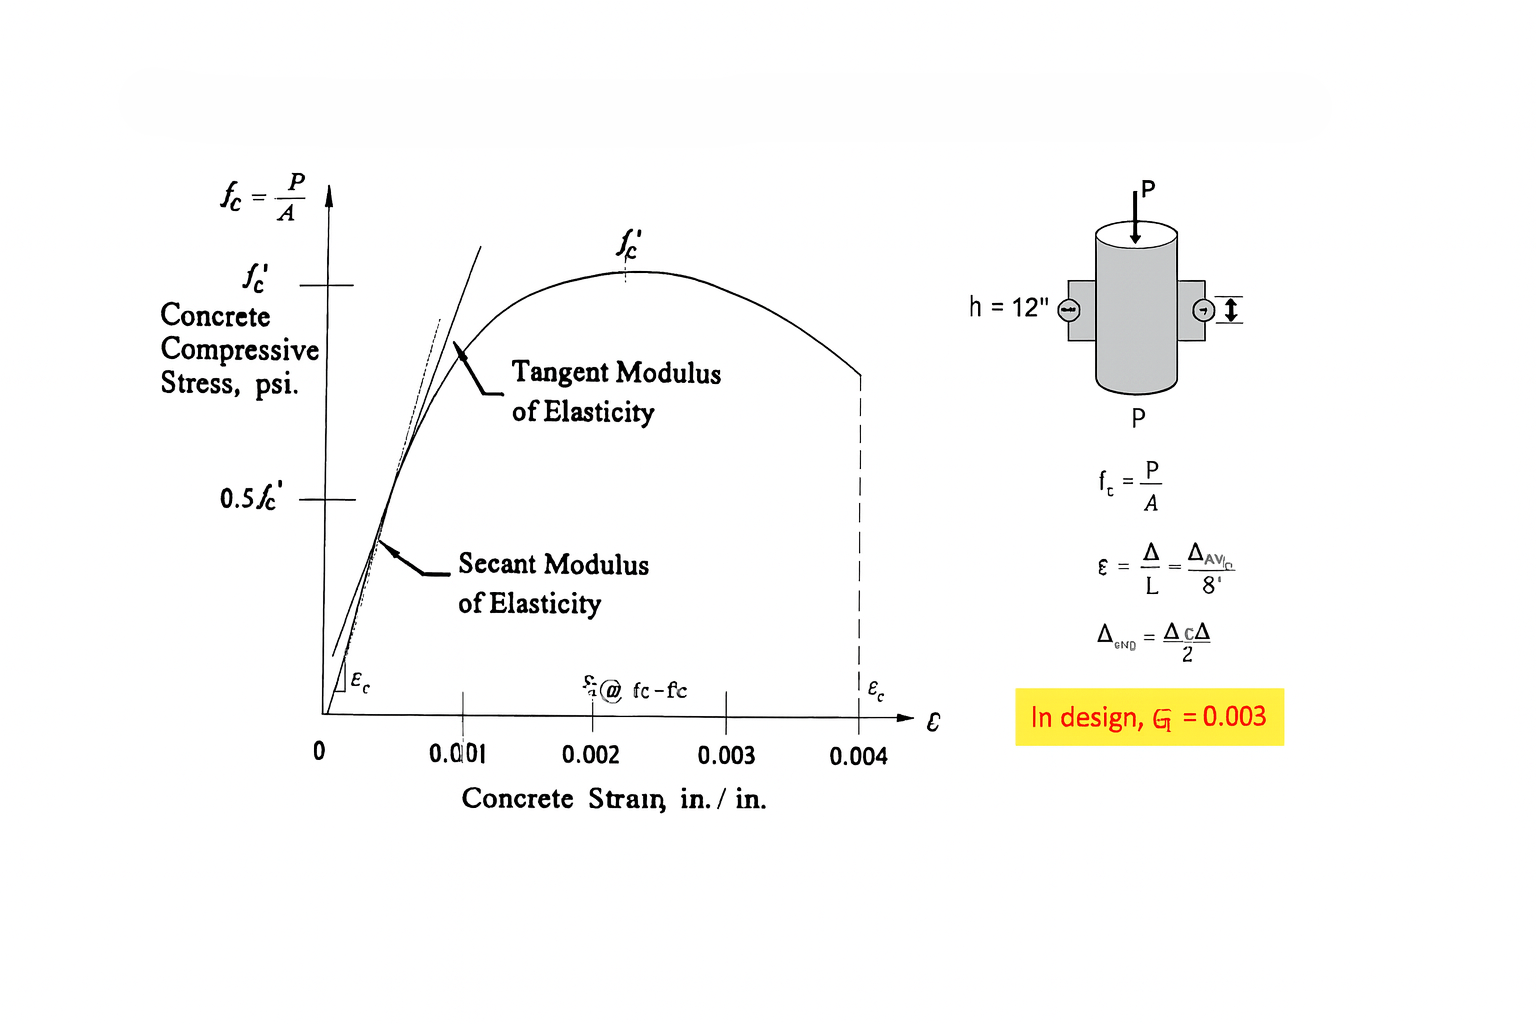
The figure shows the stress-strain relationship of concrete in compression, including the secant and tangent modulus of elasticity, peak strength, and the standard compression test setup used to measure strain.
Concrete compresive stress and strain relationship

The figure shows the compressive stress-strain curve for concrete, typically measured using a standard concrete cylinder (6" diameter × 12" height). In the test, a compressive forceP is applied until the cylinder fails.

  • Diameter: D=6′′
  • Height: h=12′′
  • Gauge length for strain measurement: 8′′

The axial stress is:

fc​=AP​

where:

  • P = axial compressive load
  • A=4π​D2 = cross-sectional area

The axial strain is:

ε=LΔavg​​=8′′Δavg​​

with:

Δavg​=2Δt​+Δb​​

Where:

  • Δt​ and Δb​ = measured deformations at the top and bottom

The curve shape is typically described as:

  • An initial nonlinear region up to around 0.5fc′​
  • A steeper rising portion after that
  • A maximum stress at fc′​ (ultimate compressive strength)
  • A descending branch representing softening or crushing

Common terms on the curve include:

  • fc′​: peak compressive strength of concrete (psi)
  • εc​: strain at fc​=fc′​
  • εu​: ultimate strain (crushing failure)

In design, εu​=0.003. This is the maximum usable concrete strain assumed before crushing.

The modulus of elasticity for concrete is commonly described in two ways.

Tangent modulus of elasticity

  • The slope of the stress-strain curve at a specific point
  • Often taken at the origin to represent initial stiffness:

Et​=dεdfc​​​ε→0​

Secant modulus of elasticity

  • The average slope from the origin to a defined point (often at 0.5fc′​):

Es​=ε0.5​0.5fc′​​

Concrete crushes when:

ε=εu​≈0.003 (in design)

This failure is brittle and sudden, which is why concrete is typically used with steel reinforcement.

General properties of concrete

Compressive strength (fc′​)

  • Obtained from 28-day cylinder tests
  • Normal strength concrete:

fc′​=2000 to 8000psi

  • High-strength concrete:

fc′​=8000 to 25000psi

Tensile strength (ft′​)

Measured by the splitting tensile strength test:

  • Typical value:

ft′​≈0.10fc′​

  • Splitting tensile strength formula:

ft′​=πDL2P​

Where:

  • P = applied load
  • D = diameter
  • L = length of cylinder

Modulus of rupture (fr​)

Used to estimate tensile strength in flexure (for example, in beams):

  • Formula (with fc′​ in psi):

fr​=7.5fc′​​

  • Flexural tensile stress from beam loading:

fb​=SM​

Where:

  • M=6P (for symmetric beam setup)
  • S=6bh2​=66×(6)2​=36in3

Substituting:

fb​=366P​=6P​(psi)

Shear strength (Vc​)

  • Typical range: 16%−25% of fc′​

For normal weight concrete:

Vc​=2fc′​​⋅b⋅d

For lightweight concrete:

vc​=2fc′​​(in psi units)

Unit weight (wc​)

  • Normal reinforced concrete:

wc​≈150pcf

  • Lightweight concrete:

wc​≈120pcf

Modulus of elasticity (Ec​)

Used in serviceability analysis (for example, deflection).

General expression:

Ec​=wc1.5​(33)fc′​​

For normal weight concrete (wc​=145 pcf), a commonly used simplified formula is:

Ec​=57000fc′​​

Slump test: workability of concrete

  • Slump indicates consistency (plasticity)
  • Typical slump values: 1′′ to 4′′

Water-cement (W/C) Ratio

The water-cement ratio is the ratio of water weight to cement weight in a mix.

  • Typical range: 0.40 to 0.60

For full hydration:

W/C ratio=0.25⇒25% water by weight of cement

  • Higher W/C ratio → more workable, less strength
  • Lower W/C ratio → less workability, higher strength

Hydration

  • Chemical reaction between cement and water
  • Produces heat of hydration
  • Critical for early strength and setting

Types of portland cement

Type I: Normal PC - General purpose

Type II: Modified PC - Moderate sulfate resistance, used in hot weather for larger structures (mixed properties of Types IV and V)

Type III: High early strength

Type IV: Low heat - Large structures (dams)

Type V: Sulfate resistant (for concrete in contact with soil or for roadway pavement)

Some interesting facts on cement

Fly ash is a commonly used pozzolanic material in concrete that reacts with calcium hydroxide produced during cement hydration to form additional cementitious compounds, improving strength and durability. It also acts as a microfiller, reducing permeability and enhancing resistance to scaling caused by deicing chemicals when used in appropriate proportions under ASTM C618 requirements. Fly ash does not primarily react with calcium silicate directly.

Material properties of steel reinforcement

  • Stress-strain curve regions: elastic, yield plateau, strain hardening, necking/rupture
  • Elastic modulus Es​=29,000 ksi; yield strength fy​=60 ksi (Grade 60)
  • Yield strain εy​=0.002; rupture strain 0.1<εrupture​<0.3

Tensile testing of reinforcement

  • Standard bar: 20" length, 2" gage length for elongation measurement
  • Axial stress: σa​=AP​; strain: ε=2′′Δ​
  • Load applied axially; dial gauge measures elongation

Plain concrete compressive stress vs. strain behavior

  • Stress-strain curve: initial nonlinear, steep rise, peak at fc′​, descending branch (softening/crushing)
  • Ultimate compressive strength fc′​; design ultimate strain εu​=0.003
  • Modulus of elasticity: tangent (initial slope), secant (origin to 0.5fc′​)

General properties of concrete

  • Compressive strength fc′​: 2000–8000 psi (normal), up to 25,000 psi (high-strength)
  • Tensile strength ft′​≈0.10fc′​; modulus of rupture fr​=7.5fc′​​
  • Shear strength Vc​=2fc′​​bd; unit weight: normal 150 pcf, lightweight 120 pcf
  • Modulus of elasticity Ec​=57000fc′​​ (normal weight)
  • Slump (workability): 1"–4"; water-cement ratio: 0.40–0.60
  • Hydration: cement + water reaction, produces heat, critical for strength

Types of portland cement

  • Type I: Normal; Type II: Moderate sulfate resistance; Type III: High early strength
  • Type IV: Low heat (large structures); Type V: Sulfate resistant

Concrete strength testing requirements

  • Minimum sampling: once/day, each 150 yd³, or each 5000 ft² (whichever governs)
  • No test required if <50 yd³ and approved evidence of strength
  • Strength test: average of 2 (6"x12") or 3 (4"x8") cylinders, tested at 28 days
  • Acceptance: 3-test average ≥fc′​; no single test <fc′​−500 psi (if fc′​≤5000 psi) or <0.9fc′​ (if fc′​>5000 psi)
  • Field-cured cylinders: must be ≥85% of lab-cured, unless field-cured >fc′​+500 psi
  • Core tests: average of 3 cores ≥0.85fc′​; no single core <0.75fc′​

Concrete mix design parameters

  • Yield: total mass of materials / density of fresh concrete
  • Absolute volume: mass / (specific gravity × density of water)
  • Aggregate moisture: SSD condition used; free moisture = total – absorbed moisture
  • Water-cement ratio w/c=mass of cementitious materialsmass of water​

Aggregate properties in concrete mix design

  • SSD: pores filled, no surface water
  • Oven-dry density: includes all pores, excludes inter-particle voids
  • SSD density: includes water-filled pores, excludes inter-particle voids
  • Apparent density: only impermeable portion
  • Absorption: (MSSD​−MOD​)/MOD​×100%
  • Bulk specific gravity (SSD): Gbulk,SSD​=2.4–2.9 (normal-weight)
  • Free moisture: water on aggregate surface above SSD

Concrete maturity

  • Time-Temperature Factor: M=∑(T−T0​)Δt
    • M = maturity index; T = avg. concrete temp; T0​ = datum temp (usually 32∘F)

Concrete exposure categories and classes

  • Freezing/thawing (F0–F3): increasing exposure to cycles, water, deicing chemicals
  • Sulfate (S0–S3): based on sulfate content in soil/water, from negligible to severe
  • Water contact (W0–W2): dry, in contact (low permeability not/required)
  • Corrosion protection (C0–C2): dry/protected, exposed to moisture, or chlorides

Sign up for free to take 6 quiz questions on this topic

Previous
Next  | 5.2 Testing, mix design, and durability
All rights reserved ©2016 - 2026 Achievable, Inc.

Behavior and properties

This chapter covers the following:

  • Material properties of steel reinforcement
  • Tensile testing of reinforcement
  • Plain concrete compressive stress vs. strain behavior
  • General properties of concrete
  • Types of portland cement

Material properties of steel reinforcement

The figure shows a typical stress-strain curve for reinforcing steel in axial tension. You’ll usually describe the curve in these regions:

  • Elastic region: The initial linear portion where Hooke’s law applies.
  • Yield plateau: Stress stays roughly constant while strain increases.
  • Strain hardening: Stress increases again after yielding.
  • Necking and rupture: The final stage where the bar fractures.

Here Es​=29,000 ksi is the elastic modulus of steel. It’s the slope of the initial linear (elastic) portion of the stress-strain curve. For Grade 60 reinforcement, fy​=60 ksi. The yield strain is:

εy​=Es​fy​​=29,000 ksi60 ksi​=0.002

Rupture strain typically falls in this range:

0.1<εrupture​<0.3

Tensile testing of reinforcement

The right-hand diagram shows a typical tensile test setup used to measure elongation in a reinforcing bar.

  • Total bar length: 20 inches
  • Gage length: 2 inches (between displacement gauges)
  • Load: Axial tensile load P applied at both ends
  • Dial gauge: Measures elongation Δ over the 2-inch gage length

The axial stress is:

σa​=fa​=AP​

where:

  • P = applied force
  • A = cross-sectional area of the steel bar

The corresponding strain is:

ε=LΔ​=2′′Δ​

where:

  • Δ = elongation in the 2 inches gage length
  • L=2 inches

Some interesting facts on steel

The resistance of steel to deformation can be increased through alloying and hardening processes. Adding alloying elements improves strength and hardness by altering the steel’s microstructure, while hardening treatments increase resistance to plastic deformation. Hot working generally improves ductility rather than increasing hardness, and tempering mainly reduces brittleness after hardening. Among the common steel microstructures, martensite is the hardest form due to its highly strained crystal structure created during rapid quenching. Ferrite is soft and ductile, pearlite has moderate hardness, and bainite provides a balance between strength and toughness. Corrosion of iron depends on the electrochemical relationship between iron and the coating metal. More electropositive metals such as magnesium, zinc, and aluminum provide sacrificial protection to iron, reducing corrosion. However, a less electropositive or more noble metal like gold can accelerate corrosion of exposed iron through galvanic action if the coating is damaged.

Plain concrete compressive stress vs. strain behavior

The figure shows the compressive stress-strain curve for concrete, typically measured using a standard concrete cylinder (6" diameter × 12" height). In the test, a compressive forceP is applied until the cylinder fails.

  • Diameter: D=6′′
  • Height: h=12′′
  • Gauge length for strain measurement: 8′′

The axial stress is:

fc​=AP​

where:

  • P = axial compressive load
  • A=4π​D2 = cross-sectional area

The axial strain is:

ε=LΔavg​​=8′′Δavg​​

with:

Δavg​=2Δt​+Δb​​

Where:

  • Δt​ and Δb​ = measured deformations at the top and bottom

The curve shape is typically described as:

  • An initial nonlinear region up to around 0.5fc′​
  • A steeper rising portion after that
  • A maximum stress at fc′​ (ultimate compressive strength)
  • A descending branch representing softening or crushing

Common terms on the curve include:

  • fc′​: peak compressive strength of concrete (psi)
  • εc​: strain at fc​=fc′​
  • εu​: ultimate strain (crushing failure)

In design, εu​=0.003. This is the maximum usable concrete strain assumed before crushing.

The modulus of elasticity for concrete is commonly described in two ways.

Tangent modulus of elasticity

  • The slope of the stress-strain curve at a specific point
  • Often taken at the origin to represent initial stiffness:

Et​=dεdfc​​​ε→0​

Secant modulus of elasticity

  • The average slope from the origin to a defined point (often at 0.5fc′​):

Es​=ε0.5​0.5fc′​​

Concrete crushes when:

ε=εu​≈0.003 (in design)

This failure is brittle and sudden, which is why concrete is typically used with steel reinforcement.

General properties of concrete

Compressive strength (fc′​)

  • Obtained from 28-day cylinder tests
  • Normal strength concrete:

fc′​=2000 to 8000psi

  • High-strength concrete:

fc′​=8000 to 25000psi

Tensile strength (ft′​)

Measured by the splitting tensile strength test:

  • Typical value:

ft′​≈0.10fc′​

  • Splitting tensile strength formula:

ft′​=πDL2P​

Where:

  • P = applied load
  • D = diameter
  • L = length of cylinder

Modulus of rupture (fr​)

Used to estimate tensile strength in flexure (for example, in beams):

  • Formula (with fc′​ in psi):

fr​=7.5fc′​​

  • Flexural tensile stress from beam loading:

fb​=SM​

Where:

  • M=6P (for symmetric beam setup)
  • S=6bh2​=66×(6)2​=36in3

Substituting:

fb​=366P​=6P​(psi)

Shear strength (Vc​)

  • Typical range: 16%−25% of fc′​

For normal weight concrete:

Vc​=2fc′​​⋅b⋅d

For lightweight concrete:

vc​=2fc′​​(in psi units)

Unit weight (wc​)

  • Normal reinforced concrete:

wc​≈150pcf

  • Lightweight concrete:

wc​≈120pcf

Modulus of elasticity (Ec​)

Used in serviceability analysis (for example, deflection).

General expression:

Ec​=wc1.5​(33)fc′​​

For normal weight concrete (wc​=145 pcf), a commonly used simplified formula is:

Ec​=57000fc′​​

Slump test: workability of concrete

  • Slump indicates consistency (plasticity)
  • Typical slump values: 1′′ to 4′′

Water-cement (W/C) Ratio

The water-cement ratio is the ratio of water weight to cement weight in a mix.

  • Typical range: 0.40 to 0.60

For full hydration:

W/C ratio=0.25⇒25% water by weight of cement

  • Higher W/C ratio → more workable, less strength
  • Lower W/C ratio → less workability, higher strength

Hydration

  • Chemical reaction between cement and water
  • Produces heat of hydration
  • Critical for early strength and setting

Types of portland cement

Type I: Normal PC - General purpose

Type II: Modified PC - Moderate sulfate resistance, used in hot weather for larger structures (mixed properties of Types IV and V)

Type III: High early strength

Type IV: Low heat - Large structures (dams)

Type V: Sulfate resistant (for concrete in contact with soil or for roadway pavement)

Some interesting facts on cement

Fly ash is a commonly used pozzolanic material in concrete that reacts with calcium hydroxide produced during cement hydration to form additional cementitious compounds, improving strength and durability. It also acts as a microfiller, reducing permeability and enhancing resistance to scaling caused by deicing chemicals when used in appropriate proportions under ASTM C618 requirements. Fly ash does not primarily react with calcium silicate directly.

Key points

Material properties of steel reinforcement

  • Stress-strain curve regions: elastic, yield plateau, strain hardening, necking/rupture
  • Elastic modulus Es​=29,000 ksi; yield strength fy​=60 ksi (Grade 60)
  • Yield strain εy​=0.002; rupture strain 0.1<εrupture​<0.3

Tensile testing of reinforcement

  • Standard bar: 20" length, 2" gage length for elongation measurement
  • Axial stress: σa​=AP​; strain: ε=2′′Δ​
  • Load applied axially; dial gauge measures elongation

Plain concrete compressive stress vs. strain behavior

  • Stress-strain curve: initial nonlinear, steep rise, peak at fc′​, descending branch (softening/crushing)
  • Ultimate compressive strength fc′​; design ultimate strain εu​=0.003
  • Modulus of elasticity: tangent (initial slope), secant (origin to 0.5fc′​)

General properties of concrete

  • Compressive strength fc′​: 2000–8000 psi (normal), up to 25,000 psi (high-strength)
  • Tensile strength ft′​≈0.10fc′​; modulus of rupture fr​=7.5fc′​​
  • Shear strength Vc​=2fc′​​bd; unit weight: normal 150 pcf, lightweight 120 pcf
  • Modulus of elasticity Ec​=57000fc′​​ (normal weight)
  • Slump (workability): 1"–4"; water-cement ratio: 0.40–0.60
  • Hydration: cement + water reaction, produces heat, critical for strength

Types of portland cement

  • Type I: Normal; Type II: Moderate sulfate resistance; Type III: High early strength
  • Type IV: Low heat (large structures); Type V: Sulfate resistant

Concrete strength testing requirements

  • Minimum sampling: once/day, each 150 yd³, or each 5000 ft² (whichever governs)
  • No test required if <50 yd³ and approved evidence of strength
  • Strength test: average of 2 (6"x12") or 3 (4"x8") cylinders, tested at 28 days
  • Acceptance: 3-test average ≥fc′​; no single test <fc′​−500 psi (if fc′​≤5000 psi) or <0.9fc′​ (if fc′​>5000 psi)
  • Field-cured cylinders: must be ≥85% of lab-cured, unless field-cured >fc′​+500 psi
  • Core tests: average of 3 cores ≥0.85fc′​; no single core <0.75fc′​

Concrete mix design parameters

  • Yield: total mass of materials / density of fresh concrete
  • Absolute volume: mass / (specific gravity × density of water)
  • Aggregate moisture: SSD condition used; free moisture = total – absorbed moisture
  • Water-cement ratio w/c=mass of cementitious materialsmass of water​

Aggregate properties in concrete mix design

  • SSD: pores filled, no surface water
  • Oven-dry density: includes all pores, excludes inter-particle voids
  • SSD density: includes water-filled pores, excludes inter-particle voids
  • Apparent density: only impermeable portion
  • Absorption: (MSSD​−MOD​)/MOD​×100%
  • Bulk specific gravity (SSD): Gbulk,SSD​=2.4–2.9 (normal-weight)
  • Free moisture: water on aggregate surface above SSD

Concrete maturity

  • Time-Temperature Factor: M=∑(T−T0​)Δt
    • M = maturity index; T = avg. concrete temp; T0​ = datum temp (usually 32∘F)

Concrete exposure categories and classes

  • Freezing/thawing (F0–F3): increasing exposure to cycles, water, deicing chemicals
  • Sulfate (S0–S3): based on sulfate content in soil/water, from negligible to severe
  • Water contact (W0–W2): dry, in contact (low permeability not/required)
  • Corrosion protection (C0–C2): dry/protected, exposed to moisture, or chlorides

More from Materials

  • Testing, mix design, and durability