



Economic growth
Inflation
Inflation is one of the key measures of how an economy is performing, as it affects both businesses and consumers.
To understand this more clearly, it helps to compare inflation with situations where prices increase for valid reasons.
Example:
If you buy a laptop for with of storage, upgrade it to , and then sell it for , that price increase isn’t inflation. The product is more valuable because it has better features. But if the same laptop (with no upgrades or improvements) costs this year and next year, that price increase is inflation.
Inflation is never good for an economy due to the following effects:
- It reduces the business confidence in an economy
- It reduces the buying power of the consumers
- Reduces the demand of goods and services
- It makes exports expensive
Unemployment
Unemployment is another key indicator of economic health, as it shows how well an economy is creating jobs for its population.
Example:
In South Africa, unemployed individuals who qualify for benefits may receive income through government grants. In the 2022–2023 financial year, according to Statistics South Africa, the government spent over 1.12 trillion rand, which is approximately USD.
Unemployment is never good for an economy due to the following effects:
- It affects the demand of goods and services
- It leads to social effects e.g. crime, violence, vandalism, riots and more
- It’s costly for the government because they will have to spend more to support the unemployed
Economic growth
Economic growth is a broad topic that includes many factors. A useful starting point is to look at trade cycles.
Trade cycles
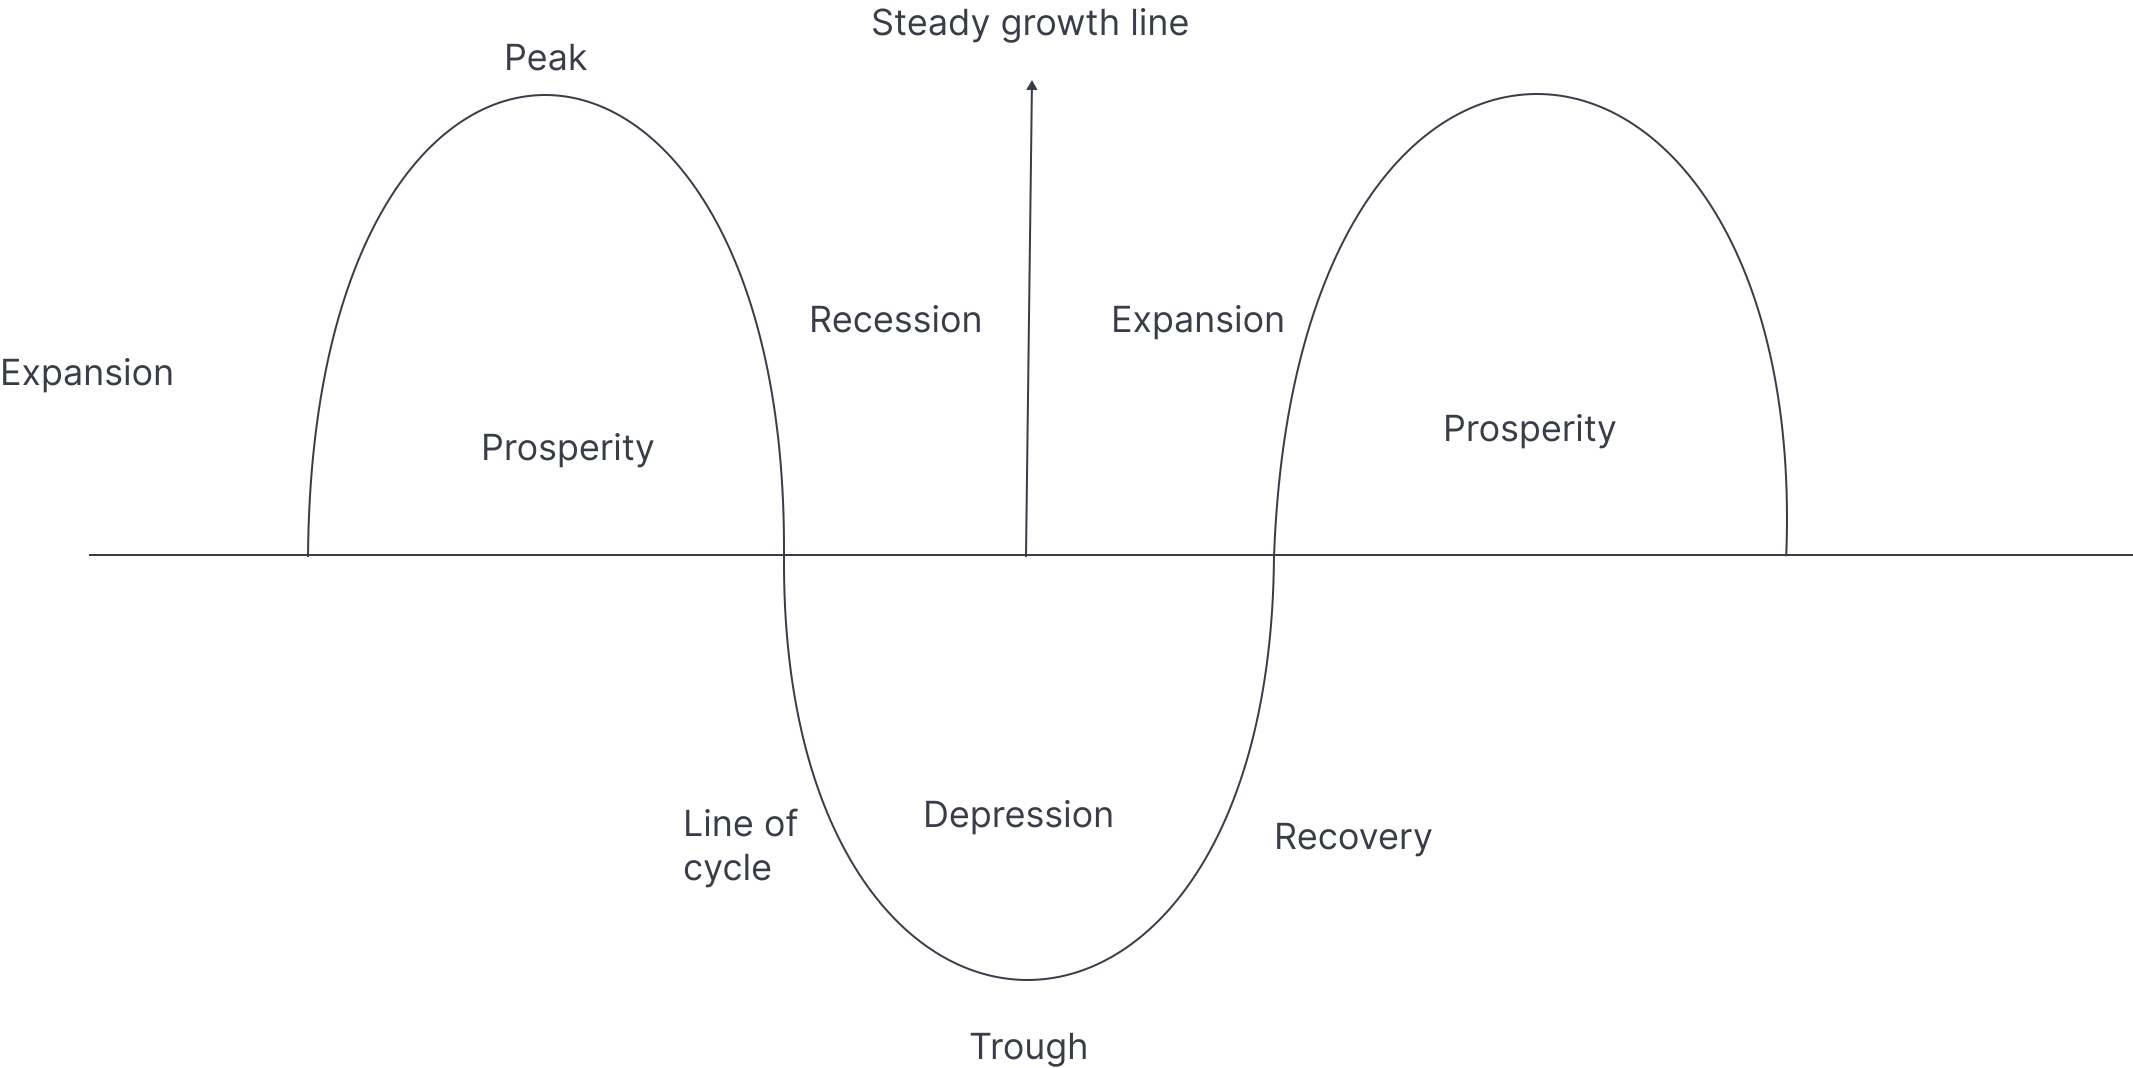
Economies usually aim to grow gradually, but growth rarely follows a perfectly straight line. Instead, the economy tends to fluctuate up and down over time, even when the overall direction is upward, downward, or flat.
The trend graph above shows that the economy is neither increasing nor decreasing, so the trend is flat. You can see this because the trend line lies horizontally.
Trend
A trend line is used to show the overall direction of the economy over time. Even though the economy moves up and down in cycles, the trend helps you see whether it is generally growing, shrinking, or staying the same.
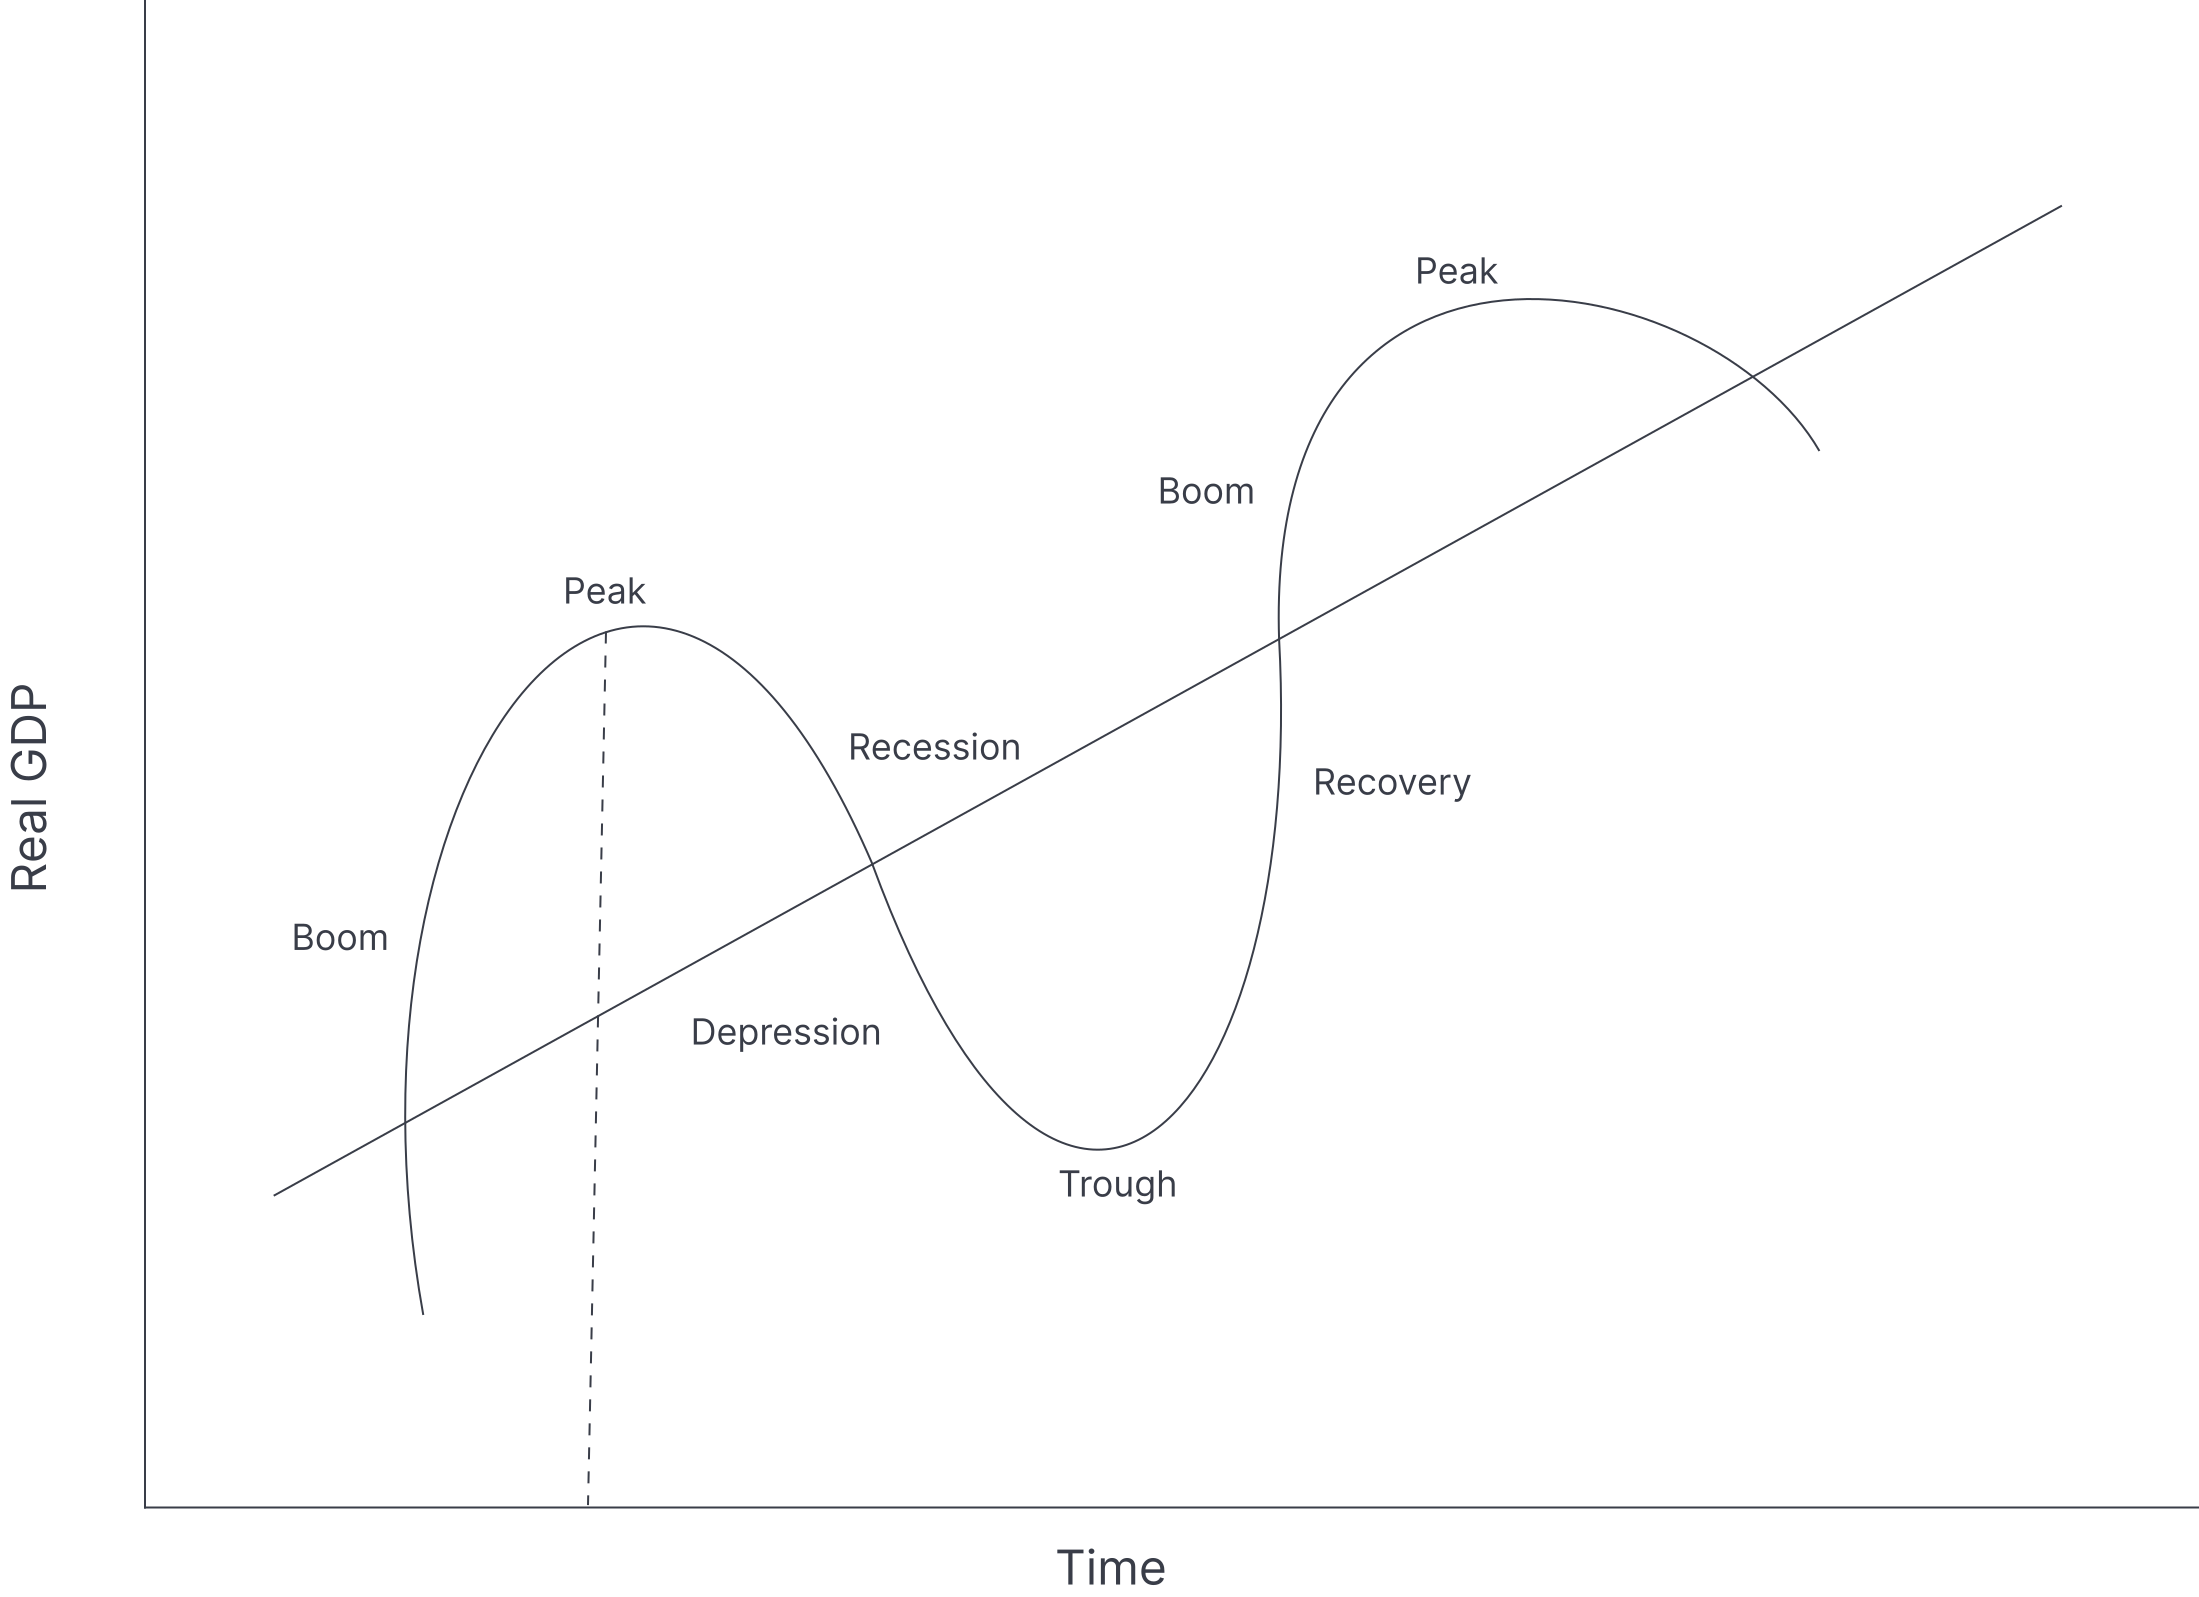
A trend line can also look like this:
The representation of phases of a business cycle graph (above) shows a trend line that slopes gently upward, which indicates that the economy is growing.
Trade cycle stages
Keep in mind the 5 stages of a trade cycle we mentioned. They happen around the trend line, with some stages above it and some below it, as shown in the graphs.