Graphs & tables
In addition to finding functions that model an object’s movement, you may be asked to analyze motion from graphs or tables of its position or velocity.
Position graph
When given a position graph, observe the slope of the tangent line at a point, which represents the instantaneous velocity.
- Increasing graph , and the object is moving right/forward/up.
- Decreasing graph , and the object is moving left/backward/down.
- Horizontal tangents or line segments , and the object is at rest.
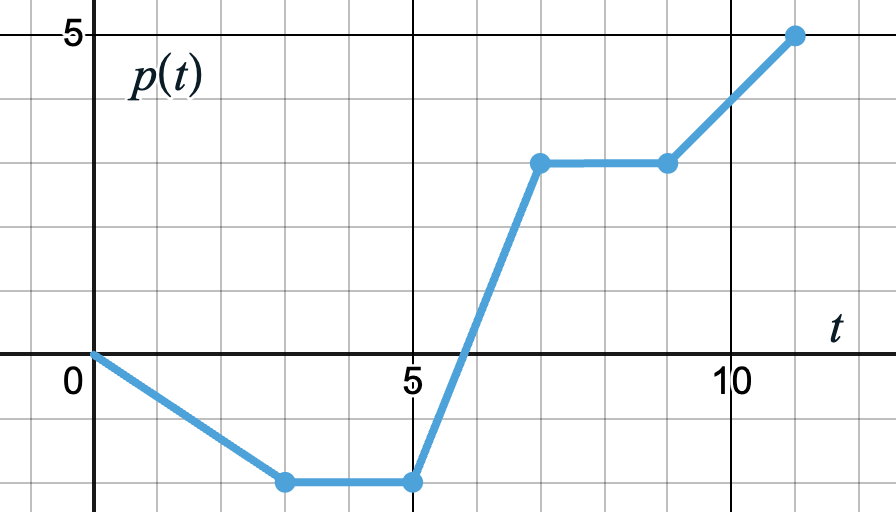
A particle moves along the -axis with its position plotted as a function of time (in seconds).
a) What is the average velocity of the particle from to seconds?
b) At what time(s) is the particle at rest?
c) At what time is it moving to the left and when is it moving to the right?
Solutions
a) What is the average velocity of the particle from to seconds?
Average velocity is change in position divided by change in time:
From the graph, . To find , use the fact that the first piece is a straight line between and . The line through these points is
So , and the average velocity over is
b) At what time(s) is the particle at rest?
A particle is at rest when its velocity is zero. On a position graph, that means the slope is zero, so look for horizontal line segments. These occur over the intervals and .
c) At what time is it moving to the left and when is it moving to the right?
The particle moves left when and right when . On a position graph, look at the sign of the slope on each piece of the graph.
Here is a sign chart for , with each interval matching a piece of the position graph:
| Interval | Sign of |
|---|---|
From the sign chart, the particle’s movement is as follows:
- It moves left on the interval
- It is at rest on
- Moves right on
- At rest again on
- Continues moving right on
Velocity graph
For a velocity graph, the slope of the tangent line at a point represents the instantaneous acceleration.
- Check whether the graph is above or below the -axis to determine the sign of .
- Combine the sign of with the sign of to determine whether the object is speeding up or slowing down over a time interval.
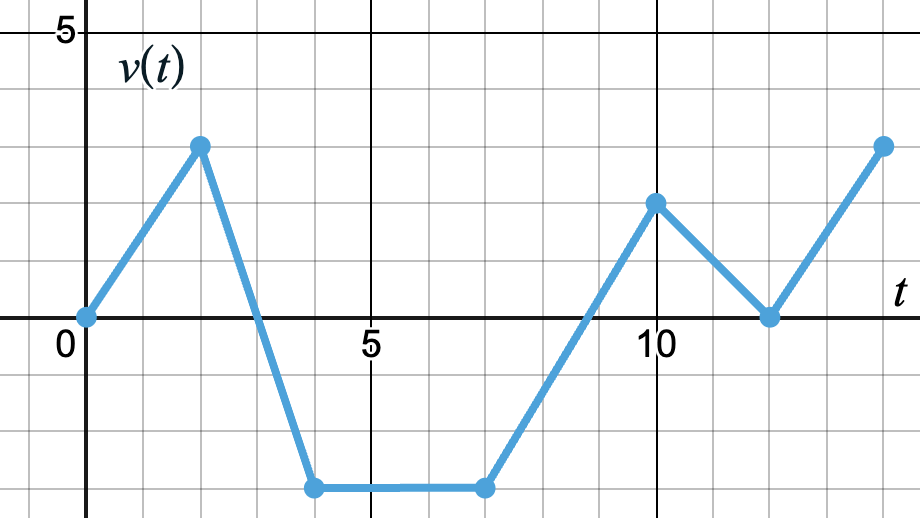
The velocity of a particle moving along the -axis, in meters per minute, is displayed in the graph below.
a) At what time(s) does the particle change direction?
b) On what interval(s) of time is it moving at constant speed?
c) On what intervals of time is it speeding up and when is it slowing down?
d) What is the particle’s maximum speed, and at what time(s) does this occur?
Solutions
a) At what time(s) does the particle change direction?
Look for where changes sign (from positive to negative or vice versa).
On a velocity graph, the sign comes from whether the graph is above or below the -axis. A sign change happens at a -intercept.
The first -intercept is at .
The second one is on the line that passes through and . The equation of the line between those two points is
So the -intercept occurs at minutes.
The third -intercept is at .
The sign chart below separates intervals based on these -intercepts.
| Interval | Sign of |
|---|---|
changes sign (so the particle changes direction) at and minutes only.
b) On what interval(s) of time is it moving at constant speed?
Look for when the velocity is constant (so the graph is horizontal and stays at the same value). On a velocity graph, that means the slope is zero.
This occurs on the interval . Over that time, the velocity is meters/minute, meaning the particle moves left at a constant speed of meters per minute.
c) On what intervals of time is it speeding up and when is it slowing down?
A particle speeds up when velocity and acceleration have the same sign, and it slows down when they have opposite signs.
- The sign of velocity comes from whether is above or below the -axis.
- The sign of acceleration comes from the slope of the velocity graph
- Positive slope
- Negative slope
- Horizontal line
Here’s a sign chart for velocity and acceleration, with intervals separated according to line segments and -intercepts.
| Interval | Sign of | Sign of |
|---|---|---|
Thus, the particle is:
Speeding up on the intervals
Slowing down on the intervals
d) What is the particle’s maximum speed, and at what time(s) does this occur?
Speed is , the distance from the velocity graph to the -axis.
The particle hits a maximum speed of meters/minute. This happens at several times: once at minutes, throughout the interval from to minutes (moving left at constant speed), and again at minutes.
Using tables
- A particle’s position along the -axis is tracked at specific points in time and recorded in the following table:
Time (seconds) Position (meters) a) What is the average velocity from to seconds?
b) Based on the data in the table, during which interval must the particle change direction? Justify your answer using the average velocity.
Solutions
a) Average velocity over
b) Based on the data in the table, during which interval must the particle change direction? Justify your answer using the average velocity.
A particle changes direction when changes sign. From a position table, you can estimate this by looking for where the position switches from increasing to decreasing (or vice versa).
Looking at the table values:
- From to , the position increases (), with a positive average velocity.
- From to , the position decreases (), with a negative average velocity.
So the particle must have changed direction between and seconds.
- A particle moves along the -axis so that its velocity at time seconds is given by a differentiable function . At selected points in time, the velocity of the particle, measured in meters per second, is recorded in the table below:
Time Velocity (m/s) a) Estimate the instantaneous acceleration at seconds.
b) During which interval must the particle change direction? Justify your answer.
Solutions
a) Instantaneous acceleration at seconds
Without a function, the best estimate for is the average rate of change between the nearby data points and .
b) During which interval must the particle change direction?
A particle changes direction when its velocity changes sign, which means the velocity must be at some time.
is differentiable which implies it’s continuous.
Since the is positive and is negative, the Intermediate value theorem guarantees a time in when . So the particle must have changed direction sometime between and seconds.