Pressure
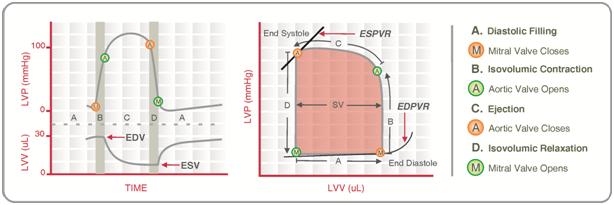
Ventricular pressure-volume loops: In a ventricular pressure-volume loop, ventricular pressure is plotted against ventricular volume. This loop summarizes overall ventricular function during one cardiac cycle.
There are four key points on the curve (1, 2, 3, and 4). Each point corresponds to a valve opening or closing:
Point 1: Closing of the mitral valve
Point 2: Opening of the aortic valve
Point 3: Closing of the aortic valve
Point 4: Opening of the mitral valve
Systole extends from point 1 to point 3, while diastole extends from point 3 to point 1.
Four phases of ventricular activity are shown on the pressure-volume loop (these correspond to the cardiac cycle):
Isovolumetric contraction: Extends from point 1 to point 2 (from mitral valve closure to aortic valve opening).
Ejection: Extends from point 2 to point 3 (from aortic valve opening to aortic valve closure).
Isovolumetric relaxation: Extends from point 3 to point 4 (from aortic valve closure to mitral valve opening).
Ventricular filling: Extends from point 4 to point 1 (from mitral valve opening to mitral valve closure).
The volume at point 1 corresponds to the EDV. The volume at points 3 and 4 (these volumes are the same) corresponds to the ESV.
Stroke volume (SV) is calculated as:
- SV = EDV − ESV
On the loop, SV corresponds to the width of the loop. When SV decreases, the loop becomes narrower.
The peak systolic pressure (PSP) is reached during ejection and is located at the apex of the loop. When afterload on the left ventricle increases (e.g., systemic hypertension), PSP increases and the loop becomes taller.
Factors affecting the pressure-volume loop: The following factors change the shape (morphology) of the pressure-volume loop.
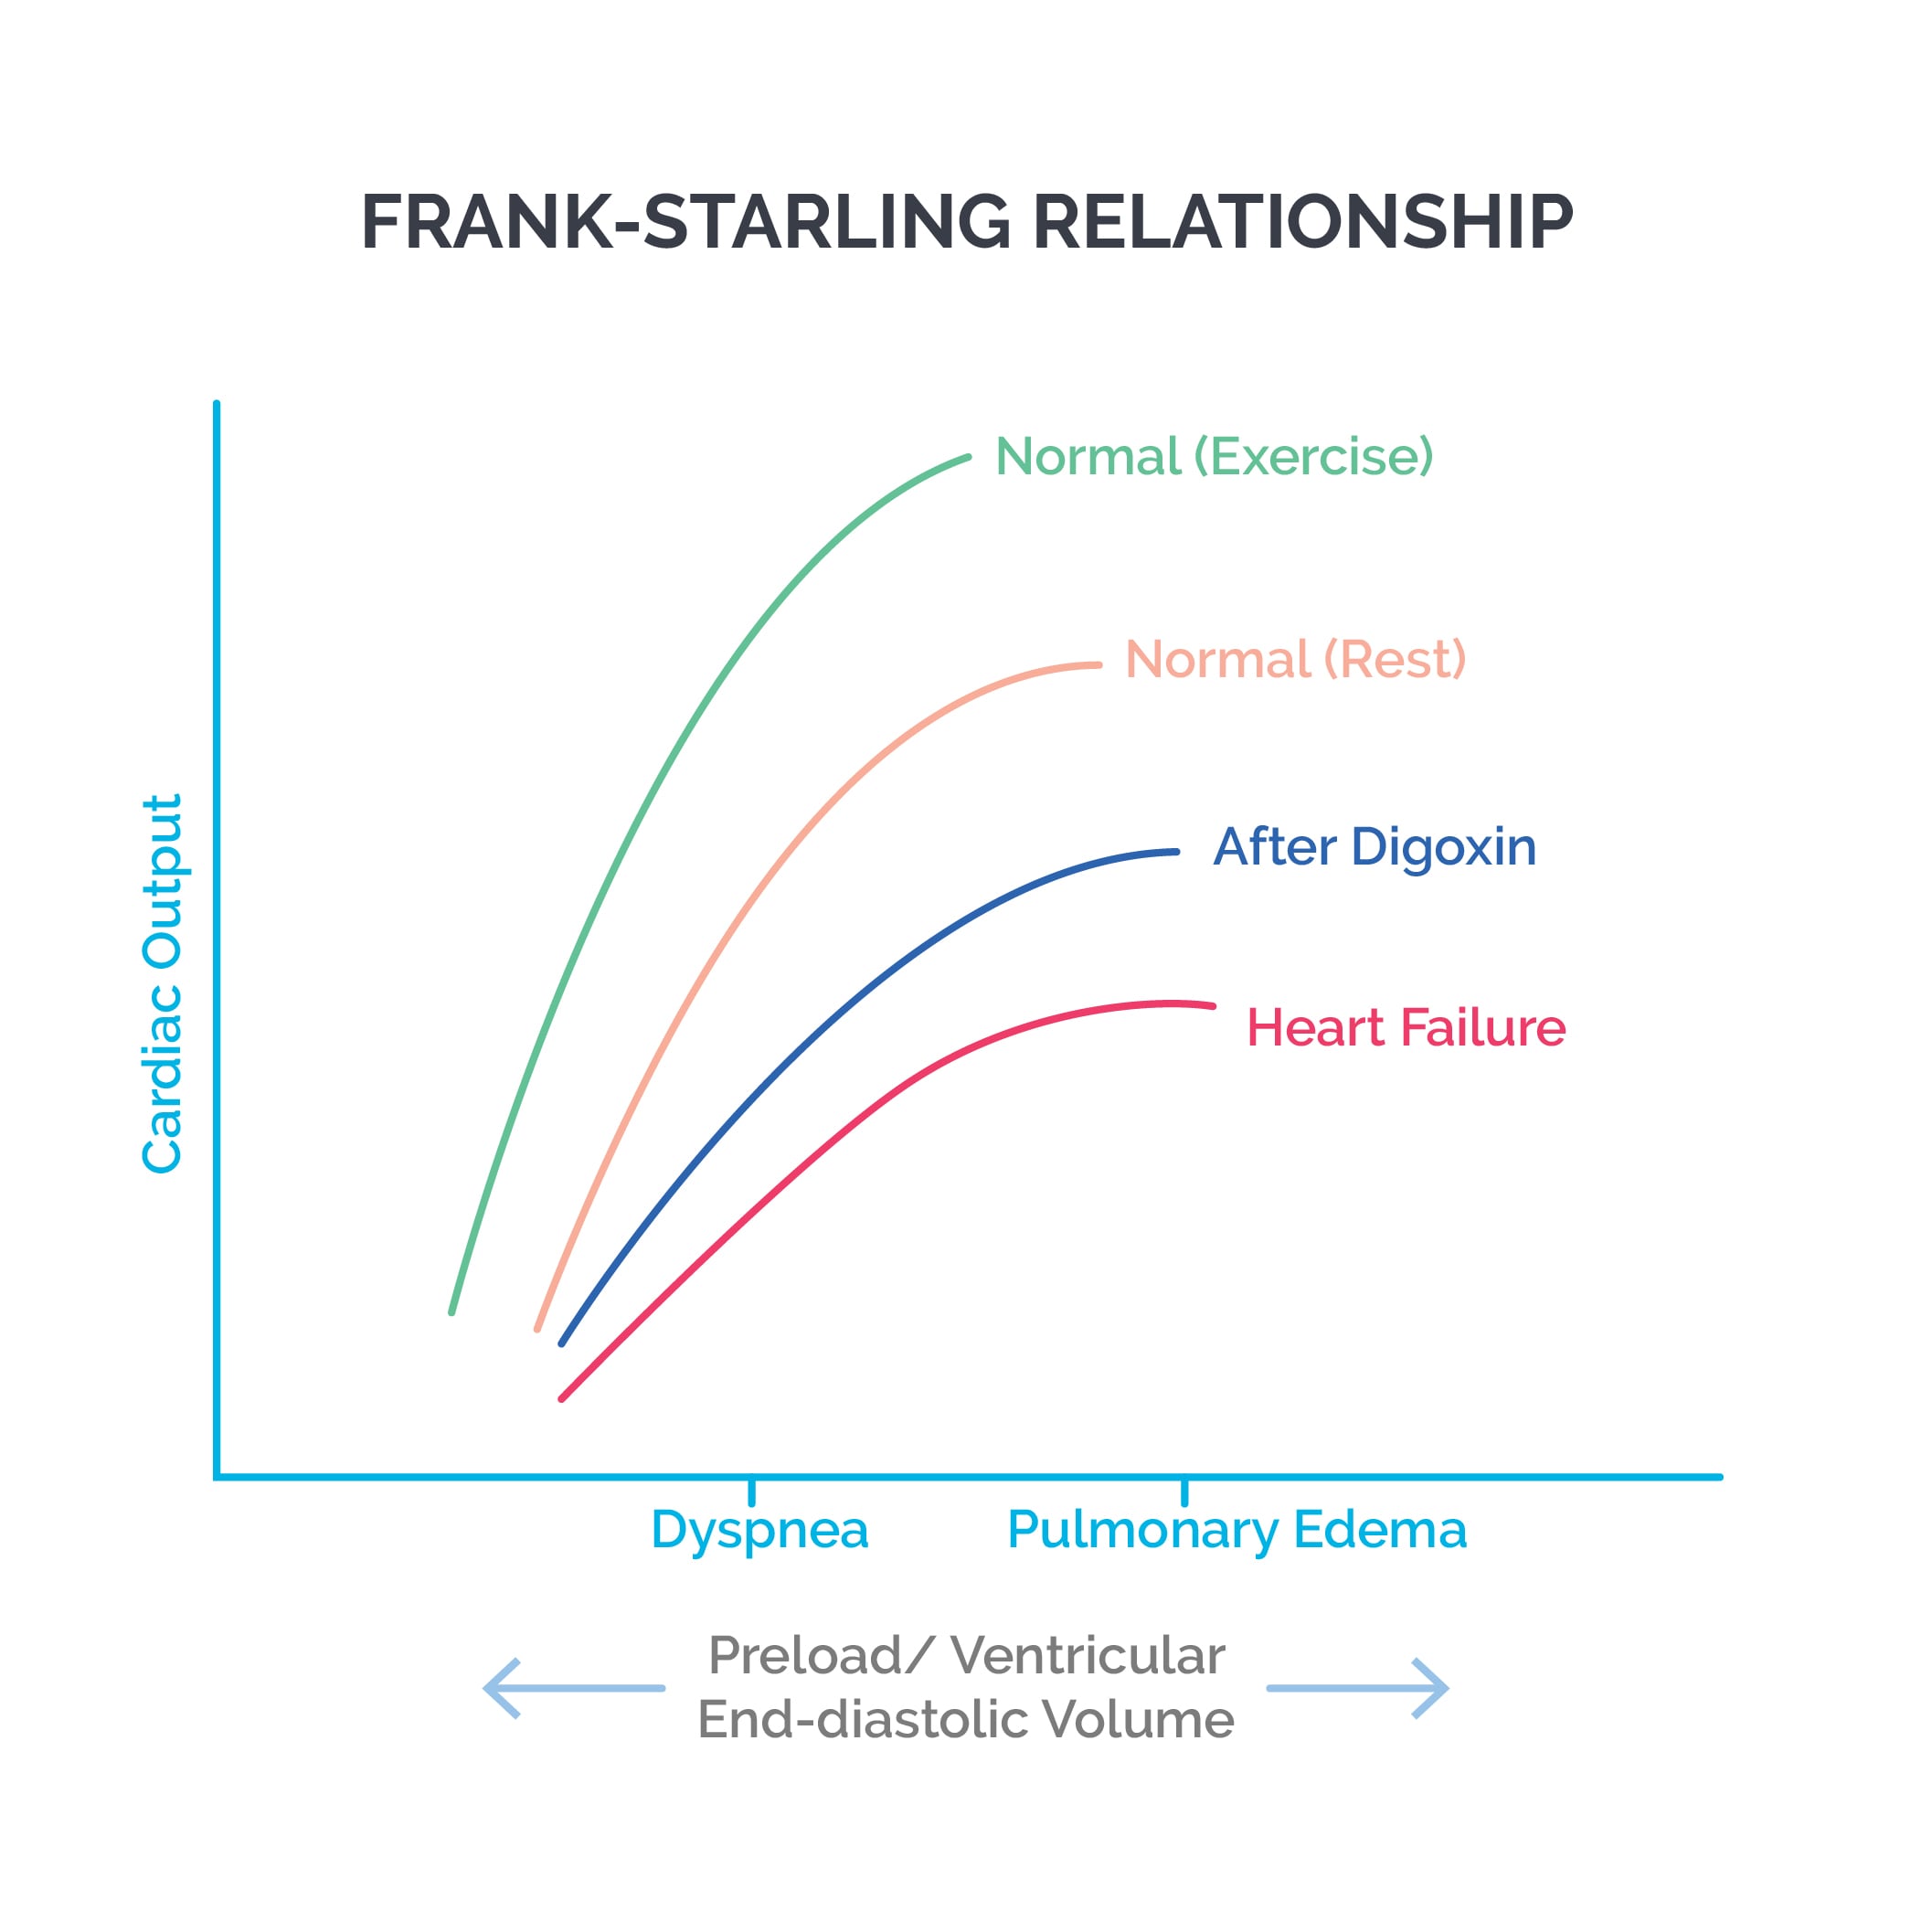
- Changes in preload: Preload corresponds to venous return. Increasing preload increases EDV, which increases SV and EF via the Frank-Starling mechanism. The loop shifts to the right. Decreasing preload produces the opposite effects.
- Changes in afterload: Afterload corresponds to aortic pressure. Increasing afterload raises PSP and reduces SV and EF. The loop becomes taller and narrower. ESV increases because less blood is ejected. Decreasing afterload produces the opposite effects.
- Changes in contractility: Increased contractility (positive inotropy), for example with digoxin treatment, increases SV and PSP and decreases ESV. The loop becomes wider and slightly taller and shifts to the left. EF increases. Decreased inotropy produces the opposite effects.
- Changes in exercise: Exercise is accompanied by increased preload, increased afterload (as systolic pressure rises), and increased contractility. EDV increases while ESV decreases; EF and PSP increase. The loop becomes wider and taller.
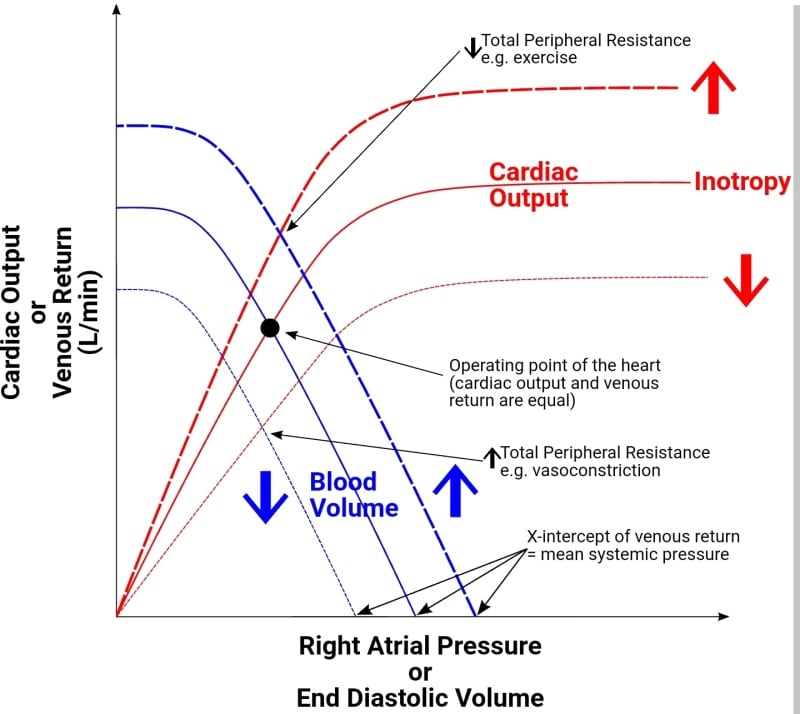
Cardiac and vascular function curves: A cardiac function curve plots right atrial pressure on the X axis and cardiac output on the Y axis. As right atrial pressure rises with increasing venous return, cardiac output rises proportionately.
The cardiac function curve shifts inferiorly and to the right when cardiac performance is depressed (e.g., decreased heart rate, decreased contractility, increased afterload). It shifts up and to the left when cardiac performance improves (e.g., increased heart rate, increased contractility/positive inotropy, decreased afterload).
A vascular function curve plots right atrial pressure on the X axis and venous return on the Y axis. When right atrial pressure becomes too negative, veins collapse, which limits venous return.
The point where the vascular function curve meets the X axis corresponds to the mean systemic pressure. This is the pressure that would be measured in the cardiovascular system if the heart were stopped.
- Increased blood volume or decreased venous compliance (e.g., venoconstriction) shifts the curve to the right.
- Decreased blood volume or venodilation produces the opposite shift.
- Increased systemic vascular resistance (SVR) decreases the slope of the curve; decreased SVR increases the slope.
- With sympathetic stimulation, both SVR and venoconstriction increase, so the curve shifts to the right and the slope decreases.
When cardiac and vascular function curves are plotted on the same graph, they intersect at a point that represents:
- Cardiac output (Y axis)
- Right atrial pressure (X axis)
Some factors affect only the cardiac function curve, others affect only the vascular function curve, and some affect both.
Changes in total peripheral resistance (TPR) affect both curves. Increased TPR (from arteriolar constriction) increases afterload and reduces venous return, causing both the cardiac and vascular function curves to shift downward. Decreased TPR shifts both curves upward due to decreased afterload and increased venous return.