Cardiac action potential
Cardiac tissues show two main types of action potentials, based on their function.
- Atria, ventricles, and Purkinje fibres have action potentials with fast depolarization and a plateau phase.
- Pacemaker cells in the SA node and AV node have action potentials with a slower depolarization rate and no plateau phase.
The resting membrane potential of cardiac cells is determined mainly by potassium ions. The atria, ventricles, and Purkinje fibres have a resting membrane potential of about -85 mV, while SA node cells begin depolarizing when they reach a membrane potential of about -65 mV.
-
Action potential of the atria, ventricles, and Purkinje cells: This action potential has 5 phases (0 to 4), a long refractory period, a stable resting membrane potential, and a plateau phase.
-
Phase 0 (rapid depolarization/upstroke): Caused by opening of the activation gates of fast sodium channels, leading to sodium influx. Depolarization also causes the slow inactivation gate of the sodium channel to close.
-
Phase 1 (initial repolarization): Due to two changes:
- Inactivation gates of fast sodium channels close, reducing sodium influx.
- Potassium channels open, causing potassium efflux.
-
Phase 2 (plateau phase): Caused by a balance of currents:
- L-type (long-lasting) calcium channels open, producing a slow calcium influx.
- Potassium efflux continues through open potassium channels.
This phase is critical because calcium influx triggers calcium-induced calcium release from the sarcoplasmic reticulum. This drives excitation-contraction coupling and myocardial contraction (i.e., systole).
-
Phase 3 (repolarization): Occurs because:
- Calcium influx decreases compared with phase 2.
- Potassium efflux increases, bringing the membrane potential back down.
-
Phase 4 (resting membrane potential): The cell returns to its stable resting membrane potential mainly due to potassium efflux, while fast sodium channels and L-type calcium channels are closed.
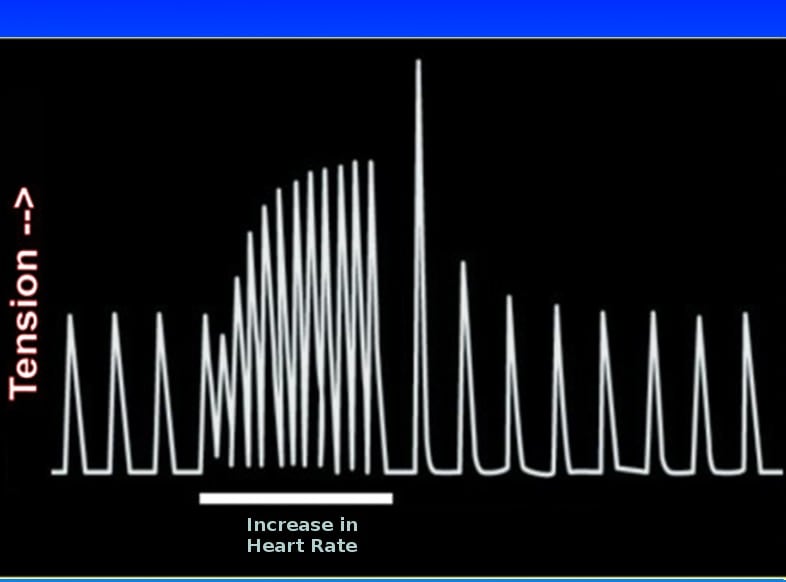
Bowditch effect: Also called the Treppe or staircase effect. This describes an increase in the force of contraction as heart rate increases, due to increased intracellular calcium.
At higher heart rates, the Na/K ATPase can’t keep up with the sodium influx that occurs with each action potential. This indirectly inhibits the Na/Ca exchanger, which increases intracellular calcium. More intracellular calcium also means more calcium is sequestered in the sarcoplasmic reticulum, so more calcium is released into the cytosol with each successive excitation-contraction cycle. The result is increased inotropy (force of contraction).
A failing heart does not show the Bowditch phenomenon. Instead, it shows a reverse Bowditch or negative staircase effect. Failing hearts can’t keep up with increasing circulatory and ATP requirements at rising heart rates, which negatively affects actin-myosin cross-bridge formation. SERCA malfunction is also associated with failing hearts and results in reduced intracellular calcium levels.
-
Post-extrasystolic potentiation (PESP): An extrasystole causes more calcium to be released into the cardiac cell, which increases the force of the next contraction. An enhanced PESP (measured as post-extrasystolic blood pressure potentiation) is an independent predictor of mortality in survivors of AMI and in chronic heart failure patients.
-
Action potential of the SA node: The SA node is the pacemaker of the heart. It has the shortest refractory period, an unstable resting membrane potential, and an action potential with 3 phases. It has no plateau (phase 2) and no phase 1.
The SA node also exhibits automaticity, meaning it can spontaneously generate action potentials.
-
Phase 0 (depolarization): Slower than in ventricular tissue because it is not caused by fast sodium channels. Instead, it is caused by calcium influx through L-type calcium channels.
-
Phase 3 (repolarization): Caused by opening of potassium channels, leading to potassium efflux.
-
Phase 4 (pacemaker potential/spontaneous depolarization): A slow upstroke caused by opening of slow sodium channels, producing an influx of sodium called the “funny current.” The rate (slope) of phase 4 directly correlates with heart rate.
AV node action potentials resemble those of the SA node, but the SA node sets the heart rate because it has the fastest phase 4 depolarization. Other conducting tissues can take over when the SA node is not functioning (e.g., in sick sinus syndrome, ischemia, etc.).
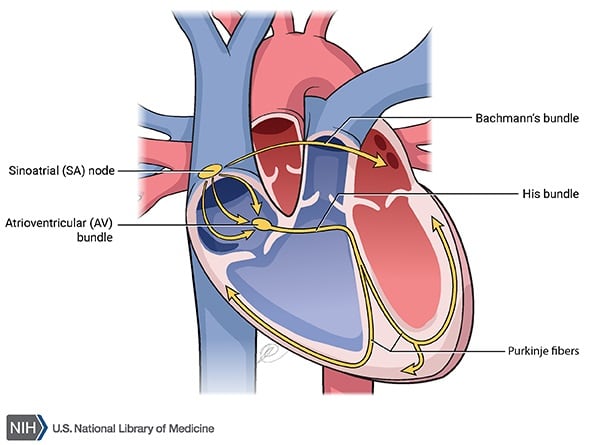
Conduction in cardiac tissues: Action potentials generated by the SA node are first conducted across the atria. The AV node transmits impulses from the atria to the ventricles. Conduction slows at the AV node, allowing ventricular filling. From the AV node, the impulse travels through the Bundle of His, then the right and left bundle branches, and finally into the Purkinje fibres, which distribute the impulse throughout the ventricles. Purkinje fibres are the fastest conducting tissue, while the AV node is the slowest.
-
The velocity of cardiac conduction depends on phase 0 of the action potential (the rate of tissue depolarization). Faster conduction corresponds to a steeper slope of phase 0 depolarization, while slower conduction corresponds to a less steep slope.
Sodium channel blockers decrease conduction velocity by blocking the fast sodium channels responsible for phase 0 depolarization.
Chronotropy refers to heart rate, while dromotropy refers to conduction velocity. Sympathetic activation has positive chronotropic and positive dromotropic effects because it increases both heart rate and conduction velocity. Parasympathetic activation has negative chronotropic and negative dromotropic effects.
Effects of autonomic system on the heart
| Sympathetic | Parasympathetic | |
| Heart rate | Increase | Decrease |
| Conduction velocity | Increase | Decrease |
| Slope of phase 0 | Increase | Decrease |
| PR interval | Decrease | Increase |
| cAMP | Increase | Decrease |
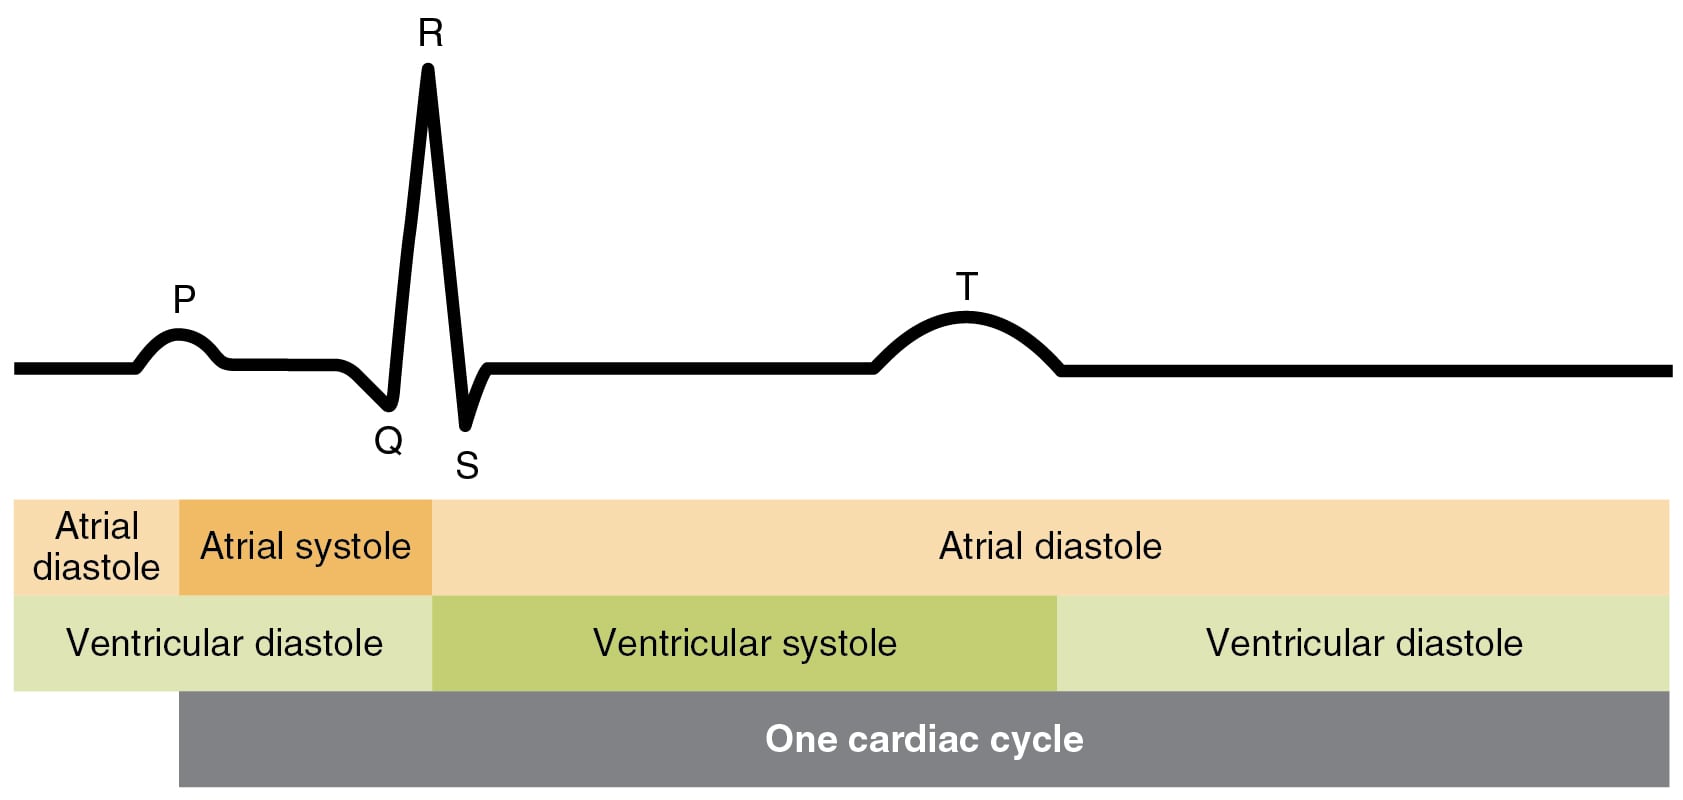
ECG: Also called an EKG or electrocardiogram. An ECG measures the electrical activity of the heart. The following waves and segments are seen in a normal ECG:
-
P wave: It represents atrial depolarization.
-
PR interval: It starts at the onset of the P wave and ends at the beginning of the QRS complex. Normally, it should be less than 0.20 seconds (200 milliseconds). It represents the time between the beginning of atrial depolarization and the beginning of ventricular depolarization.
The isoelectric segment between the end of the P wave and the beginning of the QRS complex is called the PR segment. It represents the time taken for conduction through the AV node.
-
QRS complex: It represents the time taken for ventricular depolarization.
-
ST segment: An isoelectric segment between the end of the QRS wave and the beginning of the T wave. It corresponds to the plateau phase of the action potential.
-
T wave: It represents ventricular repolarization.
-
QT interval: It corresponds to ventricular depolarization and repolarization. It includes the QRS, ST segment, and the T wave. The QT interval is shorter at faster heart rates and longer at slower heart rates.