Put spreads
We’ll focus on put spreads in this chapter. As a reminder, a put spread is:
Long put & short put
Like call spreads, most math-based spread questions focus on vertical (price) spreads, where both contracts have the same expiration but different strike prices. For example:
Short 1 ABC Jan 40 put
Long 1 ABC Jan 50 put
You’ll use the same four-step system from the call spreads chapter to answer maximum gain, maximum loss, and breakeven questions. This system only works for spreads, so correctly identifying the strategy matters.
Let’s walk through the spread system using this example:
Short 1 ABC Jan 40 put @ $5
Long 1 ABC Jan 50 put @ $11
Step 1: Net the premiums
The investor sold the short put for $5 and bought the long put for $11. That creates a net debit (purchase) of $6, or $600 total ($6 × 100 shares).
This step tells you whether the position’s maximum outcome is a gain or a loss:
- Net debit = maximum loss
- Net credit = maximum gain
Because the investor has a net debit of $600, the maximum loss is $600.
Step 2: Net the strike prices
This step doesn’t give a final answer by itself, but you’ll use it to find the remaining values.
Short 1 ABC Jan 40 put @ $5
Long 1 ABC Jan 50 put @ $11
The difference between the strike prices ($40 and $50) is $10.
Step 3: Net strikes - net premium
Take the strike difference ($10) and subtract the net premium ($6):
$10 − $6 = $4
That $4 is the “other max.” Since step 1 gave us the maximum loss, step 3 gives us the maximum gain:
$4 × 100 = $400
If step 1 gives the maximum loss, step 3 gives the maximum gain. If step 1 gives the maximum gain, step 3 gives the maximum loss.
Step 4: Strike price +/- net premium
Now return to the original net premium from step 1 (a $6 debit) to find breakeven.
Use the rule that matches the spread type:
- Call spreads = add the net premium to the low strike
- Put spreads = subtract the net premium from the high strike
Short 1 ABC Jan 40 put @ $5
Long 1 ABC Jan 50 put @ $11
This is a put spread, so:
$50 − $6 = $44 breakeven
The options payoff chart summarizes the “big picture” of this long put spread. Here’s the strategy again:
Short 1 ABC Jan 40 put @ $5
Long 1 ABC Jan 50 put @ $11
Here’s the payoff chart:
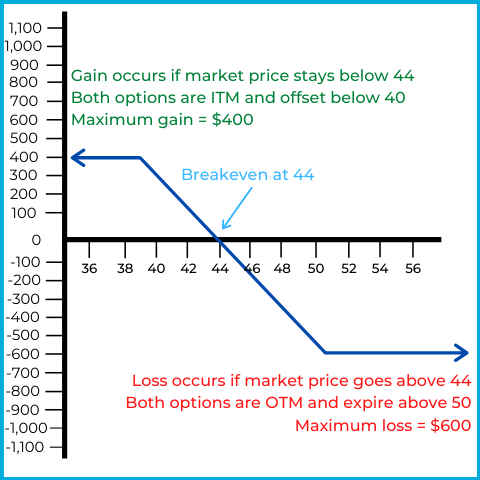
The horizontal axis represents the market price of ABC stock, while the vertical axis represents overall gain or loss.
- Maximum gain = $400
- Maximum loss = $600
- Breakeven = $44
- Option names = Long/bear/debit put spread
This investor is bearish, but they’ve capped their profit potential. Here’s how the position behaves at different stock prices:
If ABC’s market price stays above $50
Both puts are out of the money and expire worthless. The investor loses the original net debit, which is also the maximum loss: $600.
If ABC’s market price goes below $50, but stays above $40
The long $50 put becomes in the money and gains intrinsic value. At $44, it has $6 of intrinsic value ($50 − $44), which offsets the $6 net debit, so the position is at breakeven.
Below $44, the investor profits as the long put gains more intrinsic value. The short $40 put remains out of the money as long as the stock stays above $40.
If ABC’s market price goes below $40
Both puts are in the money and begin offsetting each other. For every $1 the long put gains as the stock falls, the short put loses $1.
The position reaches maximum gain at $40, and gains below $40 are offset.
What was the investor’s intent?
They were bearish on ABC but thought the long put’s premium ($1,100) was too expensive. Selling the $40 put for $500 reduces the net debit to $600.
The trade-off is that the short put creates a “floor” at $40: no matter how far the stock falls, gains below $40 are offset by losses on the short put.
Let’s see if you can work through an example on your own:
An investor goes long 1 XYZ Dec 30 put at $2 and short 1 XYZ Dec 45 put at $10. Answer the following:
Maximum loss?
Maximum gain?
Breakeven?
Names of the spread?
- Maximum loss = $700
- Maximum gain = $800
- Breakeven = $37
- Names of the spread = Short/bull/credit spread
This is how you can determine the answers:
Step 1: Net the premiums
Bought at $2 and sold at $10, creating a net credit of $8. Therefore, the maximum gain is $800.
Step 2: Net the strike prices
The difference between $30 and $45 is $15.
Step 3: Net strikes - net premium
$15 (net strikes) − $8 (net premium) = $7. This represents the “other max” not found in step 1. Since step 1 gave the maximum gain, step 3 gives the maximum loss: $700.
Step 4: Strike price +/- net premium
This is a put spread, so subtract the $8 net premium from the $45 high strike price:
$45 − $8 = $37 breakeven.
Naming the spread
You can name this spread using two quick checks:
- The short put has the higher premium, so it’s the dominant leg.
- On a vertical put spread, the higher strike is the dominant leg, and here the higher strike ($45) is short.
With the short put as the dominant leg, this is a:
- Short put spread
- Bull put spread
- Credit put spread
The options payoff chart summarizes the “big picture” of this short put spread. Here’s the strategy again:
Long 1 XYZ Dec 30 put @ $2
Short 1 XYZ Dec 45 put @ $10
Here’s the payoff chart:
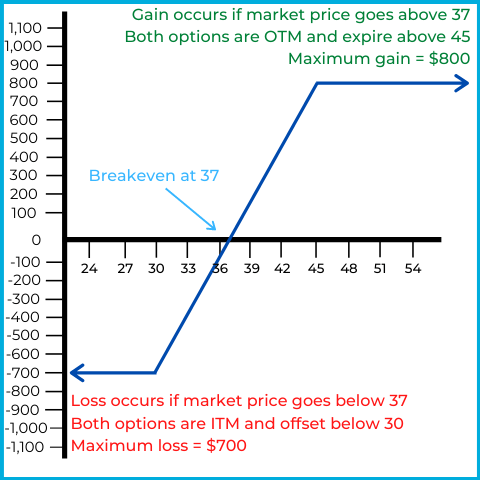
The horizontal axis represents the market price of ABC stock, while the vertical axis represents overall gain or loss.
- Maximum loss= $700
- Maximum gain = $800
- Breakeven = $37
- Option names = Short/bull/credit put spread
If XYZ’s market stays above $45
Both puts are out of the money and expire worthless. The investor keeps the original net credit, which is also the maximum gain: $800.
This is why it’s a bull put spread: the investor prefers the stock to stay up so both options expire.
If XYZ’s market price goes below $45, but stays above $30
The short $45 put becomes in the money and gains intrinsic value, which hurts a short option position. At $37, the short put has $8 of intrinsic value ($45 − $37), which offsets the $8 net credit and produces breakeven.
Below $37, the position loses money because the short put’s intrinsic value exceeds the credit received. The long $30 put remains out of the money as long as the stock stays above $30.
If XYZ’s market price goes below $30
Both puts are in the money and begin offsetting each other. For every $1 the short put loses as the stock falls, the long put gains $1. The long put caps the downside.
What was the investor’s intent?
They were bullish on XYZ but wanted protection if the stock fell. Buying the $30 put reduces the net credit to $800 (from $1,000).
The investor collects less premium, but the maximum loss is capped if the stock falls below $30.
Math-based spread questions on the exam usually ask for maximum gain, maximum loss, or breakeven. You may also see questions that test spread mechanics more generally. For example:
An investor goes long 1 CBA Sep 70 put at $15 and short 1 CBA Sep 50 put at $4 when the market price is $60. The market goes to $52 and the investor closes the contracts at intrinsic value. What is the gain or loss?
Answer = $700 gain
| Action | Result |
|---|---|
| Buy put | -$1,500 |
| Sell put | +$400 |
| Close long put | +$1,800 |
| Close short put | $0 |
| Total | +$700 |
Initially, the investor buys the long put for $15 and sells the short put for $4, creating a net debit of $11, or $1,100 total ($11 × 100 shares).
At $52, the long $70 put is in the money (“put down”). To close it, the investor sells it for intrinsic value. Intrinsic value is $18 ($70 − $52), so the investor closes the long put by selling it for $1,800.
At $52, the short $50 put is out of the money and has no intrinsic value. To close it, the investor buys it back for intrinsic value. Intrinsic value is $0, so the investor closes the short put by buying it for $0.
One last topic: spread investors typically look for a specific outcome depending on whether the strategy is a debit or credit spread. Here are the key associations:
- Debit spreads = widen & exercise
- Credit spreads = narrow & expire
As discussed in the call spreads chapter, you can answer most test questions on this topic by first identifying whether the spread is a debit or a credit spread.
In a debit spread, the investor wants the spread between the option premiums to widen. For example:
Short 1 ZYX Jan 20 put @ $1
Long 1 ZYX Jan 25 put @ $3
Market price = $24
The spread between the premiums is currently $2 ($3 − $1). This is a bear put spread (the long put has the higher premium and higher strike), so the investor wants ZYX’s market price to fall.
If the market falls to $20, the long $25 put will be worth at least $5 (its intrinsic value). At $20, the short $20 put still has no intrinsic value. If the options are near expiration, the short put’s premium could be close to $0.
Assume the long put’s premium is now $5 and the short put’s premium stays at $1. The premium spread is now $4 ($5 − $1), which is wider than the original $2. With a wider premium spread, the investor can close the contracts at a profit.
In a debit spread, the investor also prefers the options to exercise. Using the same example:
Short 1 ZYX Jan 20 put @ $1
Long 1 ZYX Jan 25 put @ $3
Market price = $24
If both options expire worthless, the investor is left with the original $200 net debit, which is the maximum loss. That happens if ZYX stays at or above $25.
If ZYX falls below $25, the long put goes in the money, gains intrinsic value, and the position starts moving toward profitability. Once ZYX falls below $20, the short put also goes in the money and begins offsetting the long put’s gains.
When both options are in the money (below $20), the investor is at maximum gain. The long put drives the profit, and the short put caps additional gains below $20.
For a final example, here’s how credit spreads can show up in a tricky question:
An investor goes long 1 LMN Jun 110 put and short 1 LMN Jun 125 put. Which of the following outcomes is the investor hoping for?
A) Spread between the premiums to widen and both options exercised
B) Spread between the premiums to narrow and both options expire
C) Spread between the premiums to widen and both options expire
D) Spread between the premiums to narrow and both options exercised
Answer = B
Premiums aren’t provided, but you can still identify the dominant leg in a vertical put spread by finding the higher strike price. The short put has the higher strike ($125), so it’s the dominant leg. That makes this a:
- Bull put spread
- Short put spread
- Credit put spread
Once you know it’s a credit spread, the preferred outcome is narrow & expire.
If LMN rises above $125, both puts are out of the money and have no intrinsic value. As expiration approaches, both premiums tend toward $0, so the spread between them narrows.
Above the high strike ($125), both options expire worthless, locking in the maximum gain. That’s why the investor prefers expiration.
Whether you remember the full story or not, these are the primary test points:
- Debit spreads = widen / exercise
- Credit spreads = narrow / expire
There are many memory tricks for this. For example, some remember that “credit,” “narrow,” and “expire” all have six letters, so the six-letter words go together.
If you’re more of a visual learner, here’s a video combining everything covered on put spreads: