Call spreads
We’ll focus on call spreads in this chapter. As a reminder, a call spread is:
Long call & short call
Most math-based spread questions focus on vertical (price) spreads, where both contracts have the same expiration but different strike prices. For example:
Long 1 ABC Jan 60 call
Short 1 ABC Jan 70 call
You’ll use a four-step system to answer maximum gain, maximum loss, and breakeven questions. This system applies to spreads, so the first job is always to correctly identify the strategy.
Let’s work through the spread system using this example:
Long 1 ABC Jan 60 call @ $8
Short 1 ABC Jan 70 call @ $4
Step 1: Net the premiums
The investor buys the long call for $8 and sells the short call for $4. That creates a net debit of $4, or $400 total ($4 × 100 shares).
This step tells you whether the debit/credit is the max gain or max loss:
- Net debit = maximum loss
- Net credit = maximum gain
Because this spread has a $400 net debit, the maximum loss is $400.
Step 2: Net the strike prices
This step doesn’t give a final answer by itself, but you’ll use it in steps 3 and 4.
Long 1 ABC Jan 60 call @ $8
Short 1 ABC Jan 70 call @ $4
The difference between the strike prices is $10 ($70 − $60).
Step 3: Net strikes - net premium
Take the strike difference ($10) and subtract the net premium ($4):
$10 − $4 = $6
That $6 is the “other max.” Since step 1 gave us the maximum loss, step 3 gives us the maximum gain:
$6 × 100 = $600 maximum gain
If step 1 gives maximum loss, step 3 gives maximum gain. If step 1 gives maximum gain, step 3 gives maximum loss.
Step 4: Strike price +/- net premium
Now go back to the original net premium from step 1 (a $4 debit) to find breakeven. Use the rule that matches the spread type:
- Call spreads = add net premium to the low strike
- Put spreads = subtract net premium from the high strike
Long 1 ABC Jan 60 call @ $8
Short 1 ABC Jan 70 call @ $4
This is a call spread, so breakeven is:
$60 + $4 = $64
The options payoff chart summarizes the “big picture” of this long call spread. Here’s the strategy again:
Long 1 ABC Jan 60 call @ $8
Short 1 ABC Jan 70 call @ $4
Here’s the payoff chart:
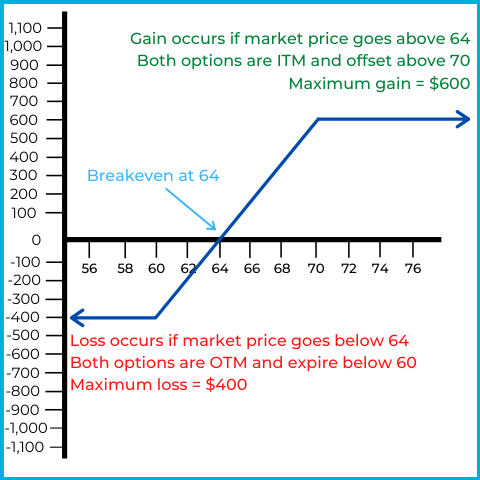
The horizontal axis represents the market price of ABC stock, while the vertical axis represents overall gain or loss.
- Maximum gain = $600
- Maximum loss = $400
- Breakeven = $64
- Option names = Long/bull/debit call spread
This investor is bullish, but they’ve capped their upside. Here’s how the spread behaves at different stock prices:
If ABC’s market price stays below $60
Both options are out of the money and expire worthless. The investor loses the original net debit, which is $400 (maximum loss).
If ABC’s market price goes above $60, but stays below $70
The long call is in the money and gains intrinsic value. At $64, the long call has $4 of intrinsic value, which offsets the $4 net debit, so the position is at breakeven. Above $64, the investor profits as the long call gains more intrinsic value. The short call remains out of the money as long as the stock stays below $70.
If ABC’s market price goes above $70
Both options are in the money and begin offsetting each other. Above $70, each $1 gained on the long call is offset by a $1 loss on the short call. The investor reaches maximum gain at $70, and the payoff stays flat above $70.
What was the investor’s intent?
The investor is bullish on ABC but wants to reduce the cost of buying the call. The long call costs $800 total, and selling the $70 call brings in $400, reducing the net debit to $400. The trade-off is the “ceiling” at $70: no matter how high ABC rises, gains above $70 are offset by the short call.
Spreads can feel abstract at first because you’re combining two options that push and pull against each other. The payoff chart and the four-step system are the quickest way to keep the logic straight.
Let’s see if you can work through an example on your own:
An investor goes long 1 XYZ Dec 90 call at $6 and short 1 XYZ Dec 75 call at $13. Answer the following:
Maximum loss?
Maximum gain?
Breakeven?
Names of the spread?
Here are the answers:
- Maximum loss = $800
- Maximum gain = $700
- Breakeven = $82
- Names of the spread = Short/bear/credit spread
This is how you can determine the answers:
Step 1: Net the premiums
Bought at $6 and sold at $13, creating a net credit of $7. Therefore, the maximum gain is $700.
Step 2: Net the strike prices
The difference between $75 and $90 is $15.
Step 3: Net strikes - net premium
$15 (net strikes) - $7 (net premium) = $8. This represents the “other max” not found in the first step. The maximum gain was determined in the first step, so the maximum loss is $800.
Step 4: Strike price +/- net premium
This is a call spread, so we’ll add $7 (the net premium) to $75 (the low strike price). Therefore, the breakeven is $82.
Naming the spread
You can name this spread two ways. First, the short call has the higher premium, so it’s the dominant leg. Second, on a vertical call spread, the lower strike is always the dominant leg. Since the dominant leg is the short call, this spread is a:
- Short call spread
- Bear call spread
- Credit call spread
The options payoff chart summarizes the “big picture” of this short call spread. Here’s the strategy again:
Long 1 XYZ Dec 90 call @ $6
Short 1 XYZ Dec 75 call @ $13
Here’s the payoff chart:
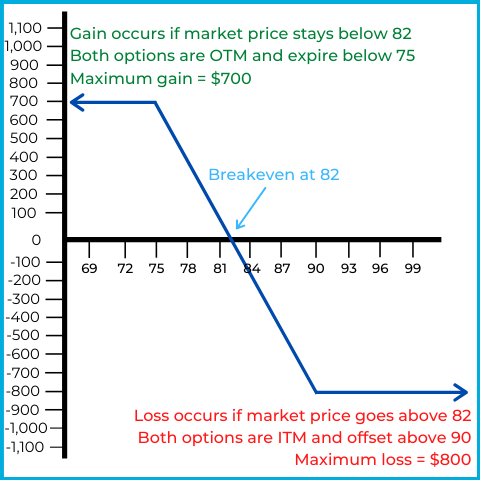
The horizontal axis represents the market price of ABC stock, while the vertical axis represents overall gain or loss.
If XYZ’s market price stays below $75
Both options are out of the money and expire worthless. The investor keeps the original net credit, which is $700 (maximum gain). This is why it’s a bear call spread: the investor prefers the options expire so they can keep the credit.
If XYZ’s market price goes above $75, but stays below $90
The short call is in the money and gains intrinsic value, which hurts a short option position. At $82, the short call has $7 of intrinsic value, which offsets the $7 net credit, so the position is at breakeven. Above $82, the investor has an overall loss as the short call’s intrinsic value grows beyond the credit received. The long call remains out of the money as long as the stock stays below $90.
If XYZ’s market price goes above $90
Both options are in the money and begin offsetting each other. Above $90, each additional $1 lost on the short call is offset by a $1 gain on the long call. The long call caps the loss.
What was the investor’s intent?
The investor is bearish on XYZ but wants protection if the stock rises. Buying the $90 call costs $600 and reduces the net credit from $1,300 to $700. The investor collects less premium, but the loss is capped if the stock rises above $90.
Math-based spread questions often ask for maximum gain, maximum loss, or breakeven. You may also see questions that test how to calculate a gain or loss when a spread is closed. For example:
An investor goes long 1 CBA Sep 35 call at $9 and short 1 CBA Sep 45 call at $4. The market price goes to $43, and the investor closes the contracts at intrinsic value. What is the gain or loss?
Answer = $300 gain
| Action | Result |
|---|---|
| Buy call | -$900 |
| Sell call | +$400 |
| Close long call | +$800 |
| Close short call | $0 |
| Total | +$300 |
Initially, the investor buys the long call for $9 and sells the short call for $4, creating a net debit of $5 or $500 overall ($5 x 100 shares).
At $43, the long call is in the money (“call up”). To close the long call, the investor performs a closing sale equal to intrinsic value. The intrinsic value is $8 ($43 - $35), so the investor closes the long call by selling it for $800.
At $43, the short call is out of the money and has no intrinsic value. To close the short call, the investor performs a closing purchase equal to intrinsic value. The intrinsic value is $0, so the investor closes the short call by buying it for $0.
We have one last topic to cover in this section. Spread investors look for a specific outcome depending on whether the strategy is a debit or credit spread. Start with these associations:
- Debit spreads = widen & exercise
- Credit spreads = narrow & expire
In most test questions, identifying debit vs. credit is enough to choose the correct outcome.
In a debit spread, the investor hopes the spread between the option premiums widens. For example:
Long 1 ZYX Jan 35 call @ $7
Short 1 ZYX Jan 45 call @ $2
Market price = $37
The spread between the premiums is currently $5 ($7 − $2). This is a bull call spread (the long call has the higher premium and lower strike price), so the investor wants ZYX’s market price to rise.
If the market price rises to $45, the long call’s premium will be at least $10 (its intrinsic value). At $45, the short call still has no intrinsic value (it’s at the strike, so it’s not in the money). Assume the long call’s premium is now $10 and the short call’s premium stays at $2. The premium spread is now $8 ($10 − $2), which is wider than the original $5. With a wider spread, the investor can close the position at a profit.
In a debit spread, the investor also prefers the options to be exercised. Using the same structure:
Long 1 ZYX Mar 35 call @ $7
Short 1 ZYX Mar 45 call @ $2
Market price = $37
If both options expire worthless, the investor is left with the original $500 net debit, which is the maximum loss. That happens if ZYX falls to or below $35.
If ZYX rises above $35, the long call goes in the money and gains intrinsic value. Once the market price exceeds $45, the short call also goes in the money and begins offsetting the long call’s gains.
When both options are in the money (above $45), the investor is at maximum gain. Gains above $45 are offset by the short call, but the spread still reaches its capped profit when both options are exercised.
For our last example, here’s how credit spreads show up in a question that doesn’t give premiums:
An investor goes long 1 LMN Jun 80 call and short 1 LMN Jun 65 call. Which of the following outcomes is the investor hoping for?
A) Spread between the premiums to widen and both options exercised
B) Spread between the premiums to narrow and both options expire
C) Spread between the premiums to widen and both options expire
D) Spread between the premiums to narrow and both options exercised
Answer = B (narrow & expire)
Even without premiums, you can identify the dominant leg in a vertical call spread by looking at the lower strike price. Here, the short call has the lower strike ($65), so it’s the dominant leg. That means this is a:
- Bear call spread
- Short call spread
- Credit call spread
Once you know it’s a credit spread, the preferred outcome is narrow & expire.
If LMN falls below $65, both options are out of the money and have no intrinsic value. As expiration approaches, both premiums tend toward $0, so the spread between them narrows. When the stock is below the low strike ($65), both options expire worthless, locking in the maximum gain (the original net credit).
Whether or not you use a memory trick, these are the key test points:
- Debit spreads = widen / exercise
- Credit spreads = narrow / expire
Some people remember that “credit,” “narrow,” and “expire” all have six letters, so the six-letter words go together.
If you’re more of a visual learner, here’s a video combining all we’ve covered on call spreads: