Theories
In general, theories about analyzing and predicting market trends fall under technical analysis. Many theories exist, but you only need to know a few for the exam.
Odd lot theory
The odd lot theory can feel a bit harsh, but it shows up in markets from time to time.
From your SIE studies, you may remember that a round lot is a standardized trading unit. For stocks, a round lot is typically 100 shares. Institutions and wealthier investors (who often have more capital and access to research) tend to trade in round lots - often buying or selling in blocks of hundreds or thousands of shares.
An odd lot is any amount less than a round lot. If a round lot is 100 shares, then buying 37 shares is an odd lot.
There’s nothing inherently wrong with trading odd lots. The idea behind the theory is that less experienced or less informed investors are more likely to trade in odd lots, and they tend to buy when prices are high and sell when prices are low.
So, under the odd lot theory, if a technical analyst sees a clear odd-lot trading pattern, they assume the odd-lot crowd is likely on the wrong side of the market.
- Example: If a chartist sees a large influx of odd-lot selling in a particular stock, they may interpret that as a bullish signal and consider buying.
To keep it simple: technical analysts who follow odd lot theory look for odd-lot trends and then do the opposite.
Short interest theory
Investors can sell short to bet against a security. Short interest measures the percentage of an issuer’s stock that has been sold short.
- Example: If ABC’s short interest is 20%, then 20% of its outstanding shares have been borrowed and sold short.
A high short interest might sound bearish, but short interest theory is somewhat counterintuitive. The theory says that a high level of short interest is a bullish indicator.
Here’s the logic:
- When investors sell short, they’re obligated to buy the shares back later to return the borrowed shares.
- If a stock has high short interest, a lot of selling pressure has already occurred and is likely reflected in the current market price.
- When short sellers eventually buy to cover, that buying can increase demand and push the price upward.
So, under this theory:
- The higher a stock’s short interest, the more bullish technical analysts tend to be.
- The lower a stock’s short interest, the more bearish chartists tend to be.
Dow theory
You’re probably familiar with the Dow Jones averages. The Dow Jones Industrial Average (DJIA) is a commonly cited index in financial media. It’s made up of 30 prominent stocks from various sectors. Visa, Apple, and Verizon are all part of the DJIA (click here for the full list).
There are three primary Dow index averages:
Dow Jones Industrial Average (DJIA)
- 30 prominent stocks
- Various sectors
Dow Jones Transportation Average (DJTA)
- 20 prominent stocks
- Transportation sector
Dow Jones Utility Average (DJUA)
- 15 prominent stocks
- Utility sector
Like other indices, the Dow averages offer clues about economic performance. The DJIA is broader than the other two and is often treated as the best single Dow average for gauging overall economic conditions.
To understand Dow Theory, it helps to start with two baseline assumptions.
First, Dow Theory assumes markets react to news very quickly. That means it’s extremely difficult to trade profitably using widely available public information, because prices adjust before most investors can act. This idea is called the efficient markets theory, and Dow Theory assumes it holds.
Second, Dow Theory says the market moves in three types of trends:
Main (primary) trend
- Overall price trend
- Can last from a few months to several years
- Example: longest historical bull run (2009-2020)
Medium (secondary) trend
- Contrary reaction within a main trend
- Can last from 10 days - 3 months
- Example: Q4 2018 market downturn during historical bull market
Minor (short) trend
- Minor contrary reaction within a larger trend
- Can last hours - one month
- Example: Late November 2018 market rise
These trends can overlap. For example, you can have a short-term bull move inside a secondary bear move, all within a larger primary bull market. This chart helps show how the pieces fit together:
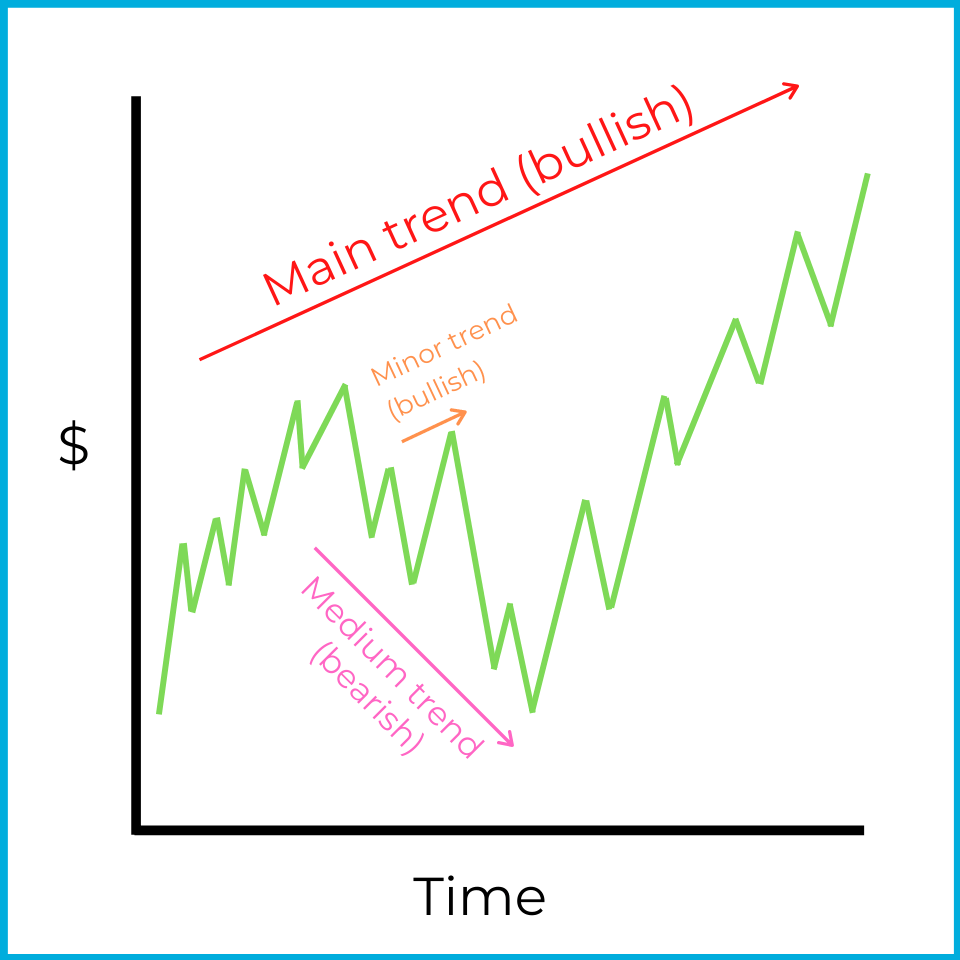
Technical analysts identify trends to help predict future market movement. A market can rise during a broader bear market (and fall during a broader bull market). Labeling a move as main, medium, or minor helps you decide whether today’s price action is part of the overall direction or just a temporary move against it.
The last (and most important) part of Dow Theory is how the three Dow averages are used to confirm market direction.
Sometimes the averages move differently - for example, the DJIA rises, the DJTA falls, and the DJUA stays flat. Dow Theory treats this as a sign of uncertainty: the primary trend may continue, or it may be changing.
A new primary trend is typically not considered confirmed until all three Dow averages move in the same direction for a prolonged period of time. For example, if the market has been in a bull market for years but all three Dow averages turn negative for more than 3 months, Dow Theory treats that as a sign a new bear market may be developing.
These ideas don’t always produce the expected result (which is why they’re called theories). For the exam, focus on what each theory claims and how technical analysts use it to anticipate future market movements.