


Achievable logoAchievable logo
AP Physics 1
Sign in
Sign up
Purchase
Textbook
Practice exams
Support
How it works
Exam catalog
Mountain with a flag at the peak
Textbook
Introduction
1. Decoding the exam
2. Vectors and their analysis
3. Kinematics
3.1 Introduction and basic concepts
3.2 Graphical analysis of motion
3.3 Equations of motion and free fall
3.4 Motion in two dimensions
4. Laws of motion
5. Work, energy, and power
6. Linear momentum and collisions
7. Torque and rotational mechanics
8. Oscillations
9. Fluids
Wrapping up
Achievable logoAchievable logo
3.1 Introduction and basic concepts
Achievable AP Physics 1
3. Kinematics
Our AP Physics 1 course is currently in development and is a work-in-progress.

Introduction and basic concepts

7 min read
Font
Discuss
Share
Feedback

In this sub-chapter, we introduce:

  • Fundamental kinematic quantities:
    • Displacement
    • Velocity
    • Acceleration
  • How each quantity is measured
  • Graphical interpretations
    • Slope of a position-time graph → instantaneous velocity
    • Slope of a velocity-time graph → acceleration
  • Importance of sign conventions

Displacement

Displacement is the change in position:

Δx=xf​−xi​,

where xi​ is the initial position and xf​ is the final position.

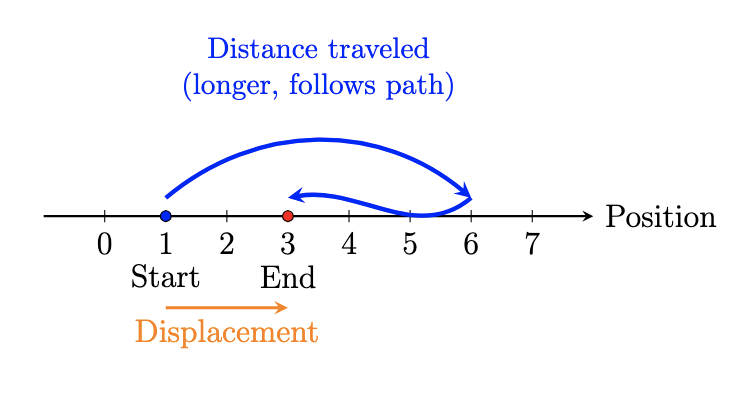
Displacement is a vector quantity: it tells you both how far the object’s position changed and in what direction.

Distance is a scalar quantity: it tells you the total length of the path traveled, without considering direction.

  • Distance is always non-negative and can be larger than the magnitude of displacement if the path isn’t a straight line.
  • Displacement can be positive, negative, or zero, depending on the chosen coordinate system and whether the object returns to its starting point.
Distance and displacement

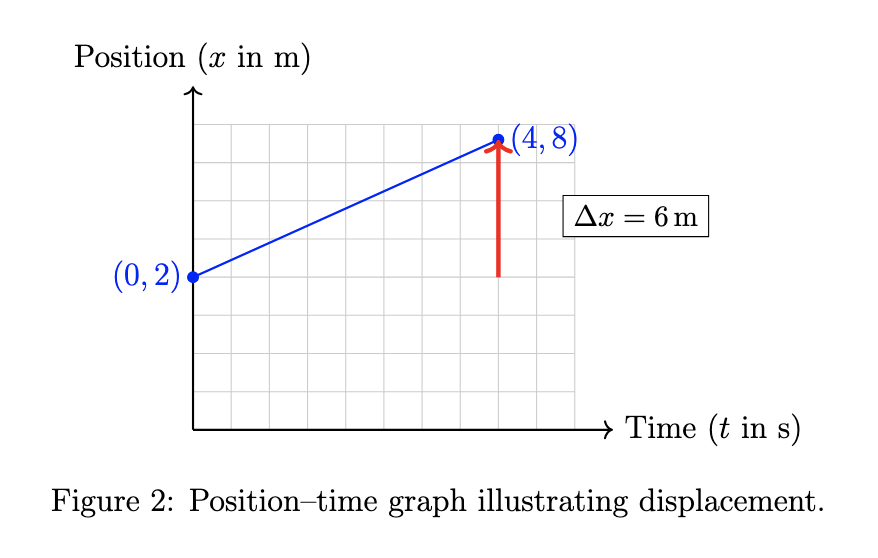
On a position-time graph, the vertical difference between the positions at two different times is the displacement over that time interval. For example, if an object moves from x=2m at t=0 to x=8m at t=4s, then:

Δx=8m−2m=6m.

Graph illustrating displacement

Example problem 1

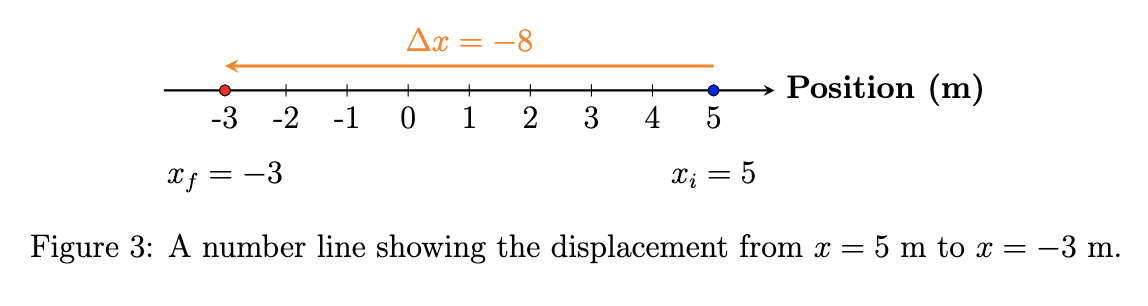
An object moves from x=5m to x=−3m. Calculate its displacement.

Solution:

(spoiler)
  1. Identify initial and final positions

    • Initial position: xi​=5m
    • Final position: xf​=−3m
  2. Use the definition of displacement

    Δx=xf​−xi​.

  3. Substitute the values

    Δx=(−3m)−(5m).

  4. Calculate

    Δx=−3m−5m=−8m.

    The negative sign means the displacement points in the negative direction (left, if right is defined as positive).

  5. Interpret the result A displacement of −8m means the object’s final position is 8 meters to the left of its starting position.

Displacement according to scenario

Velocity

Velocity describes how quickly displacement changes with time.

The average velocity over a time interval is:

vavg​=ΔtΔx​.

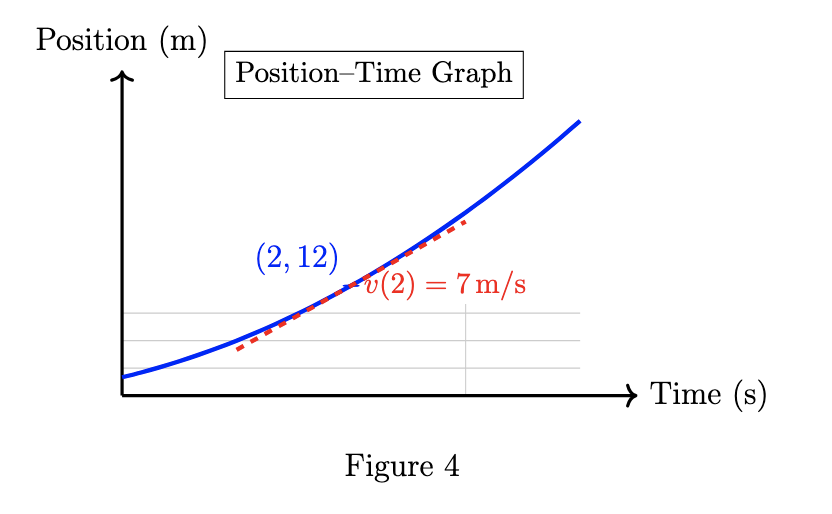
The instantaneous velocity is the velocity at a specific moment. On a position-time graph, it’s given by the slope of the tangent line at that point.

On a position-time graph:

  • A steeper slope means a larger speed.
  • A positive slope means motion in the positive direction.
  • A negative slope means motion in the negative direction.
Instantaneous velocity on a position-time graph

Example problem 2

A car travels from x=0m to x=100m in 5s. Calculate its average velocity.

(spoiler)

Solution:

  1. Identify the positions and time interval

    • Initial position: xi​=0m
    • Final position: xf​=100m
    • Time interval: Δt=5s
  2. Compute the displacement

    Δx=100m−0m=100m.

  3. Calculate the average velocity

    vavg​=5s100m​=20m/s.

  4. Interpret the result An average velocity of 20m/s means that, over the 5-second interval, the car’s displacement changes by 20 meters each second on average. The car’s instantaneous velocity could still vary during that time.

Acceleration

Acceleration describes how quickly velocity changes with time.

The average acceleration over a time interval is:

aavg​=ΔtΔv​,

where Δv=vf​−vi​.

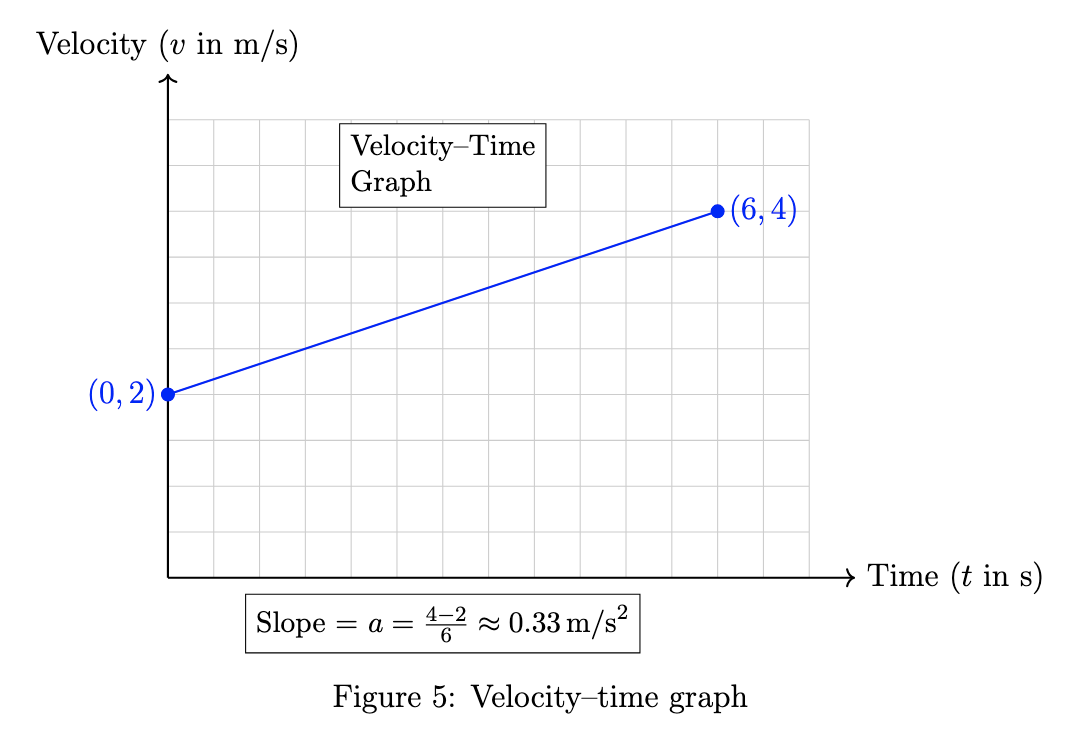
On a velocity-time graph:

  • The slope of the line gives the acceleration.
  • The area under the curve gives the displacement.
Acceleration on a velocity time graph

Example problem 3

A vehicle’s velocity increases from 8m/s to 28m/s in 5s. Determine the average acceleration.

Solution:

(spoiler)
  1. Find the change in velocity

    Δv=28m/s−8m/s=20m/s.

  2. Identify the time interval

    Δt=5s.

  3. Calculate the average acceleration

    aavg​=5s20m/s​=4m/s2.

Sign conventions

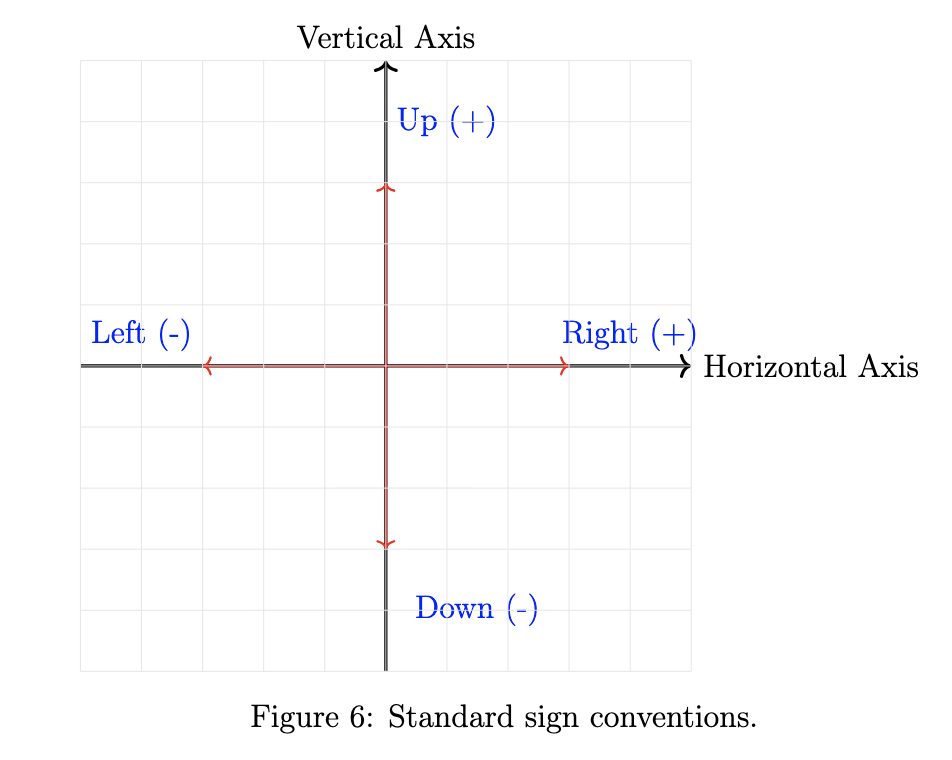
A consistent sign convention is essential in kinematics because it determines the signs of displacement, velocity, and acceleration.

  • Horizontal motion: right is positive; left is negative.
  • Vertical motion: upward is positive; downward is negative.

Once you choose a convention, keep it for the entire problem. For example, in free fall, if upward is positive, then the acceleration due to gravity is negative.

Standard sign conventions

Example problem 4

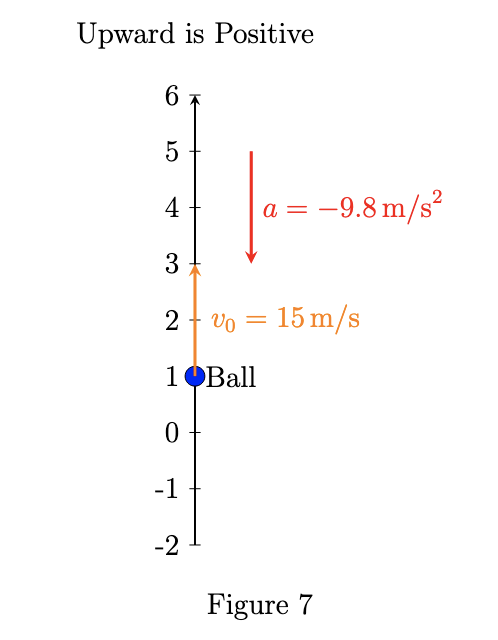
A ball is thrown upward with an initial velocity of 15m/s. If upward is defined as positive and the acceleration due to gravity is −9.8m/s2, what does the negative acceleration indicate?

Solution:

  1. State the sign convention Upward is positive, so downward is negative.

  2. Interpret the acceleration The acceleration due to gravity is −9.8m/s2, so gravity acts downward.

  3. Connect this to the motion The ball starts with a positive (upward) velocity, but the negative acceleration reduces that velocity to zero at the peak and then makes the velocity negative as the ball falls.

Answer: The negative acceleration indicates that gravity acts downward, opposite to the positive (upward) direction.

Sign convention as per scenario

Fundamental kinematic quantities

  • Displacement, velocity, acceleration are core concepts
  • Each has specific measurement and graphical interpretation
  • Slope of position-time graph: instantaneous velocity; slope of velocity-time graph: acceleration
  • Sign conventions are crucial for direction

Displacement

  • Displacement: $ 95 x = x_f - x_i$ (vector, includes direction)
  • Distance: scalar, always non-negative, may exceed displacement
  • Displacement can be positive, negative, or zero depending on direction and path

Velocity

  • Average velocity: vavg​=ΔtΔx​
  • Instantaneous velocity: slope of tangent on position-time graph
  • Slope direction:
    • Positive: motion in positive direction
    • Negative: motion in negative direction

Acceleration

  • Average acceleration: aavg​=ΔtΔv​
  • Slope of velocity-time graph: acceleration
  • Area under velocity-time graph: displacement

Sign conventions

  • Assign positive/negative directions (e.g., right/up positive, left/down negative)
  • Consistency in sign convention is essential throughout a problem
  • Negative acceleration (e.g., gravity) indicates direction opposite to positive axis

General strategies

  • Always define and stick to a sign convention
  • Use graphs to interpret and relate kinematic quantities
  • Distinguish between displacement vs. distance, and average vs. instantaneous values

Sign up for free to take 6 quiz questions on this topic

Previous
Next  | 3.2 Graphical analysis of motion
All rights reserved ©2016 - 2026 Achievable, Inc.

Introduction and basic concepts

In this sub-chapter, we introduce:

  • Fundamental kinematic quantities:
    • Displacement
    • Velocity
    • Acceleration
  • How each quantity is measured
  • Graphical interpretations
    • Slope of a position-time graph → instantaneous velocity
    • Slope of a velocity-time graph → acceleration
  • Importance of sign conventions

Displacement

Displacement is the change in position:

Δx=xf​−xi​,

where xi​ is the initial position and xf​ is the final position.

Displacement is a vector quantity: it tells you both how far the object’s position changed and in what direction.

Distance is a scalar quantity: it tells you the total length of the path traveled, without considering direction.

  • Distance is always non-negative and can be larger than the magnitude of displacement if the path isn’t a straight line.
  • Displacement can be positive, negative, or zero, depending on the chosen coordinate system and whether the object returns to its starting point.

On a position-time graph, the vertical difference between the positions at two different times is the displacement over that time interval. For example, if an object moves from x=2m at t=0 to x=8m at t=4s, then:

Δx=8m−2m=6m.

Example problem 1

An object moves from x=5m to x=−3m. Calculate its displacement.

Solution:

(spoiler)
  1. Identify initial and final positions

    • Initial position: xi​=5m
    • Final position: xf​=−3m
  2. Use the definition of displacement

    Δx=xf​−xi​.

  3. Substitute the values

    Δx=(−3m)−(5m).

  4. Calculate

    Δx=−3m−5m=−8m.

    The negative sign means the displacement points in the negative direction (left, if right is defined as positive).

  5. Interpret the result A displacement of −8m means the object’s final position is 8 meters to the left of its starting position.

Velocity

Velocity describes how quickly displacement changes with time.

The average velocity over a time interval is:

vavg​=ΔtΔx​.

The instantaneous velocity is the velocity at a specific moment. On a position-time graph, it’s given by the slope of the tangent line at that point.

On a position-time graph:

  • A steeper slope means a larger speed.
  • A positive slope means motion in the positive direction.
  • A negative slope means motion in the negative direction.

Example problem 2

A car travels from x=0m to x=100m in 5s. Calculate its average velocity.

(spoiler)

Solution:

  1. Identify the positions and time interval

    • Initial position: xi​=0m
    • Final position: xf​=100m
    • Time interval: Δt=5s
  2. Compute the displacement

    Δx=100m−0m=100m.

  3. Calculate the average velocity

    vavg​=5s100m​=20m/s.

  4. Interpret the result An average velocity of 20m/s means that, over the 5-second interval, the car’s displacement changes by 20 meters each second on average. The car’s instantaneous velocity could still vary during that time.

Acceleration

Acceleration describes how quickly velocity changes with time.

The average acceleration over a time interval is:

aavg​=ΔtΔv​,

where Δv=vf​−vi​.

On a velocity-time graph:

  • The slope of the line gives the acceleration.
  • The area under the curve gives the displacement.

Example problem 3

A vehicle’s velocity increases from 8m/s to 28m/s in 5s. Determine the average acceleration.

Solution:

(spoiler)
  1. Find the change in velocity

    Δv=28m/s−8m/s=20m/s.

  2. Identify the time interval

    Δt=5s.

  3. Calculate the average acceleration

    aavg​=5s20m/s​=4m/s2.

Sign conventions

A consistent sign convention is essential in kinematics because it determines the signs of displacement, velocity, and acceleration.

  • Horizontal motion: right is positive; left is negative.
  • Vertical motion: upward is positive; downward is negative.

Once you choose a convention, keep it for the entire problem. For example, in free fall, if upward is positive, then the acceleration due to gravity is negative.

Example problem 4

A ball is thrown upward with an initial velocity of 15m/s. If upward is defined as positive and the acceleration due to gravity is −9.8m/s2, what does the negative acceleration indicate?

Solution:

  1. State the sign convention Upward is positive, so downward is negative.

  2. Interpret the acceleration The acceleration due to gravity is −9.8m/s2, so gravity acts downward.

  3. Connect this to the motion The ball starts with a positive (upward) velocity, but the negative acceleration reduces that velocity to zero at the peak and then makes the velocity negative as the ball falls.

Answer: The negative acceleration indicates that gravity acts downward, opposite to the positive (upward) direction.

Key points

Fundamental kinematic quantities

  • Displacement, velocity, acceleration are core concepts
  • Each has specific measurement and graphical interpretation
  • Slope of position-time graph: instantaneous velocity; slope of velocity-time graph: acceleration
  • Sign conventions are crucial for direction

Displacement

  • Displacement: $ 95 x = x_f - x_i$ (vector, includes direction)
  • Distance: scalar, always non-negative, may exceed displacement
  • Displacement can be positive, negative, or zero depending on direction and path

Velocity

  • Average velocity: vavg​=ΔtΔx​
  • Instantaneous velocity: slope of tangent on position-time graph
  • Slope direction:
    • Positive: motion in positive direction
    • Negative: motion in negative direction

Acceleration

  • Average acceleration: aavg​=ΔtΔv​
  • Slope of velocity-time graph: acceleration
  • Area under velocity-time graph: displacement

Sign conventions

  • Assign positive/negative directions (e.g., right/up positive, left/down negative)
  • Consistency in sign convention is essential throughout a problem
  • Negative acceleration (e.g., gravity) indicates direction opposite to positive axis

General strategies

  • Always define and stick to a sign convention
  • Use graphs to interpret and relate kinematic quantities
  • Distinguish between displacement vs. distance, and average vs. instantaneous values

More from Kinematics

  • Graphical analysis of motion
  • Equations of motion and free fall
  • Motion in two dimensions