



Graphical analysis of motion
This sub-chapter shows you how to analyze motion using graphs. We’ll focus on four tools:
Position-time graphs
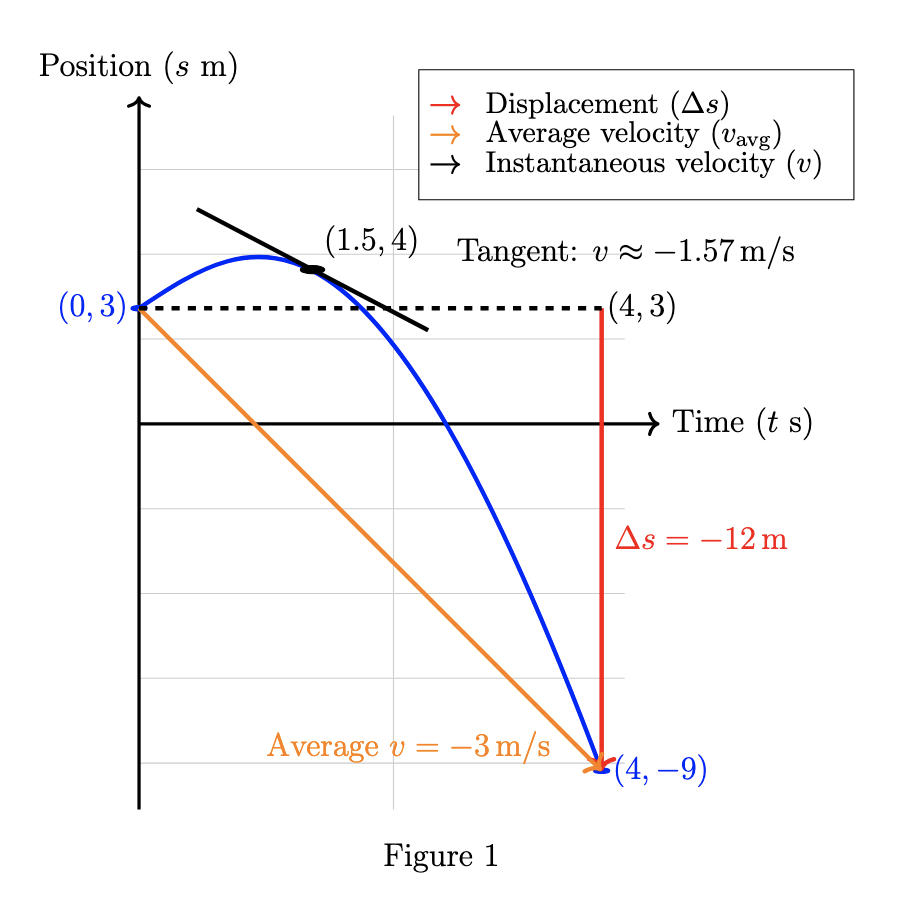
A position-time graph plots an object’s position on the vertical axis versus time on the horizontal axis. From this kind of graph, you can read position directly, and you can derive other quantities from the shape of the curve.
Consider the position-time curve below. Compare the starting point at and the ending point at . The vertical distance between these points is the displacement.
- The slope of the tangent line at a point gives the instantaneous velocity at that time.
- The slope of the secant line between two points gives the average velocity over that time interval.
Example problem 1
An object moves according to the function
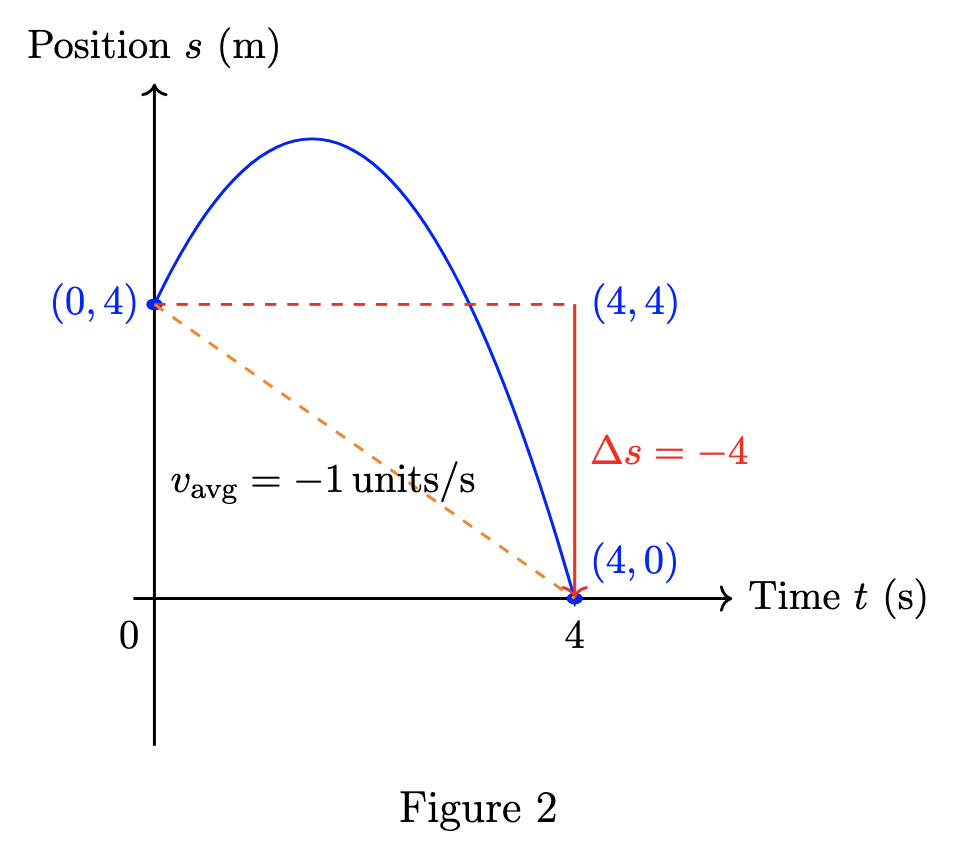
a) Using the graph, determine the displacement from s to s.
b) Explain how you would estimate the average velocity over this interval.
Solution:
-
Write down the position function.
-
Evaluate the position at and .
-
Find the displacement from to .
The negative sign means the final position is 4 units below the initial position on the -axis.
-
Estimate the average velocity over the interval .
Use displacement over elapsed time:
On the graph, this is the slope of the secant line connecting and .
Velocity-time graphs
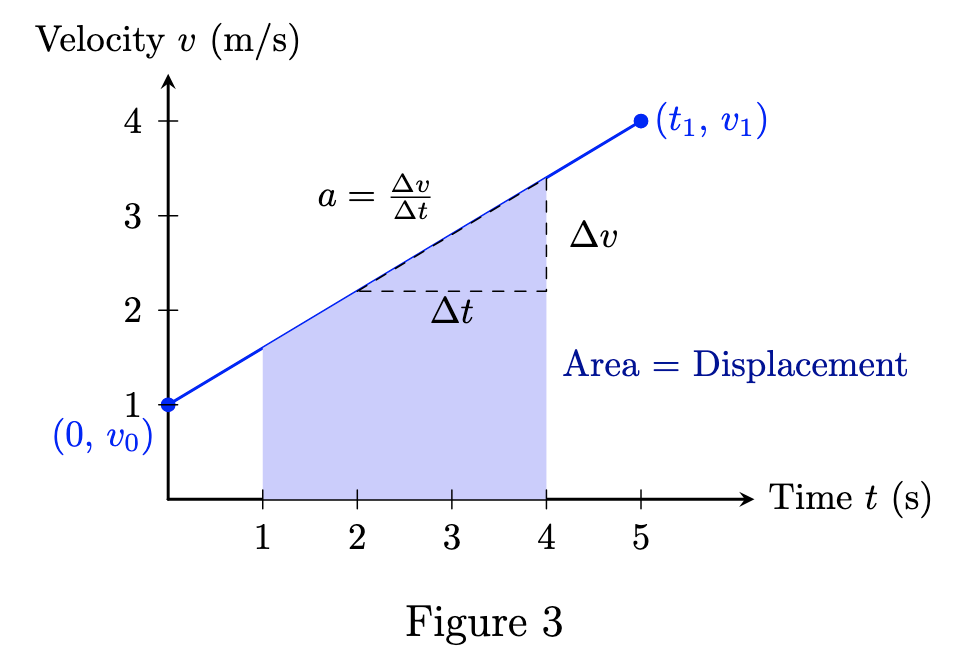
A velocity-time graph shows velocity on the vertical axis and time on the horizontal axis. Two key ideas come directly from the geometry of the graph:
For example, if the graph is a straight line, the area under the line between two time points forms a trapezoid.
In the graph below, the slope corresponds to acceleration, and the shaded area under the curve represents the displacement over that time interval.
Example problem 2
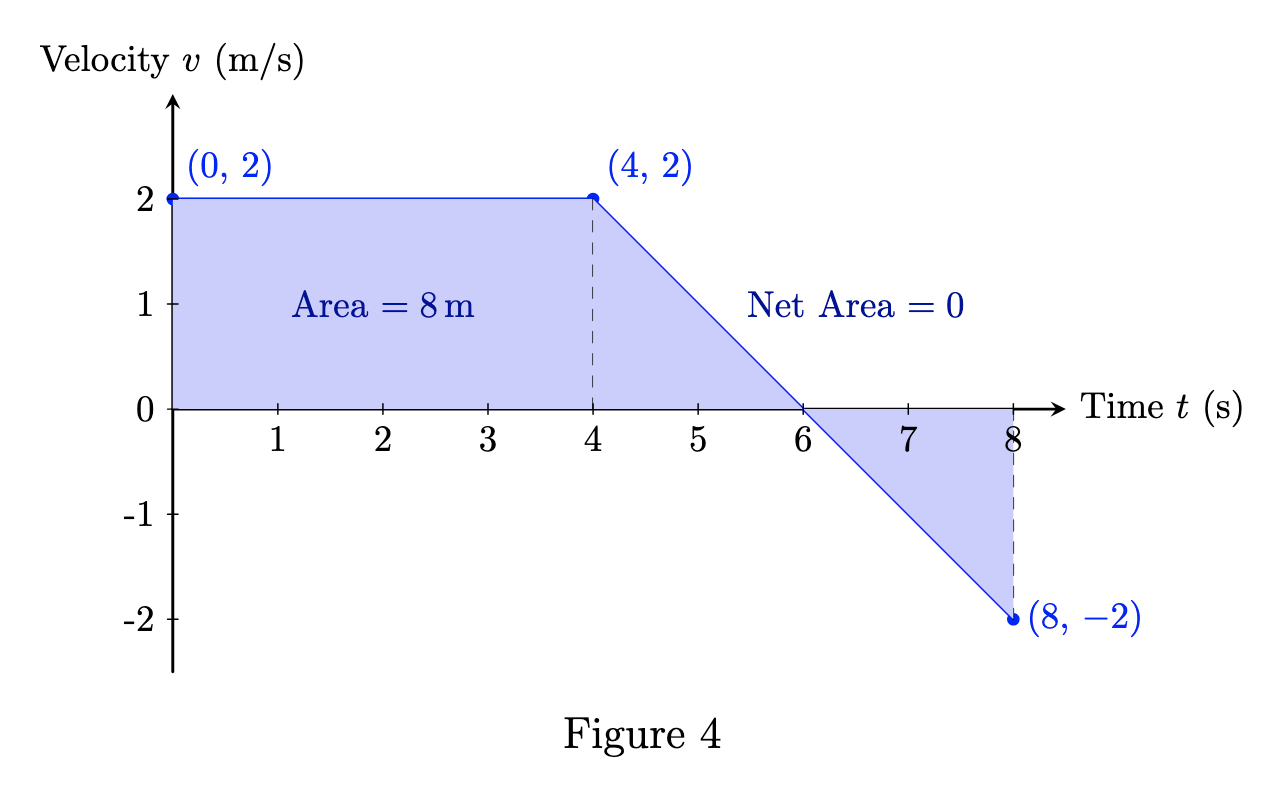
An object moves along a straight line with the following velocity-time profile:
Use the velocity-time graph to:
- Determine the displacement from to seconds.
- Determine the displacement from to seconds.
- Find the net displacement from to seconds.
- Find the total distance traveled over the entire 8-second interval.
Solution:
-
Velocity-time graph setup:
- From to s, the velocity is constant at m/s.
- From to s, the velocity decreases linearly from m/s to m/s.
The velocity crosses zero between 4 and 8 seconds, which indicates a change in direction.
-
Displacement from to s:
-
Displacement from to s:
The area under the velocity curve from to is a trapezoid with bases and and a width of 4 s:
Thus, the net displacement from to is zero (the object returns to the same position it had at , but not necessarily to the same position it started at ).
-
Net displacement from to s:
-
Total distance traveled from to s:
Net displacement can be zero even when the object moves, because motion in opposite directions cancels in the signed area. To find total distance, split the interval at the instant where .
-
is the time when velocity crosses zero.
-
From to , the velocity is positive, so the object moves forward.
-
From to , the velocity is negative, so the object moves backward.
-
From to : Distance = 8 m.
-
From to : Distance = m.
-
Total distance m.
-
Acceleration-time graphs
An acceleration-time graph plots acceleration on the vertical axis versus time on the horizontal axis.
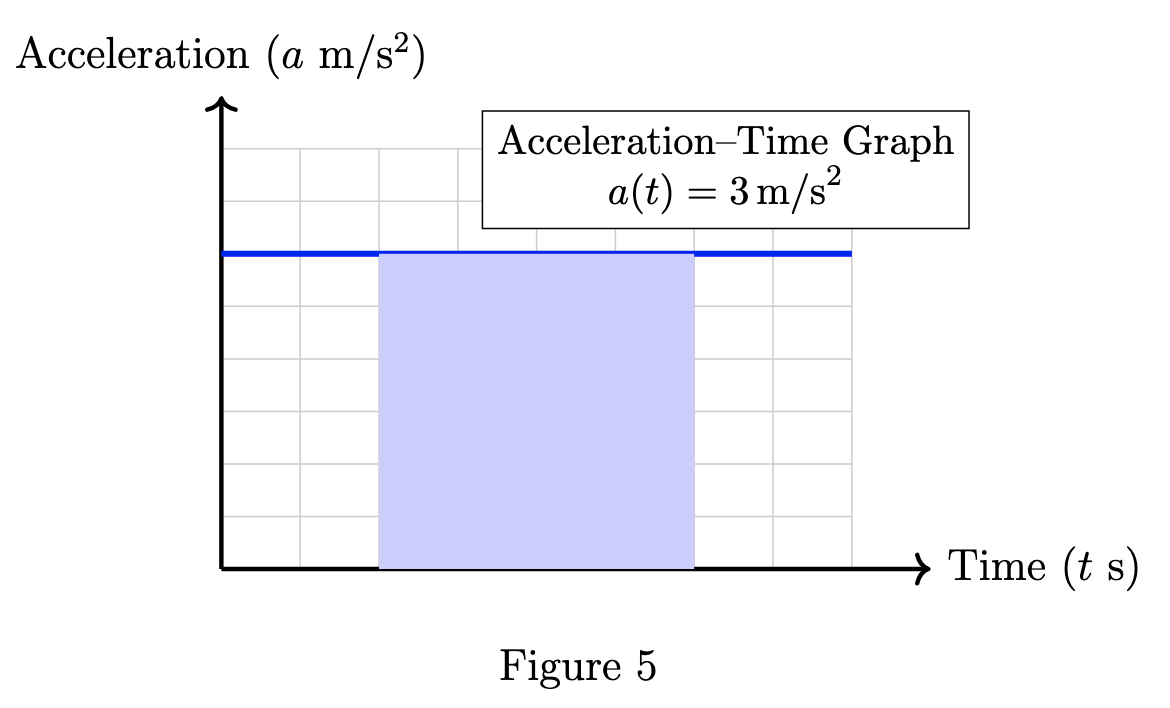
Below is an acceleration-time graph showing a constant acceleration of . The shaded area between and s represents the change in velocity over that interval.
Example problem 3
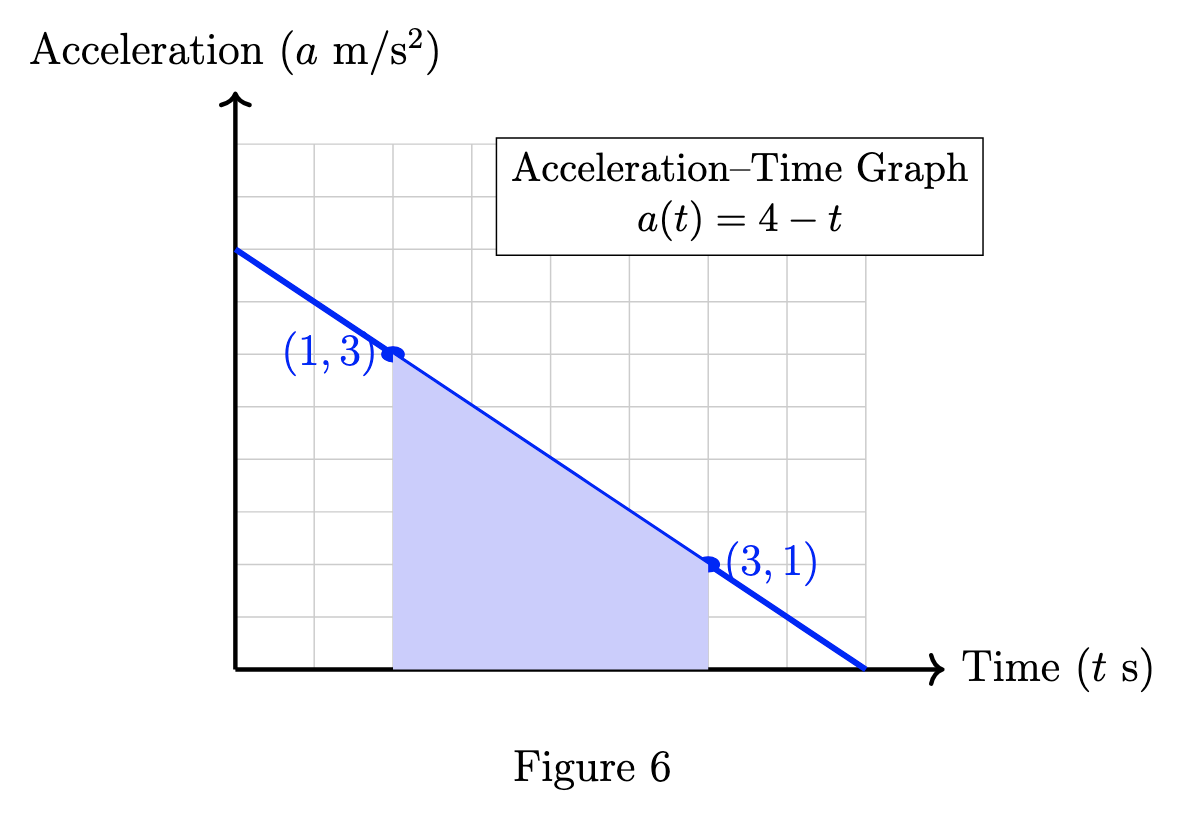
Consider the acceleration function:
a) Estimate the change in velocity between s and s by approximating the area under the acceleration-time graph.
b) Explain what the sign of the change in velocity indicates about the object’s motion.
Solution:
-
At , and at , .
Approximating the area under the graph as a trapezoid:
-
A positive change in velocity means the object’s velocity increases by over the interval.
Example problem 4
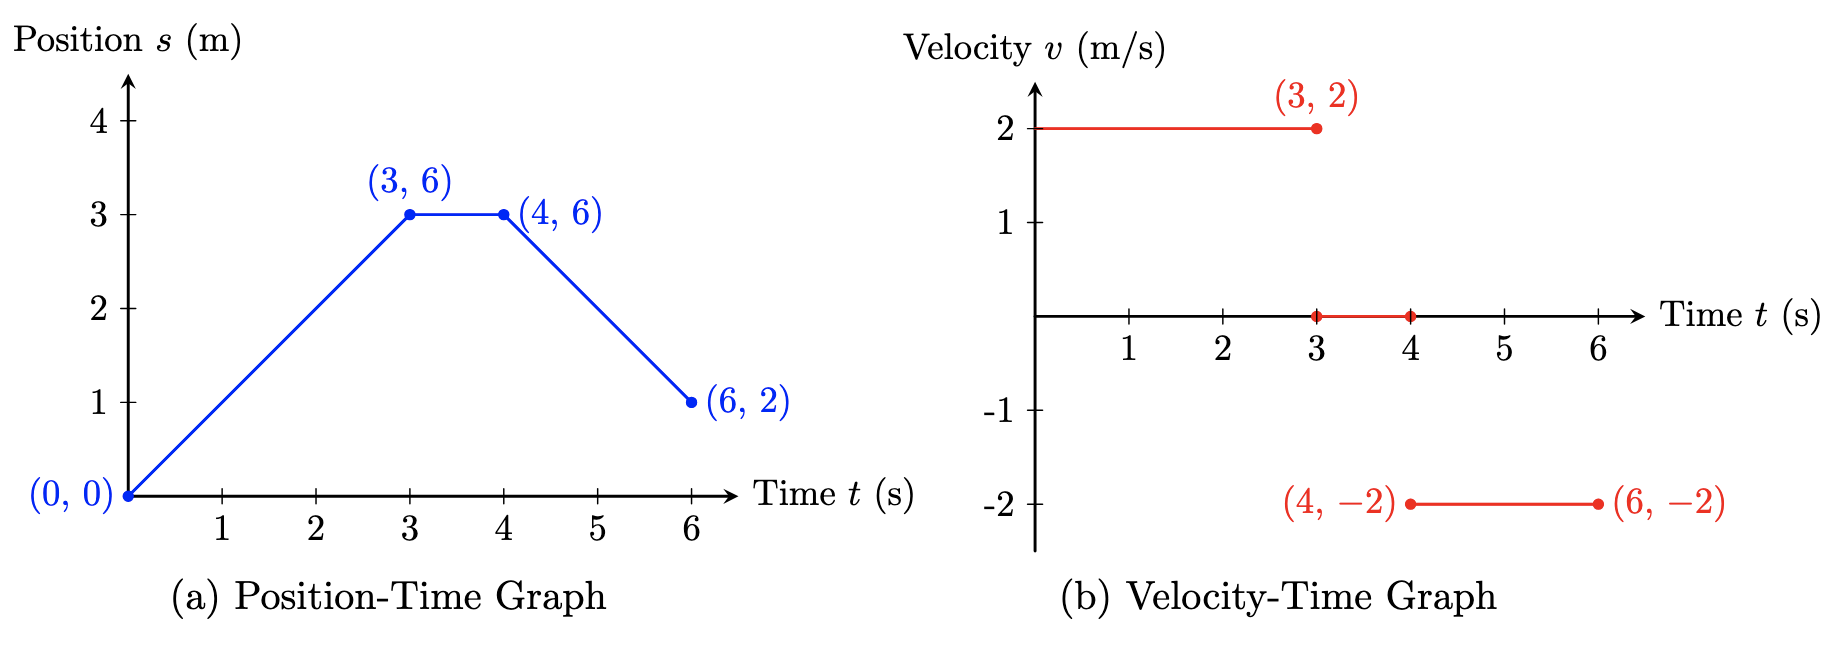
An object moves along a straight line for the time interval seconds. The following two graphs describe the motion:
a) From the position-time graph, determine the displacement of the object between s and s.
b) From the velocity-time graph, calculate the net displacement of the object over the entire interval s to s.
c) Using the velocity-time graph, determine the total distance traveled by the object from s to s.
d) At s, use the slope of the position-time graph to find the instantaneous velocity.
e) From the velocity-time graph, find the average acceleration of the object during the first 3 seconds.
Solution:
(a) Displacement from to s (Position-time graph):
- At , the position is m.
- At , the position is m.
- Displacement: m.
(b) Net displacement from to s (Velocity-time graph):
- From to : m/s, area = m.
- From to : m/s, area = 0 m.
- From to : m/s, area = m.
- Net displacement: m.
(c) Total distance traveled from to s (Velocity-time graph):
- Distance from to : 6 m.
- Distance from to : m.
- Total distance: m.
(d) Instantaneous velocity at s (Position-time graph):
- The slope between and is m/s.
- Thus, m/s.
(e) Average acceleration from to s (Velocity-time graph):
- Since the velocity is constant at m/s from to , m/s.
- Therefore, .