



Price indices and inflation calculations
Economists measure inflation using a tool known as a price index. A price index is a weighted average price of all goods and services of the same type over a specific time period and location. Each price index is adjusted so that a specific year has a value of 100, this is called the base year. Then every other year’s value is relative to the base year.
Price indices allow us to compute measures of inflation, convert nominal values into real values and compare purchasing power over time and sometimes across countries. We will not use the same price index for each application.
Because a price index combines the prices of many goods and services, if the price of a single good or service is higher but every other good and service has the same price, that will only have a small effect on the overall price level.
Here are the three important price indices to know for the AP exam.
The Producer Price Index tracks sale prices of all domestic production, not just final goods. It measures prices of revenue for firms, and these need not be the same as the prices paid by any buyers.
Data is collected through monthly surveys of producers, and used to create PPIs for individual products. These are then combined to create PPIs for broader industries and eventually for the entire economy. Either the component PPIs or the overall are sometimes used by firms for things such as price adjustments in multi-year contracts.
For the AP exam, PPI mainly shows up as a concept. For the CPI and GDP implicit price deflator much more is expected, and that is where we turn to next.
Consumer Price Index (CPI)
The Consumer Price Index, abbreviated CPI, tracks the cost of a fixed basket of goods and services over time. The main version that we talk about is the CPI-U, which aims to be representative of the consumption of all urban consumers in the United States. There is a seasonal adjustment applied to monthly and quarterly values, to make inflation calculations more accurate.
The CPI is an index, so the value during the base year is equal to 100. Unfortunately the base year for the CPI is a little confusing, since it is the average of the years 1982-84. This was a time of transition from a period of high inflation to a period of lower inflation, which explains why it is not a single year.
Data is collected for over 200 individual product categories, and turned into indices for sub-categories in a specific city location. These pieces are weighted and added until there is a single value for all goods in the whole country. The weights for products and locations are currently updated every year and there are also complex adjustments to account for changes in product quality.
There are a few important details that are connected to the components of GDP. The first is that the CPI includes imported goods. It is intended to be representative of demand for any good or service.
The second is with regards to housing, in particular how we treat people who own their own home. For the CPI all the costs of owning your own home, maintenance, property taxes and home improvement costs are also not included. That does not mean we ignore owner-occupied housing, it is just included in a special way. For any owner-occupied piece of property, owners’ equivalent rent is an estimated of what a market rent would be. The computation of this is very technical, it is enough to be aware that this piece in particular does not represent actual spending by consumers.
It is unlikely that any random household actually has the spending profile of the CPI, but it is reflective of an imaginary “average” household that leads to the observed total spending. So while it does not measure actual spending, the CPI does provide a measure of the price level from the side of household demand and is useful for calculating inflation rates.
Many contracts and government payments that have inflation-adjustments. For things such as Social Security payments, these adjustments are referred to as Cost of Living Adjustments, COLAs.
GDP implicit price deflator
The GDP implicit price deflator, often shortened to just GDP deflator, is defined to be the ratio of nominal GDP to real GDP multiplied by .
This means that if nominal GDP and real GDP are equal, the value of the GDP deflator will be 100. This is only guaranteed to be true for the base year, which is currently 2017.
The CPI is representative of average purchasing behavior of consumers, regardless of where the goods come from. The GDP deflator, on the other hand, looks at price changes for all goods and services produced domestically.
Now imports will not be included and exports will be included. Adjustments for home ownership are not needed. Only actual production of goods in a country’s borders are included.
Inflation rate calculations
With values of any price index in hand, we can calculate total inflation between two periods as a simple growth rate. We multiply that by 100 so that the value is a percentage expressed as a whole number. That is,
This calculation is most commonly used to compare to values the previous year. If we compute it over multiple years it gives total inflation from the first year up to the last year.
If we calculate the difference from a previous period that is under a year, these values are often annualized. This involves changing it to represent what the rate of change would be if they occurred over a full year. So a change from the previous month would be multiplied by 12, from the previous quarter multiplied by 4.
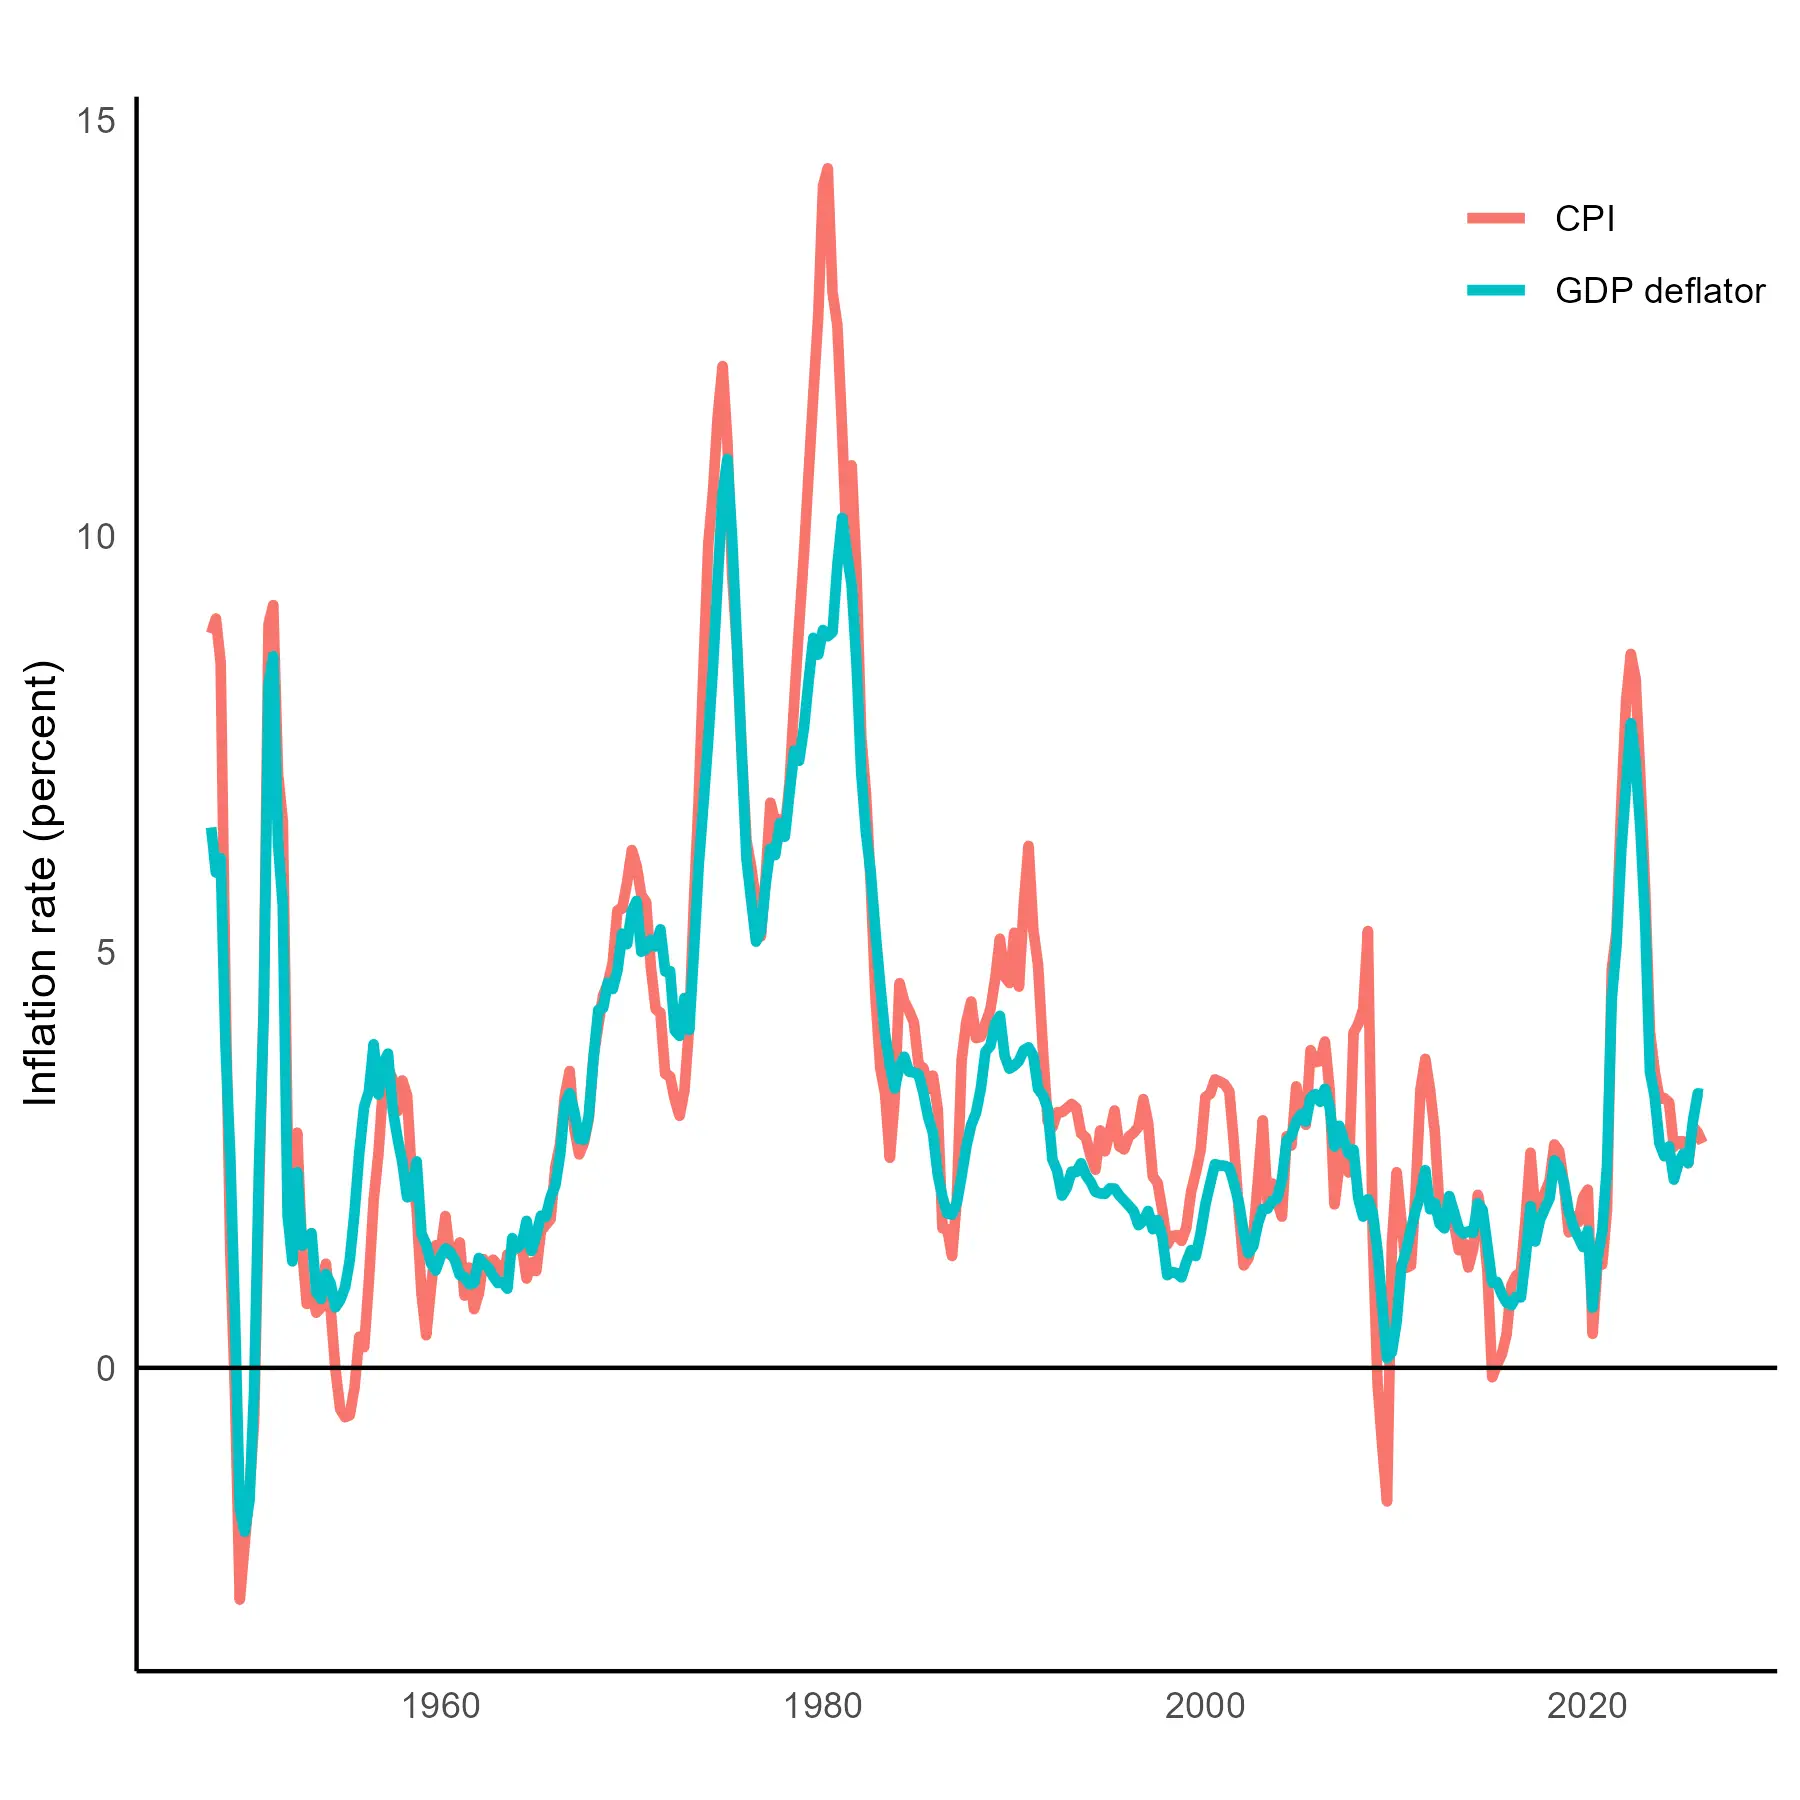
As an example we can compare the CPI and GDP deflator values. This chart shows quarterly data since 1948, the earliest year available. Each inflation rate is taken by calculating the percentage change from the same quarter in the previous year.
We can see that the values are very similar, with CPI generally having slightly larger movements.
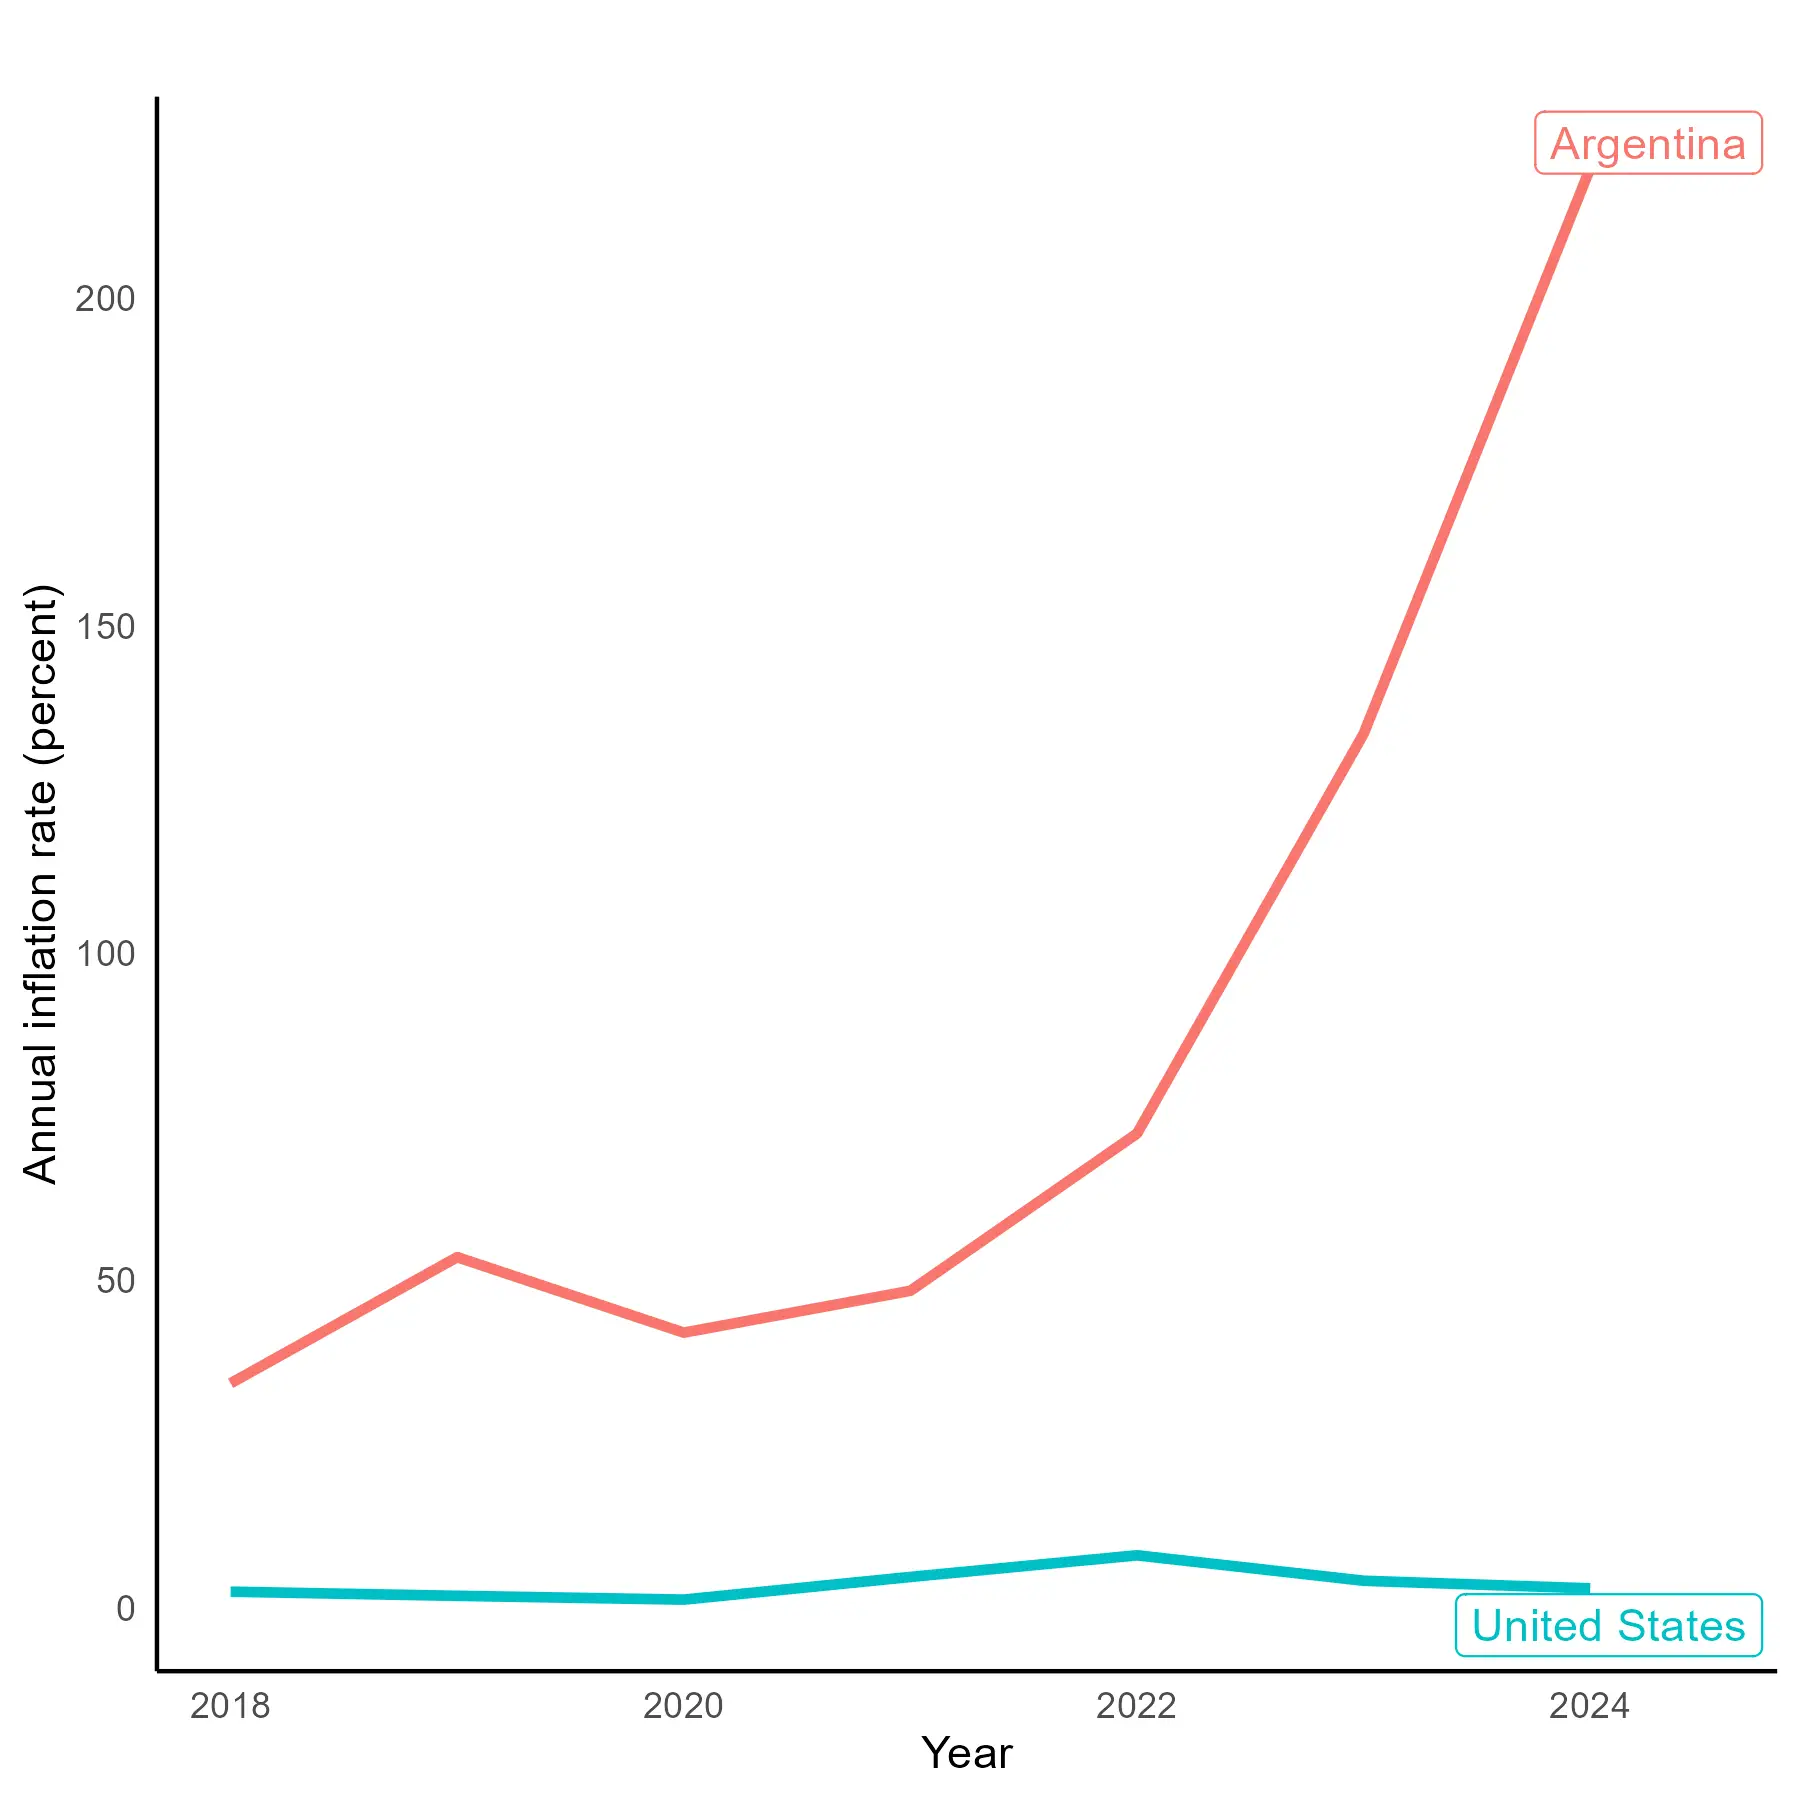
We can also compare inflation in two countries. The chart below gives the annual inflation rates in Argentina and the United States between 2018 and 2024, using each country’s version of the CPI.
Argentina’s values are so high that it makes the US values seem like they are zero. This is in spite of the US experiencing its highest inflation rates since the early 1980s. This is an example we will return to when we talk about exchange rates.
Value comparisons
Additionally, with any price we can convert nominal values into real values. For now this could be the price of a single good, the cost of a project, or any other amount from a single year.
If we have amounts in each year, either of these calculations allow for direct comparisons. Let us go back to the example of a McDonald’s hamburger, which cost $0.15 in 1955 and $2.19 in 2020.
First we will use the CPI as the price index. The CPI values for those two years are 26.80 and 258.86, respectively.
A helpful hint for which value to divide by and which to multiple by is to consider the units. If we start in 1955 dollars we need to divide by an index in 1955 dollars, which cancels out those units. Then multiplying by an index in 2020 dollars leaves the units at 2020 dollars.
We also could compare the growth rates of the CPI and the hamburger.
So the hamburger price grew at a faster rate than the overall price level. This means that it was relatively more expensive in 2020 compared to 1955. We could also say that it was relatively cheaper in 1955 compared to 2020.
We can also use the GDP deflator, which was 13.80 in 1955 and 105.36 in 2020.
No matter which conversion we choose the price is higher in 2020 price is higher. So the price is relatively more expensive, in 2020 compared to 1955.
A small cautionary note. Although we reach the same conclusion this time, we are not guaranteed to reach the same conclusion for a CPI calculation and a similar GDP deflator calculation.
Final thoughts
Here are a few facts that connect these concepts to how they are reported on in the news and used in the real world. These purely for personal enrichment, and not things that will feature in the AP Macroeconomics exam.
The first is the concept of core inflation. This is defined to be inflation minus food and energy. That is because food and energy specifically are more prone to shocks, such as weather or supply interruptions. Core inflation can be considered to be the inflation that is potentially “controllable” with monetary policy.
The second is that the Federal Reserve measures inflation using a measure we have not yet discussed. They use the Personal Consumption Expenditures deflator, often shortened to PCE deflator. This is calculated using the methodology of the GDP deflator, but only for the consumption portion of GDP.
So it looks at actual consumption spending, unlike the CPI, for goods regardless of where they are made. So exported goods will be ignored and imports purchased by households will be included.