



Gross domestic product
Another of the College Board’s Big Ideas is economic measurement. In macroeconomics a key example of this are headline numbers, single values that by themselves give key information about the performance of the economy. To that end we will build up discussions of such measures of income, production, spending, employment, and inflation.
Our starting point is national income and product accounting, thinking of how we could measure total income or production for an entire country. As a reminder, we are still thinking of a closed economy, one where there is no trade across borders in goods, services or financial flows.
We will benefit heavily from keeping the circular flow model in mind and taking the final result from the previous subchapter. Income, spending and production are all identical when added up. Our most important measure of this, the headline economic measurement, is gross domestic product.
Gross domestic product
Let us explore some key words in this definition.
- Aggregate : an adding up individual transactions
- Final goods and services : goods and services sold to consumers
- Within a country’s borders : location of sales rather than who is buying or selling
- In a given time period : generally yearly
To emphasize, citizenship is not important for GDP, only where economic activity is performed. Foreigners working in the US or foreign companies producing in the US count for US GDP the same as US citizens working or production from a US company. Similarly, if US citizens work in another country or a US company produces in another country, that would count for the other country instead of the US.
A desire to only include final goods leads to a need for accounting. The main goal of all of this is to avoid double counting any single transaction. This could occur if we count items such as raw materials used in production and what they are used to make, or items that have already been sold before.
Here is a short list of transactions that are not included in GDP
- Intermediate goods and services
- Used goods
- Non-market transactions
- Non-market goods and services
Intermediate goods and services must be used up completely in the process of making a different good. This could be raw materials, pieces or parts. Their value is included, as a part of the value of the final good or service they are made with.
As an example, the value of a tire that is used to make a car is already included in the final value of the car. Thus we have no need to count any tire that is bought as long as it is put into a new car. The need for conditions should also make it clear that items can be both intermediate and final goods. If a consumer buys a new tire, that would count for GDP. What makes something a final good is who it is sold to more so than what the good “is.”
Used goods have already been counted in GDP in some previous year, so they never count again. Examples of this include every purchase at a thrift store or garage sale, and many online purchases at places such as eBay or Facebook Marketplace. Used services do not really make much sense, although something like a certificate for a haircut could be re-sold.
This does include used cars and used houses, which will be most house purchases. An odd small detail is that many used good transactions do include an amount of new services. Most house sales, used or new, will include payments for things such as inspections and fees for real estate agents. Those do count for GDP, just not the value of the good being sold, the house price in this case.
Non-market transactions cover any sale of a good or service that does not involve a monetary transfer or take place in a formal market. Black market and other criminal activities are not counted, and in some countries this represents a significant portion of overall economic activity. Informal markets include volunteer work, household labor and barter, the direct trade of goods. Critically, this means that work you do for yourself does not count, even if you could have paid someone to do it.
This does lead to some awkward outcomes. If you pay someone to cook for you, GDP goes up. If you cook the same meal for yourself, GDP does not change. This is in spite of the fact that the same amount of physical work is being done. In reverse, if you used to pay someone to cook your meals and you teach yourself to cook and stop doing that, it technically lowers GDP. Again, the same amount of physical activity is being done in both cases.
If non-market transactions are things that could be bought or sold on a market, but that are exchanged in a way that is not tracked, non-market goods and services are things that generally cannot be paid for directly. This includes things that are clearly worth something, such as benefits from the environment. Things such as clean air, wild animals and good weather. Weather could also be a “bad” that is not captured by GDP, particularly if we think of natural disasters. Damages can be valued in terms of what it costs to repair things, but that does not include any frustration or physical harm. If someone dies, that does not directly show up in GDP.
These issues highlight the imperfectness of GDP, as a lot of little everyday activities and exchanges simply cannot be measured accurately. GDP is not a measure of national happiness, nor is it a measure of national wealth. When we divide GDP by population, per capita GDP, then it becomes an imperfect measure of how “rich” a country is. This exact idea will be explored later, when we discuss economic growth.
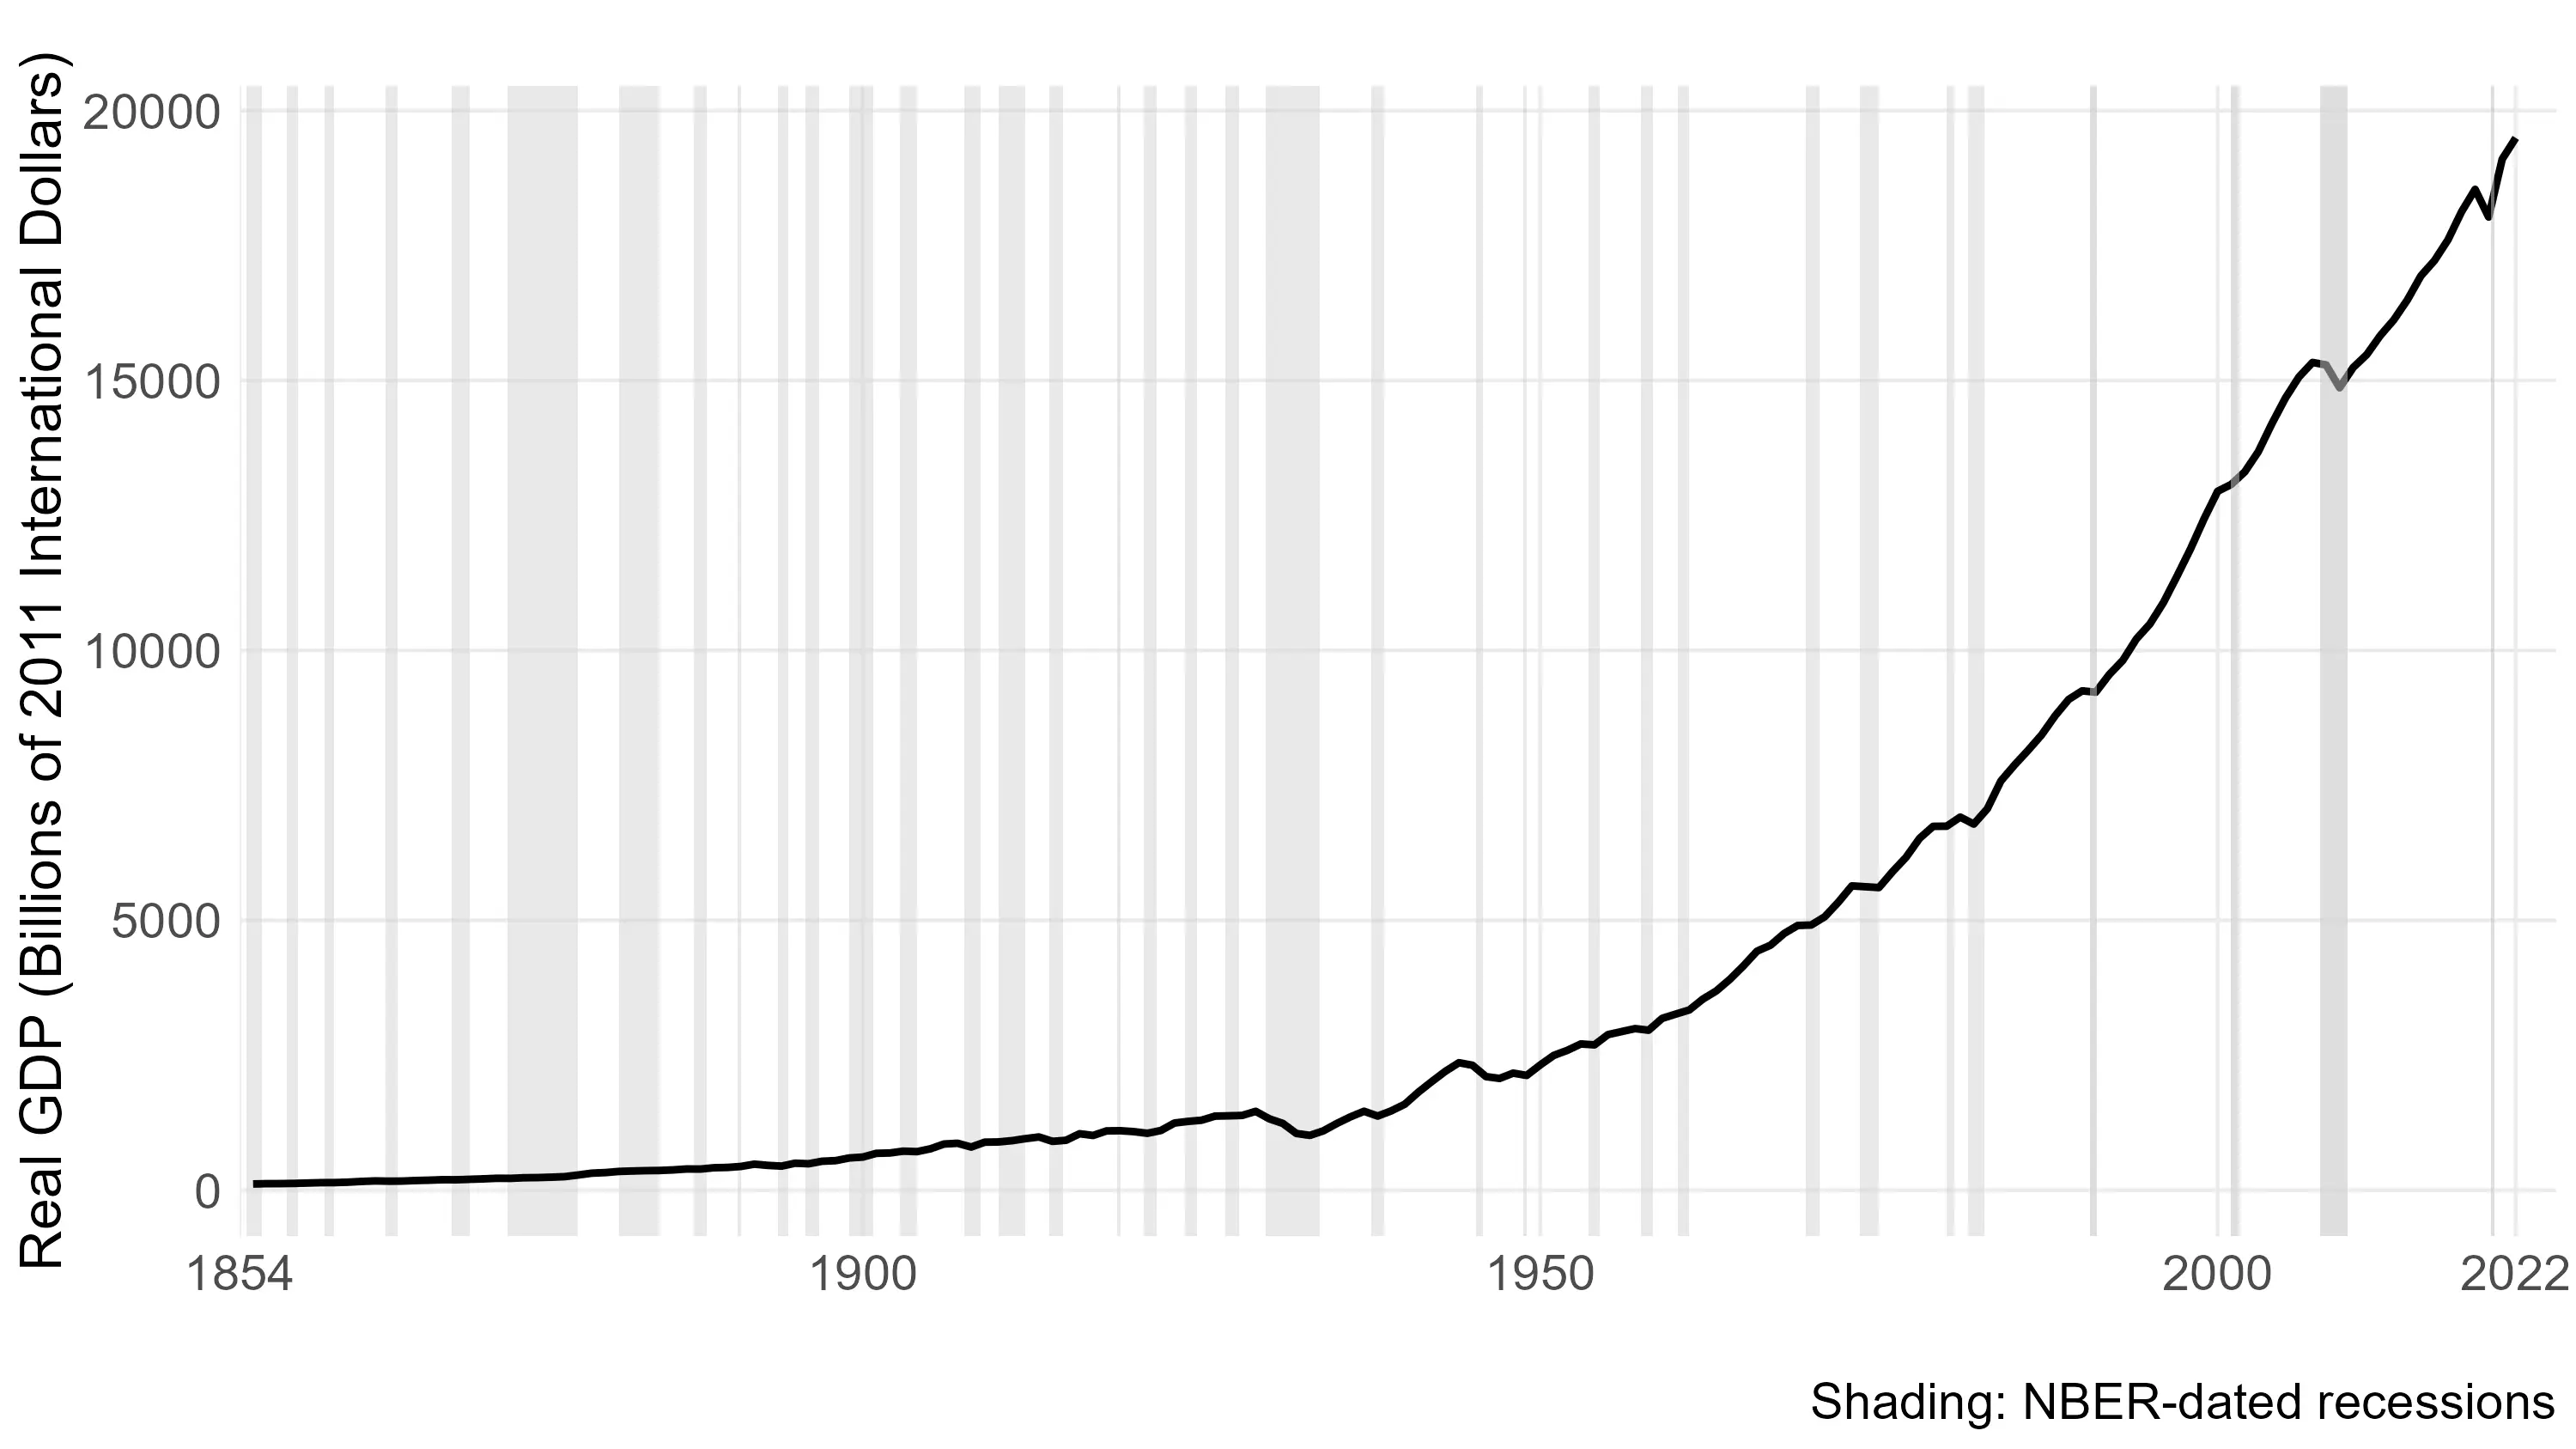
Just to give some perspective, below is a historical chart showing real GDP for the United States since 1854. The shaded periods indicate recessions, an economic phenomenon that we will discuss in the subchapter titled Business Cycles.
Real and nominal values
Related to the adjustment of gross values to get net values, is the relationship between real values and nominal values. Nominal values are unadjusted, generally measured in dollars of the year the data is collected. Nominal GDP is equivalent to adding up the sticker price of every new good and service sold in a calendar year.
However, there is a problem with this. If nominal GDP is higher than the year before, there are two possibilities: either we produced more goods and services or prices went up. What we want is a way to know if more was actually produced.
The solution is to make an adjustment that “takes out” price changes, leaving us with a measure of the amount of goods and services produced. That is real GDP. The exact details of how this adjustment is done will be covered in a future subchapter. For now the main point to understand is that real values allow us to make fair comparisons across years. Real values are valued in the dollars of a reference year, also called the base year.
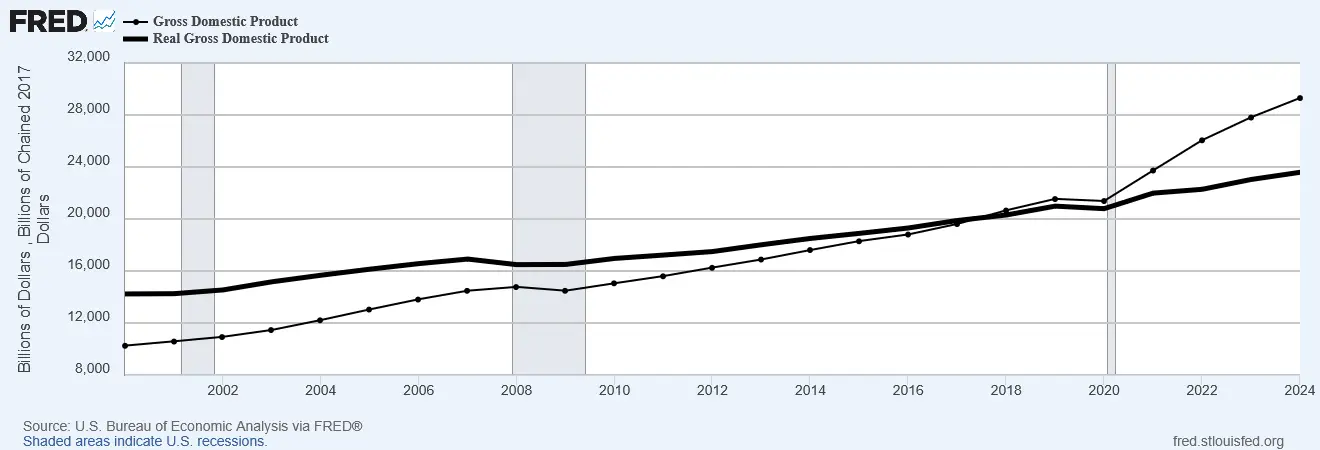
As an example, the graph below shows nominal and real GDP for the United States since the year 2000, measured in 2017 dollars.
Nominal and real values are always equal in the base year and if prices are always rising, then real values will be higher than nominal values before that year and lower than nominal values after that year.
Recently one odd outcome did occur, that really highlights the relationship between the two. In the first quarter of 2022, real GDP went down while nominal GDP went up. How can this happen?
Answer: Production falls, but prices rise by enough to overcome that.
For aggregate measures, for example the components of GDP that will be outlined in detail in the next subchapter or parts of the government budget as will be discussed later, there is a shortcut that avoids complicated mathematics. In those cases it may be enough to divide a nominal value by nominal GDP. Expressing aggregate values as a percentage of GDP allows for fair comparisons, either across time or to other components in the same year.
Another benefit of this is that it turns large numbers into percentages, which are often easier to connect to models and interpret.