Update it, or open this page in a current version of Chrome, Safari, Firefox or Edge. On an iPhone or iPad, update iOS: every browser there runs on the version of Safari that comes with it.
2.4 Unemployment
Achievable AP Macroeconomics
2. Measurement of economic performance
Our AP Macroeconomics course is currently in development and is a work-in-progress.
GDP is a versatile measure, representing spending, income and production, but it is only one of our headline economic numbers. Another dimension is captured in thinking about aggregate labor markets. How many people are working or not working could be measures, but these will often rise over time purely due to population growth.
What we would like to build up to is something closer to a real measure, the percentage of the available population that is working or not working. As a convention, we focus on the percentage of the available population that is not working.
To end up with this we need to develop specific definitions with clearly outlined adjustments to total population. These are critical for us to calculate our measures and interpret them correctly. Data for the United States is collected from two different surveys, which will be briefly described at the end of the subchapter.
Who “counts” for labor statistics?
As a starting point we begin with the total population. Not everyone in the population is able to work. The simplest cut is due to age. Because of labor laws, we disinclude everyone below the age of 16. We also have to take away people who practically cannot work. That includes people in active-duty military and people in institutions. These include prisons and nursing homes. Everyone who remains is the civilian noninstitutional population.
We need to divide the civilian noninstitutional population into some key groups that will allow us to achieve our headline numbers.
In one sense this classification is quite rigid. Any qualifying activity overrules any non-qualifying activity. For example, part time employment as a student places that individual in the labor force. And if you have a job but are looking for a better job or already have a second job, you simply count as employed.
However, that also means that who is included as employed is quite broad. Working one hour part-time counts the same as working a full 40 hour week. Being employed says very little about personal circumstances and success.
The connections between these definitions can be summarized by the following equations.
Civilian nonLabor forceinstitutional population=Labor force + Out of the labor force=Employed + Unemployed
Headline numbers
Now we present our two headline numbers regarding aggregate labor markets.
Labor force participUnemployment rate (U3)ation rate=Civilian noninstitutional populationLabor force=Labor forceUnemployed
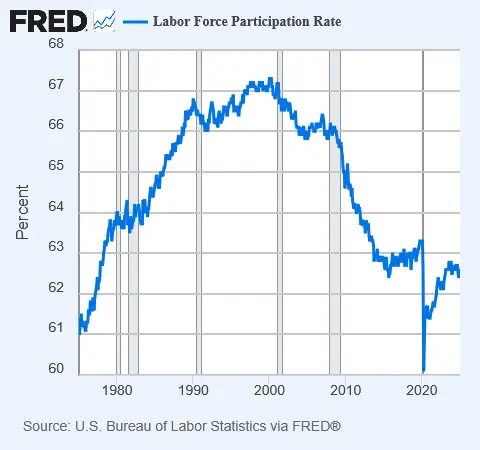
The labor force participation rate gives us the percentage of the available population that is willing to work at present. Due to structural changes the rate rose to a high of just over 67 percent in 2000. Since the COVID-19 recession in 2020 the labor force participation rate for the entire United States population has been mostly between 62 and 63 percent.
Our second value is the unemployment rate, the fraction of available and willing workers who do not currently have a job. It is important to remember that it is not the fraction of the population who do not have a job. The standard measure is referred to as U3. It has been collected for many years and thus has something valuable to say about labor market performance and the aggregate employment situation.
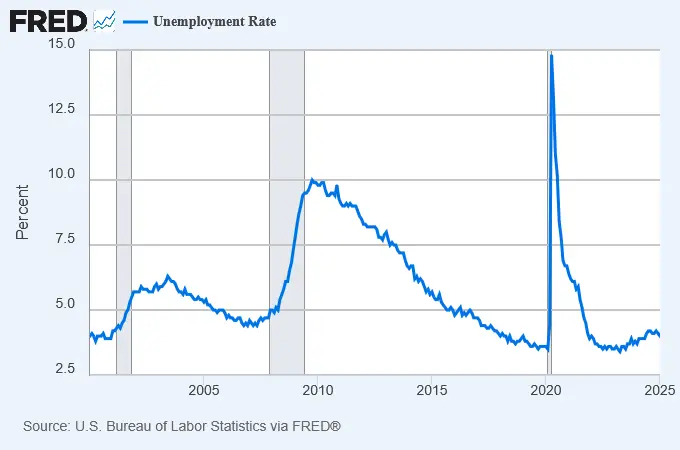
The graph below shows the unemployment rate for the United States this century, ending in January of 2025.
However, many people are “missing” from this definition and because of that other measures are available.
Some additional unemployment measures add these types of workers to the labor force and unemployed. There are also adjustments for those with part-time jobs who wish they had full time jobs. You are not responsible for knowing any details about these measures, it is simply good to be aware that deeper information about the employment situation is available beyond the standard unemployment rate.
Types of unemployment
Returning to the standard unemployment measure, next we separate unemployed workers depending on the reason they do not have a job.
Labor Market Concepts
GDP measures spending, income, and production; labor market stats provide another economic dimension
Focus on percentage of available population working (labor force participation rate) and not working (unemployment rate)
Adjustments to total population are critical for accurate measurement
Labor Force Definitions
Civilian noninstitutional population: total population minus under 16, active-duty military, institutionalized
Labor force = Employed + Unemployed
Out of the labor force: not working and not actively seeking work (e.g., students, discouraged workers)
Employment Status
Employed: worked at least 1 hour in past 4 weeks (includes part-time)
Unemployed: no job, actively looked for work in past 4 weeks
Classification is rigid (any employment counts as employed), but broad (1 hour = full employment status)
Key Labor Market Equations
Civilian noninstitutional population = Labor force + Out of the labor force
Labor force = Employed + Unemployed
Headline Labor Market Numbers
Labor force participation rate = Labor force / Civilian noninstitutional population
Unemployment rate (U₃) = Unemployed / Labor force
U₃ does not include all jobless individuals (e.g., discouraged workers)
Additional Worker Categories
Marginally attached workers: not in labor force, but looked for work in past year
Discouraged workers: stopped looking due to belief no jobs are available (subset of marginally attached)
Types of Unemployment
Frictional: temporary, due to transitions (e.g., moving, job switching)
Structural: mismatch between skills/location and job requirements
Cyclical: caused by business cycle fluctuations (recessions, expansions)
Natural Rate of Unemployment
Natural rate = (Structural + Frictional) / Labor force
Represents non-cyclical unemployment (approx. 4–5% in U.S.)
Full employment: unemployment rate equals natural rate
Measurement of Labor Data
Current Employment Statistics survey: business survey, tracks nonfarm payrolls
Current Population Survey: household survey, calculates unemployment rate and demographic breakdowns
Both conducted monthly by Bureau of Labor Statistics
GDP is a versatile measure, representing spending, income and production, but it is only one of our headline economic numbers. Another dimension is captured in thinking about aggregate labor markets. How many people are working or not working could be measures, but these will often rise over time purely due to population growth.
What we would like to build up to is something closer to a real measure, the percentage of the available population that is working or not working. As a convention, we focus on the percentage of the available population that is not working.
To end up with this we need to develop specific definitions with clearly outlined adjustments to total population. These are critical for us to calculate our measures and interpret them correctly. Data for the United States is collected from two different surveys, which will be briefly described at the end of the subchapter.
Who “counts” for labor statistics?
As a starting point we begin with the total population. Not everyone in the population is able to work. The simplest cut is due to age. Because of labor laws, we disinclude everyone below the age of 16. We also have to take away people who practically cannot work. That includes people in active-duty military and people in institutions. These include prisons and nursing homes. Everyone who remains is the civilian noninstitutional population.
We need to divide the civilian noninstitutional population into some key groups that will allow us to achieve our headline numbers.
In one sense this classification is quite rigid. Any qualifying activity overrules any non-qualifying activity. For example, part time employment as a student places that individual in the labor force. And if you have a job but are looking for a better job or already have a second job, you simply count as employed.
However, that also means that who is included as employed is quite broad. Working one hour part-time counts the same as working a full 40 hour week. Being employed says very little about personal circumstances and success.
The connections between these definitions can be summarized by the following equations.
Civilian nonLabor forceinstitutional population=Labor force + Out of the labor force=Employed + Unemployed
Headline numbers
Now we present our two headline numbers regarding aggregate labor markets.
Labor force participUnemployment rate (U3)ation rate=Civilian noninstitutional populationLabor force=Labor forceUnemployed
The labor force participation rate gives us the percentage of the available population that is willing to work at present. Due to structural changes the rate rose to a high of just over 67 percent in 2000. Since the COVID-19 recession in 2020 the labor force participation rate for the entire United States population has been mostly between 62 and 63 percent.
Our second value is the unemployment rate, the fraction of available and willing workers who do not currently have a job. It is important to remember that it is not the fraction of the population who do not have a job. The standard measure is referred to as U3. It has been collected for many years and thus has something valuable to say about labor market performance and the aggregate employment situation.
The graph below shows the unemployment rate for the United States this century, ending in January of 2025.
However, many people are “missing” from this definition and because of that other measures are available.
Some additional unemployment measures add these types of workers to the labor force and unemployed. There are also adjustments for those with part-time jobs who wish they had full time jobs. You are not responsible for knowing any details about these measures, it is simply good to be aware that deeper information about the employment situation is available beyond the standard unemployment rate.
Types of unemployment
Returning to the standard unemployment measure, next we separate unemployed workers depending on the reason they do not have a job.