Area between curves
Recall that a definite integral represents the signed area between a curve and the -axis. To find the area between two curves, imagine slicing the region into infinitely thin rectangular strips. For each rectangle, the distance between the two functions represents its length, while represents its infinitesimal width.
-
If the slices are vertical (parallel to the -axis), integrate with respect to .
-
If the slices are horizontal (parallel to the -axis), integrate with respect to .
Vertical slices (-limits)
If a function is always above across the entire interval , the area of the region is defined as:
Example 1
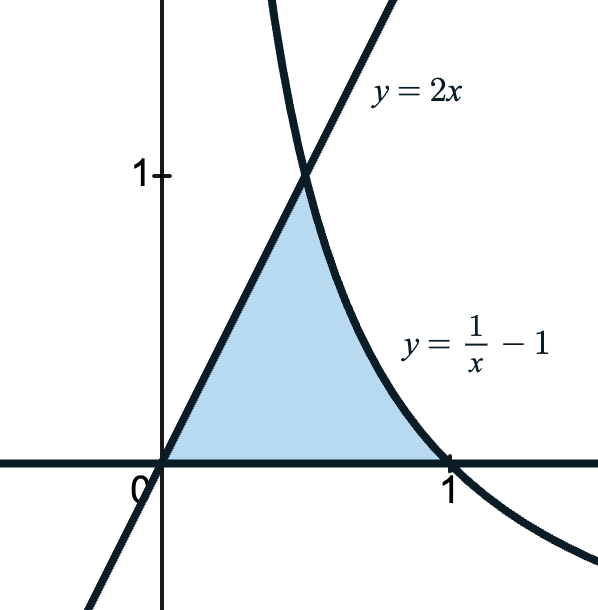
Find the area of the region bounded by and .
Solution
1. Find the boundaries:
Set the equations equal to find their intersection points.
The curves intersect at and .
2. Identify Top vs. Bottom:
Test a point between and . At , the line is at and the parabola is at . So the line is the top function.
3. Set up and integrate:
Example 2
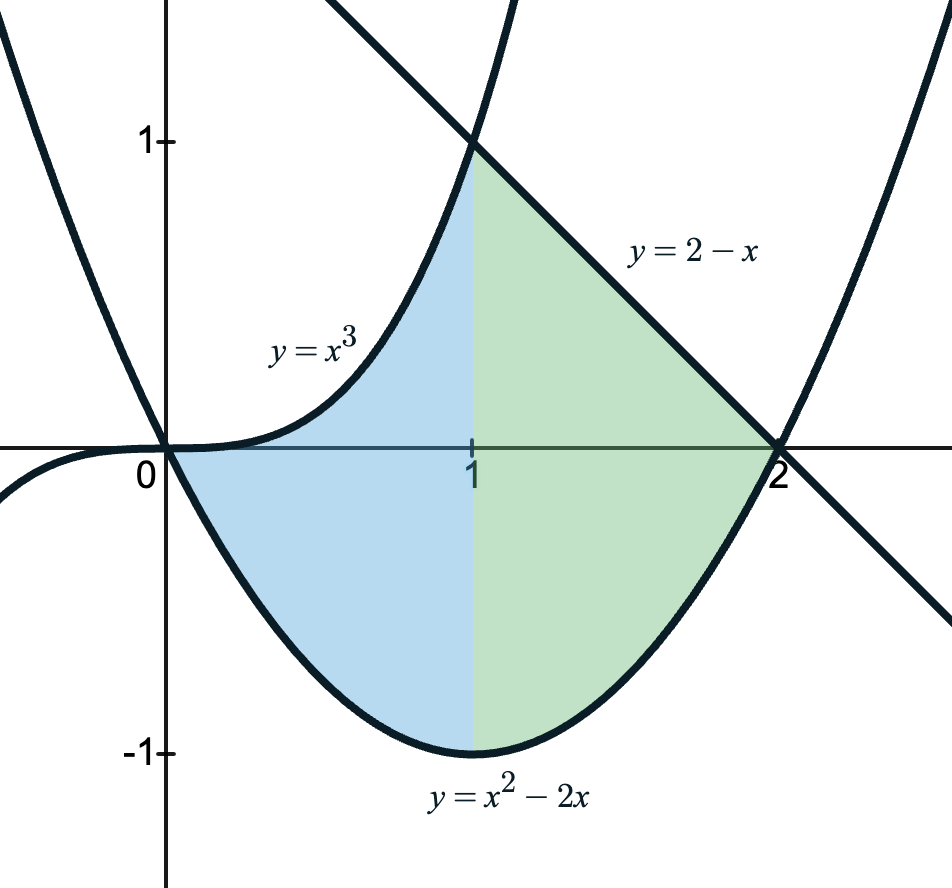
Find the area of the region bounded above by the curves and and below by .
Solution
Shown is the region described in the problem:
Because the upper boundary changes its formula halfway through the region, the area must be split into two separate integrals at the intersection point :
-
Blue region : sits above .
-
Green region : sits above .
Horizontal slices (-limits)
Sometimes it’s simpler to slice the region horizontally and integrate with respect to . For example:
The “top” and “bottom” functions change partway through:
-
On , the region is bounded only by the parabola . Written as -functions:
- Top:
- Bottom:
-
On , the line sits above .
The area can be found with the integral:
But instead of looking top-to-bottom, orient your perspective from right-to-left. Given two curves expressed as functions of , where across the interval :
Example 3
Let’s redo the problem presented above.
Find the area of the region bounded by and .
Solution
1. Convert to functions of :
Solve the linear equation for .
2. Find the -boundaries:
Set the functions equal to locate the intersection points.
The region is bounded from to .
3. Identify Right vs. Left:
When a graph is not given, test points - on the interval , testing gives for the line and for the parabola. So the line is on the right.
4. Set up and integrate:
Example 4
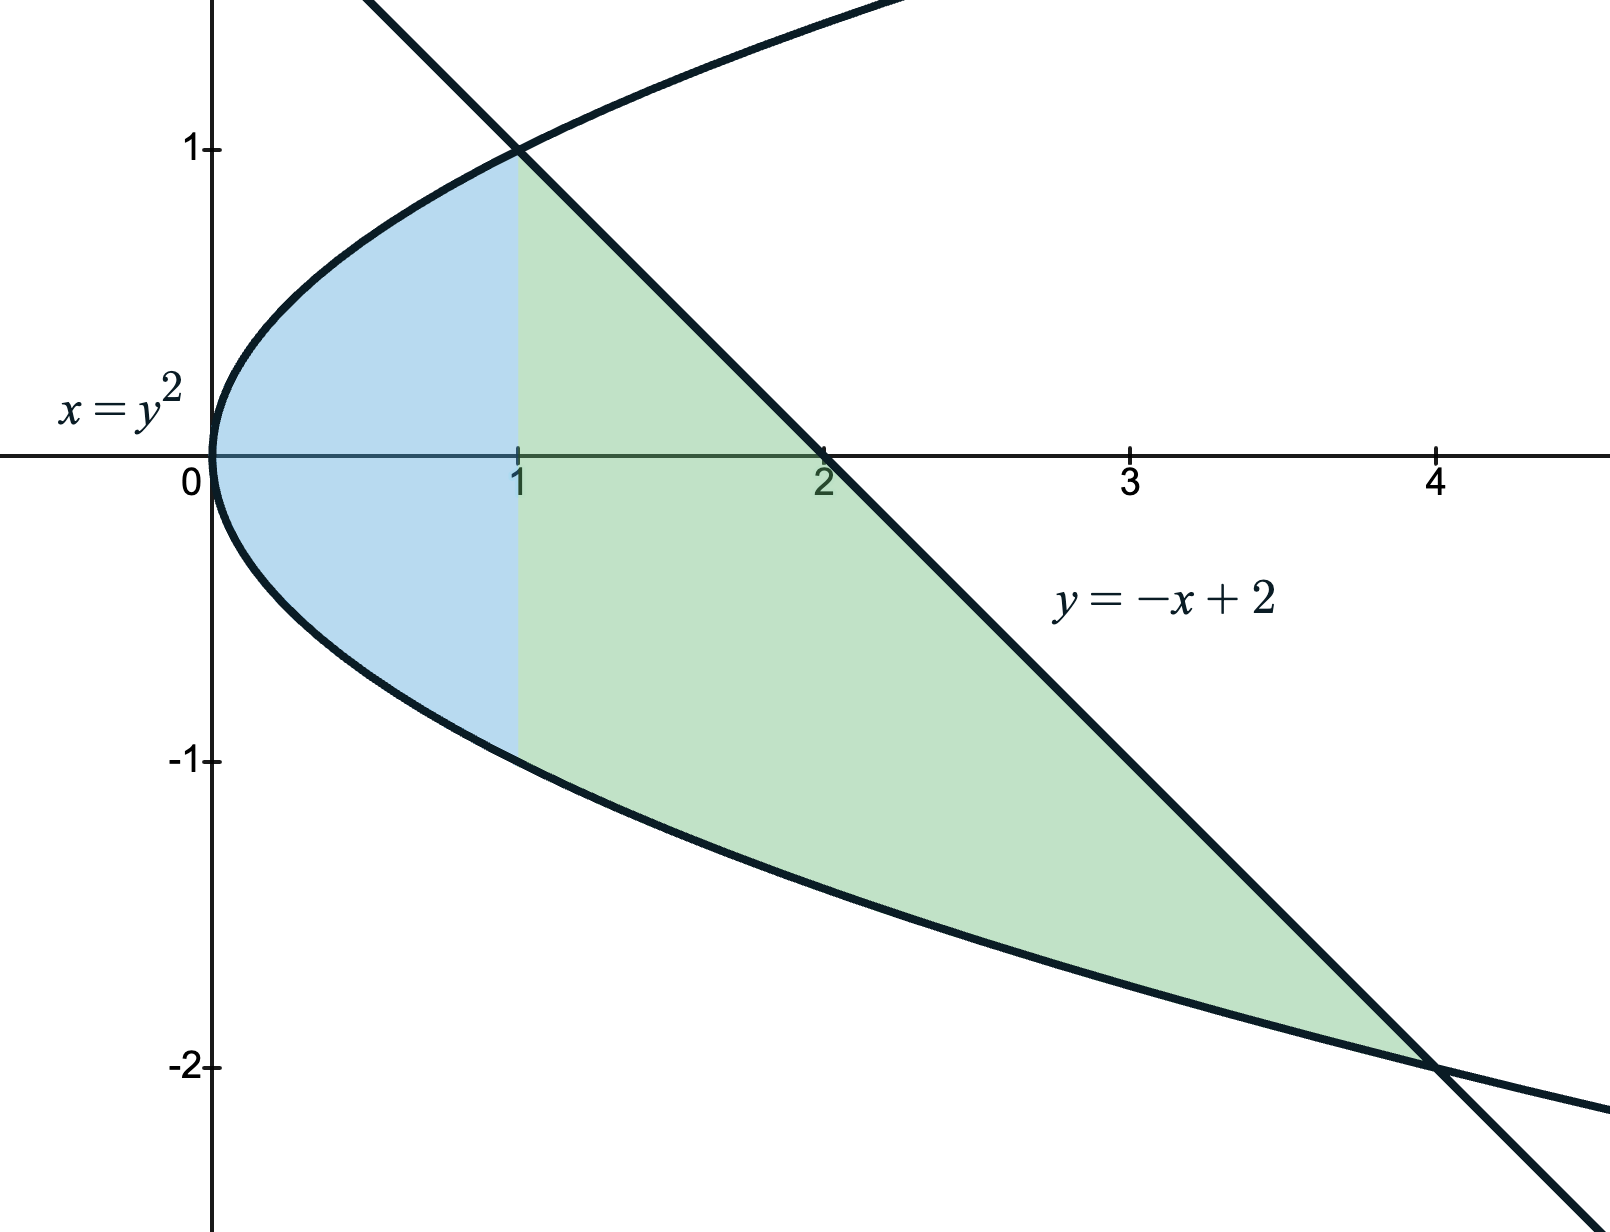
Let be the region bounded below by the -axis and above by and . Find the area of using both slicing orientations.
Solutions
a) Vertical slices ()
Region is as shown:
We must split the region at the intersection point :
- On , the top boundary is .
- On , the top boundary is .
- For both, the “bottom function” is (the -axis).
b) Horizontal slices ()
Solve both equations for to look right-to-left:
- (Left curve)
- (Right curve)
The -boundaries span from the -axis () up to the intersection point ().
Multiple intersections
Over an interval, functions can switch roles: a curve that starts on top may end up on the bottom (or a left curve may become the right curve). To calculate the area, split the integral at each intersection point.
Example 5
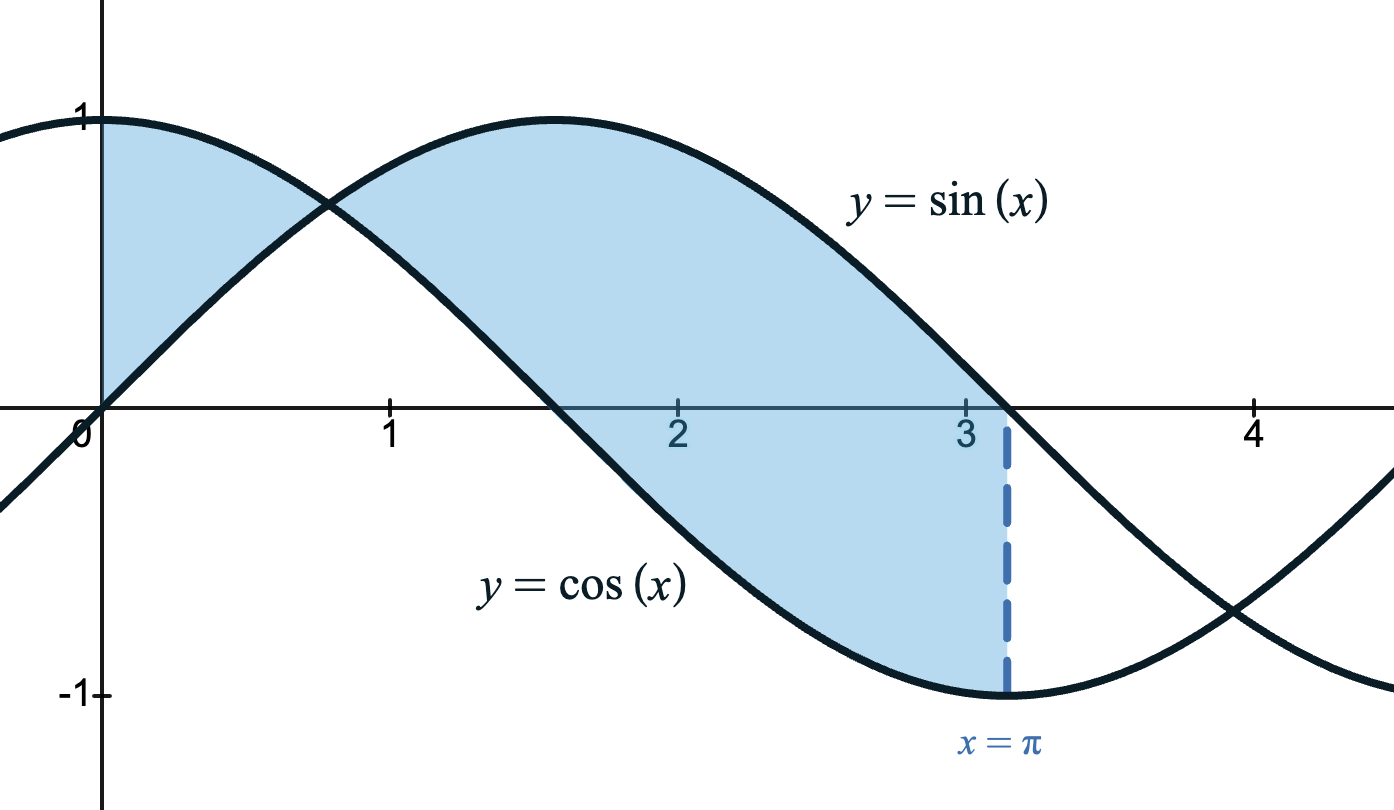
Find the area of the region bounded by and from to .
Solution
On the interval , the curves meet at .
-
On , is on top.
-
On , is on top.
Set up two distinct integrals: