Concavity
Once you’ve found a critical point where , you can often bypass a full sign chart for by using the 2nd derivative test to classify extrema.
2nd derivative test for extrema
Each critical point can be classified by evaluating the sign of the 2nd derivative at the point, :
-
Relative minimum: If , then is concave up.
- Visual cue: The curve is shaped “like a cup.”
-
Relative maximum: If , then is concave down.
- Visual cue: The curve is shaped “like a frown.”
-
The test is inconclusive if or is undefined.
- Use the 1st derivative test to classify the point.
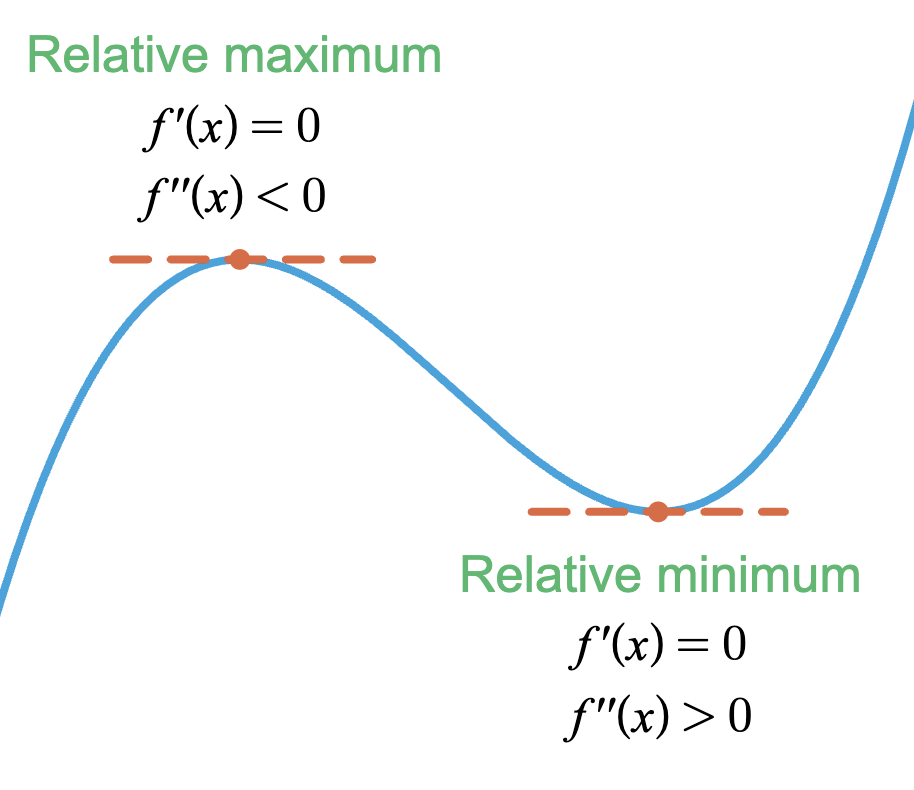
As shown in the diagram below, a horizontal tangent line combined with the graph’s shape determines whether the point is a peak (relative maximum) or a valley (relative minimum).
Example 1: Classic problem
Classify the extrema of
using the 2nd derivative test.
Solution
The 1st derivative is
To find the critical points, set equal to :
Now apply the 2nd derivative test. The 2nd derivative is
Evaluate each critical point:
Classify each:
-
Since , is concave down at , so it is a relative max.
-
Since , the test is inconclusive. Using the 1st derivative test,
| Interval | Sign of |
|---|---|
Since changes from negative to positive, there is a relative min at .
In this particular case, the 1st derivative test alone would have been straightforward. However, for more complicated exponential or trigonometric functions, the 2nd derivative test is often more efficient since it avoids interval testing altogether.
Example 2: Using your calculator
The derivative of a function is given by
Find all critical points of and use the 2nd derivative test to classify them as relative maximums or relative minimums.
Solution
Critical points of occur where or is undefined.
As a calculator-active question, you can simply define the given derivative of as a separate function in Desmos by typing the following:
Since , note where the graph of crosses the -axis, which is where . These are the critical points of .
Because , then differentiating gives the 2nd derivative of i.e. .
Instead of differentiating by hand, you can use Desmos to evaluate the 2nd derivative at your critical points automatically. Simply type these two lines:
which results in:
Analysis:
-
Since , then is a relative maximum of
-
Since , then is a relative minimum of .
Note that to use the 1st derivative test to classify extrema on given the derivative , simply observe the graph of at the critical points. For example, at , the graph of changes from positive to negative, confirming that has a relative maximum at that critical point.
Example 3: Conceptual problem
Let be a twice-differentiable function such that .
Let function be defined by
If and , classify the extrema of at .
Note: The phrase “twice-differentiable” simply means that both and exist.
Solution
To classify the extrema at , we need to apply the 2nd derivative test and determine the sign of . Differentiating with the chain rule,
We can confirm that is a critical point since (given that ).
Next, differentiate . using the product and chain rules:
Challenge problem
A curve has its derivative given by:
If the line is tangent to the graph, determine all points of tangency and classify each as a relative maximum, relative minimum, or neither.
Solution
1. Find potential points of tangency:
The curve meets , which is a horizontal tangent line with slope . Therefore, at any tangency points , we must have
The first derivative
is when the numerator equals :
and are both points where the tangent line could be horizontal.
2. Find the 2nd derivative:
Differentiating implicitly,
3. Classify the points with the 2nd derivative test:
At any point of horizontal tangency, and . This eliminates the entire trailing term in the numerator:
Substitute each candidate point into this simplified expression:
- For :
Since , the curve is concave down and is a relative maximum.
- For :
Since , the curve is concave up and is a relative minimum.