Figure questions
Single-figure questions
On the science test, a figure is any graph, chart, table, diagram, or other image related to the passage. Many of the simpler Science questions ask you to look at just one figure to find the answer.
Figure themes
Start by making sure you’re using the correct figure. This sounds obvious, but it’s easy to lose track when a passage includes several figures.
- Many questions tell you exactly which figure to use.
- Other questions don’t name a figure directly, but they include clues that match only one figure.
In those cases, look for a shared theme between the question and the figures. For example, if the question asks about volume and only one graph shows volume, that’s the figure you should use.
A figure can include so much information that it feels overwhelming. The key is that you often don’t need all of it. Instead, focus on the part of the figure that matches what the question is asking.
For instance, a figure might list the mass, volume, density, and temperature of several chemicals. If the question asks about temperature, you can focus on the temperature values and ignore the other properties (at least for that question). This won’t work every time, but it’s a reliable habit: shine a spotlight on the exact place where the answer should be.
Figure details
Sometimes a figure includes extra information above or below it.
- Information above the figure usually describes what the figure is and is often unnecessary. Occasionally it’s useful, but that’s less common.
- Information below the figure often lists the source, so it’s easy to skip past it.
However, the test may place critical information below the figure, often marked with an asterisk (*). See the figure below for an example:
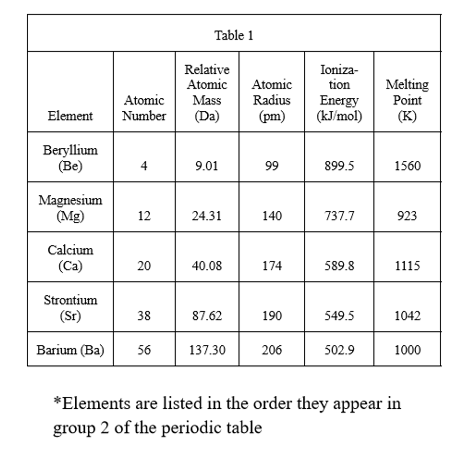
Be on the lookout for asterisks beneath figures, because they can contain information you need to answer the question.
Multiple-figure questions
Some questions require you to use more than one figure in the passage. This can get confusing, so keep track of which figures the question mentions, and make sure you use them all (or at least understand why the question includes each one).
Sometimes you can answer without using every figure because you’ve found a shortcut. If you take that shortcut, be clear about why it’s valid to ignore one or more of the figures. If you don’t have a solid reason, go back and try using all of the figures the question points you to.
Where to start
Choose your starting point based on the information the question gives you.
The hardest version of these questions can feel like a scavenger hunt: you have multiple figures and lots of data. Your main goal is to pick a clear starting point and work step by step.
Often, the question gives you enough information to find a value or conclusion from one figure. Once you’ve found that new piece of information, you use it in the next figure to reach the final conclusion.
Even if it seems like you already have enough information to solve the problem immediately, pick one figure to start with. If you get stuck, try switching and starting with the other figure instead.
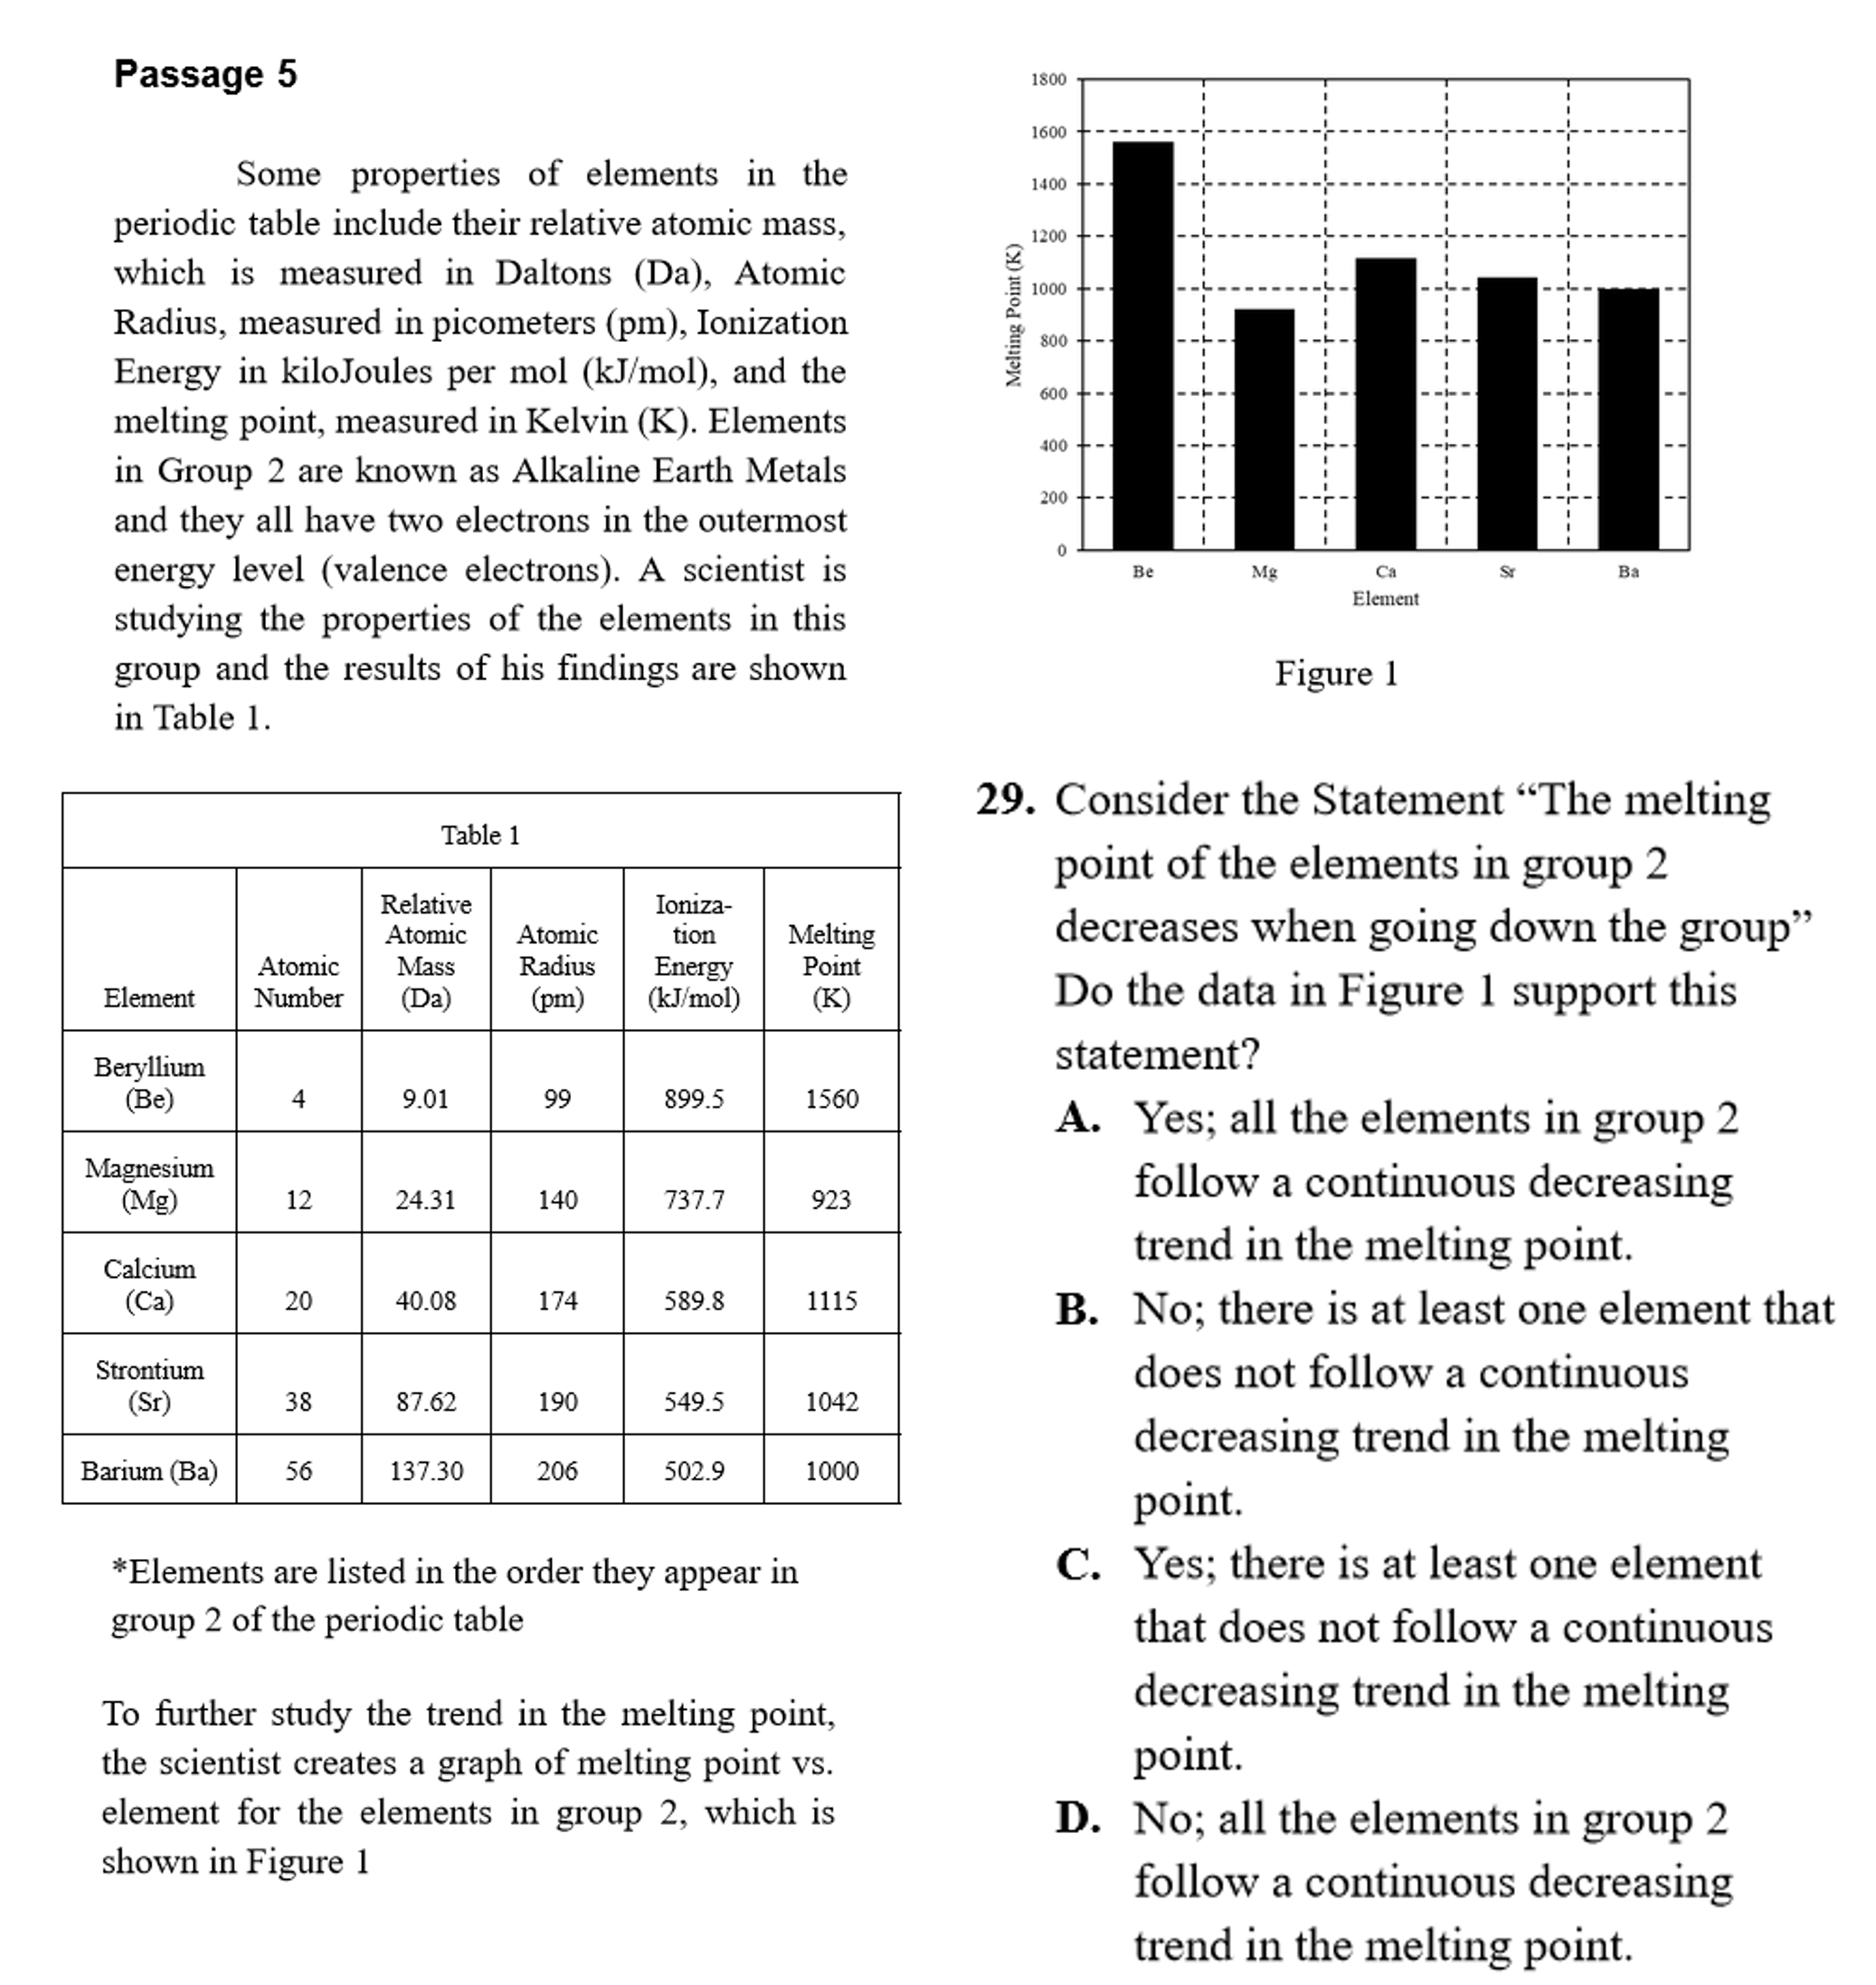
Below is an example of a multiple-figure question. Try to solve this question and identify the key elements that we’ve talked about so far.
Can you solve this question?
Answer: B.
We first look at Table 1 to determine the “order” of the group, since the question asks us about “going down the group.” We see that the order in Table 1 matches the order in Figure 1. This means that “going down the group” is equivalent to moving right across the x axis in Figure 1. The bar for Mg is lower than the bar for Ca, the one after it, so answer B best explains why the data do not support the statement in the problem.