Evolution and analytic methods in inheritance
Natural selection fitness concept
Natural selection and evolution
- In natural selection, genetic traits that improve survival or reproduction become more common over time. This happens through differential reproduction: organisms with beneficial traits tend to leave more offspring, so those advantageous alleles are passed on more often.
The ultimate measure of evolutionary success is an increased frequency of these alleles in the gene pool.
Speciation
Speciation can occur when populations become reproductively isolated. Over time, they accumulate genetic differences and diverge into distinct species.
Polymorphisms are multiple variants of a trait within a population. They often provide the raw material for adaptation. When certain polymorphisms are more advantageous in a particular environment, natural selection can favor them, leading to adaptations or specializations that fit specific niches.
Inbreeding - mating among closely related individuals - increases the chance that recessive (and potentially harmful) alleles will be expressed. Outbreeding increases genetic diversity, which can reduce the risk of harmful allele combinations.
Group selection proposes that traits benefiting the entire group can be favored - for example, warning behaviors that protect the group, or individuals reducing their own food intake so pregnant individuals or offspring can eat. In most evolutionary models, group selection is considered secondary to selection acting at the level of individuals.
Evolutionary time Over long spans, evolutionary time can be estimated by gradual, random genomic changes measured using molecular clocks. These changes accumulate across generations and can drive both subtle and dramatic shifts in populations and species.
Analytic methods in inheritance
Test cross: back cross and generational concepts
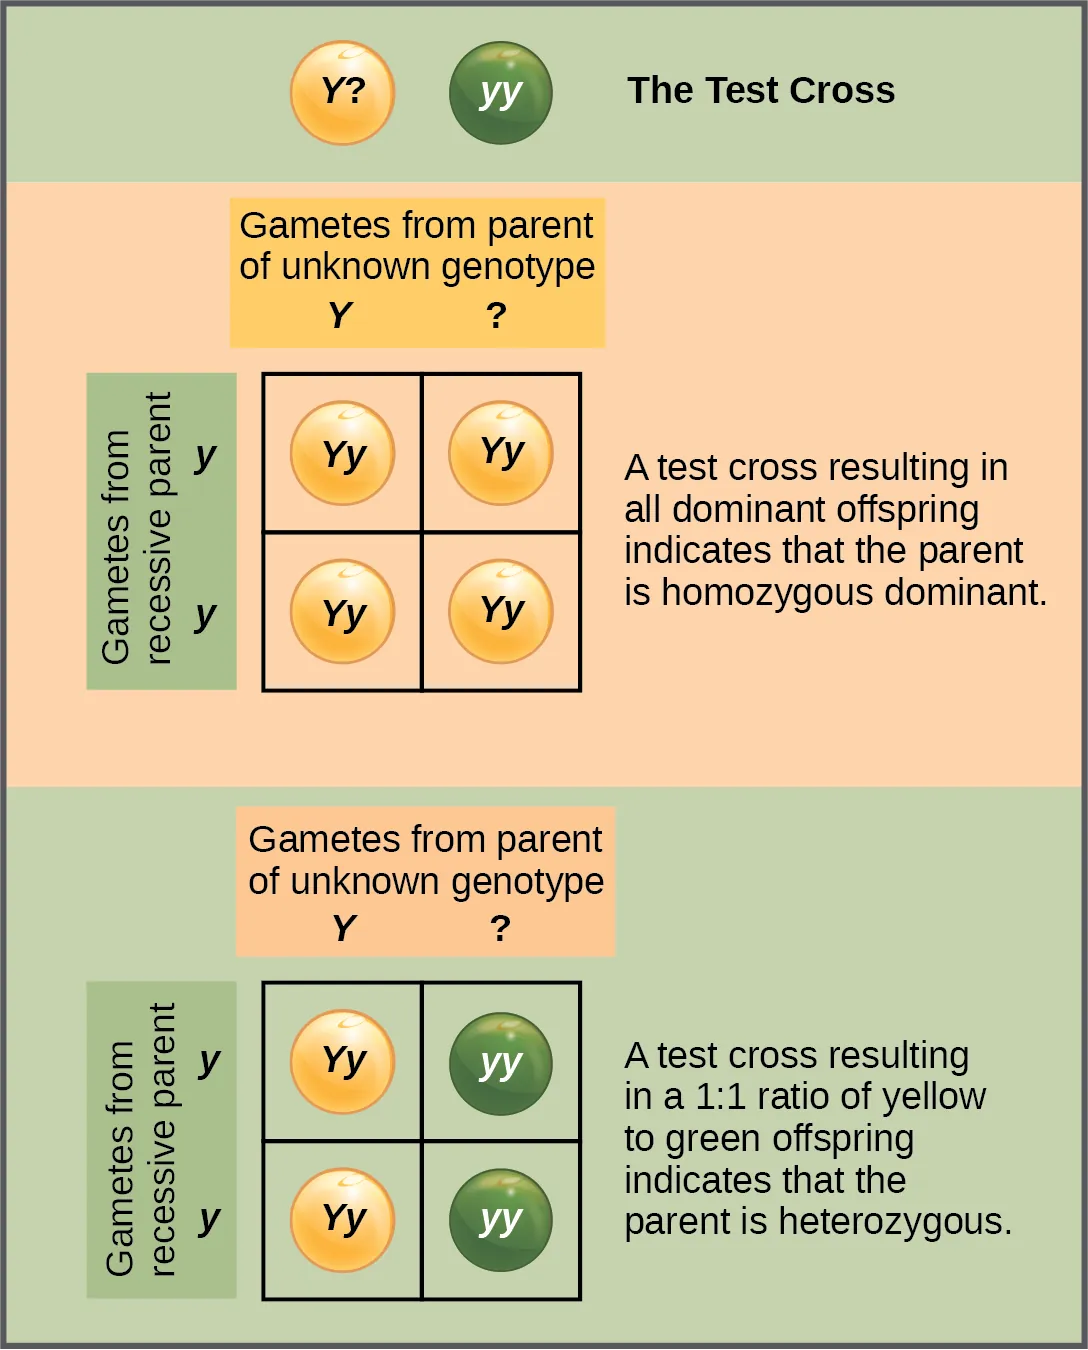
- A test cross helps you determine whether an organism with a dominant phenotype is homozygous (AA) or heterozygous (Aa). Cross the individual with a homozygous recessive (aa). If all offspring show the dominant trait, the genotype is likely AA. If about half show the recessive trait, the genotype is likely Aa.
- Back cross: Mating offspring back to one of the parents to preserve certain parental genotypes.
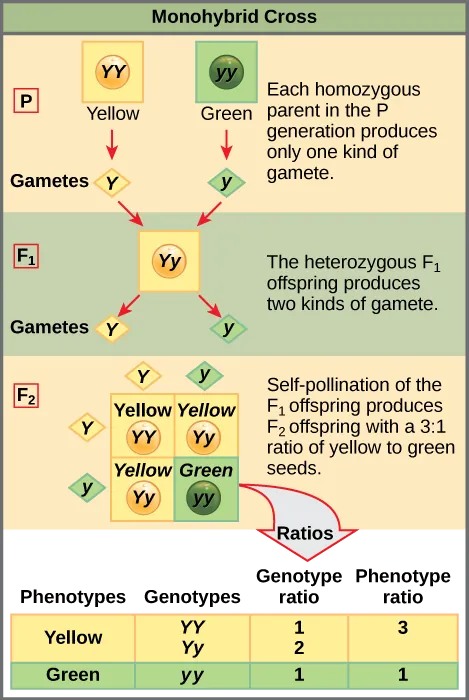
- P (Parental) Generation: Denotes the parent organisms in a genetic cross.
- F1 (First Filial) Generation: Offspring of the parental generation.
- F2 (Second Filial) Generation: Offspring of the F1, effectively the grandchildren of the original parents.
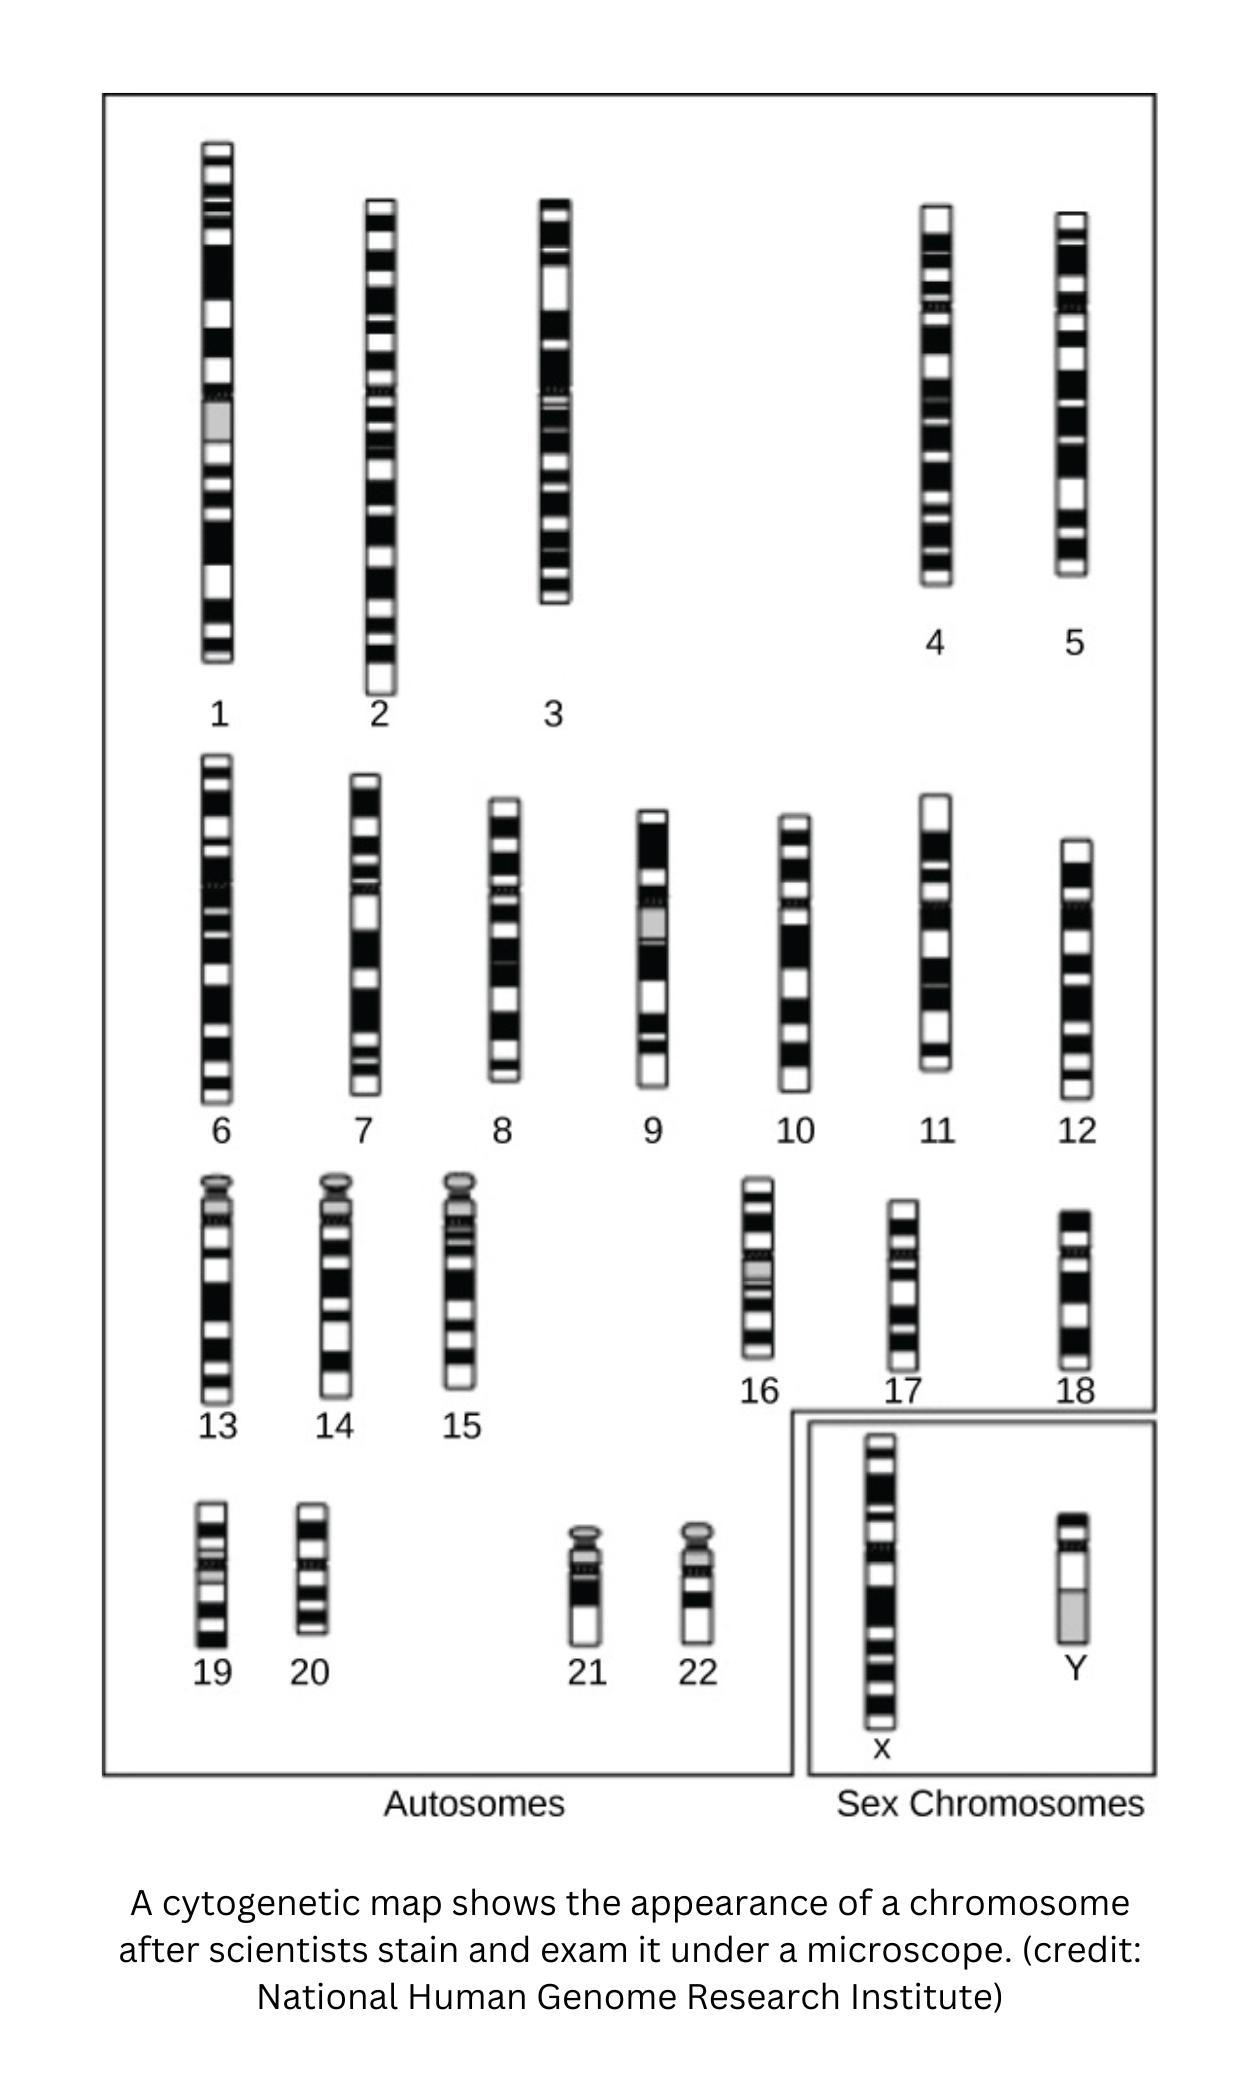
Gene mapping and crossover frequencies
- Gene mapping identifies the physical positions of genes on a chromosome. Whether two genes are inherited together depends on how close they are on the same chromosome.
- Genes that are far apart tend to have higher crossover frequencies, so they’re more likely to be separated by crossing over during meiosis. Genes that are close together are more likely to stay linked.
Biometric methods for data analysis
Biometry uses statistical tools to answer biological questions. It often starts with a null hypothesis, which states that no meaningful relationship or difference exists in the data. A value under 0.05 suggests rejecting the null hypothesis and concluding that a meaningful effect or relationship is likely present.
- t‑test: Compares means of two data sets.
- ANOVA: Extends this comparison to three or more groups.
- Fisher’s Exact Test: Analyzes categorical data in a 2×2 contingency table.
- Variance and Standard Deviation describe how widely observations spread around the mean, while Skew describes whether a distribution is asymmetrical.