Economic factors
The Federal Reserve’s dual mandate requires it to focus on encouraging economic growth and managing inflation levels. So how does the Fed know when action may be needed? Economists track a range of indicators, data sets, and market signals. This chapter covers:
- GDP/GNP
- Consumer price index (CPI)
- Yield curves
- Leading indicators
- Coincident indicators
- Lagging indicators
- Economic market structures
GDP / GNP
Economic growth is commonly measured by gross domestic product (GDP) or gross national product (GNP).
- GDP measures the value of all goods and services produced within a country’s borders. Economists often use it as a broad measure of domestic economic strength.
- GNP measures the value of all goods and services produced by a country’s residents, including production that occurs outside the country (for example, goods sold by a U.S. citizen temporarily living in Spain).
GDP and GNP are reported in constant dollars, meaning the figures are adjusted for inflation. This makes it easier to compare economic output across different time periods.
When GDP rises, more goods and services are being produced and sold, which signals economic growth. The faster GDP rises, the faster the economy is growing.
When GDP falls, fewer goods and services are being produced and sold, which signals economic distress. If GDP declines for an extended period, the economy can enter a recession or depression.
- A recession is two consecutive quarters (six months) of GDP decline.
- A depression is six straight quarters (a year and a half) of GDP decline.
When GDP declines, the Fed typically pursues loosening (expanding) policies to increase the money supply. As interest rates fall, borrowing becomes cheaper, which can lead consumers to buy more homes, cars, and other goods.
As a reminder, if the economy is shrinking, the Fed may take one or more of the following actions:
- Lower their discount rate
- Engage in repurchase agreements with banks
- Lower bank reserve requirements
- Lower Regulation T (margin rules)
Consumer price index (CPI)
The Federal Reserve follows the consumer price index (CPI) to gauge inflation levels. Each month, the U.S. Bureau of Labor Statistics tracks the prices of goods and services commonly purchased by consumers, including gasoline, groceries, cell phone contracts, and real estate.
- If prices rise on average, CPI rises.
- If prices fall on average, CPI falls.
When CPI rises more than expected, the Fed pays close attention. Inflation can be a side effect of loosening policy: if the Fed increases the money supply too much, inflation may rise.
When inflation is rising, the Fed may use one or more tightening (contracting) policies to reduce the money supply and manage inflation:
- Raise the discount rate
- Engage in reverse repurchase agreements with banks
- Raise bank reserve requirements
- Raise Regulation T (margin rules)
These actions reduce the money supply, which tends to push interest rates higher. Money behaves like other goods: when it’s scarcer, it becomes more expensive to borrow. Higher interest rates typically reduce borrowing and spending, which can help stabilize prices over time.
Yield curves
Federal Reserve actions strongly influence the bond market. One way to track changing conditions is through yield curves, which show yields for similar debt securities across multiple maturities.
For example:
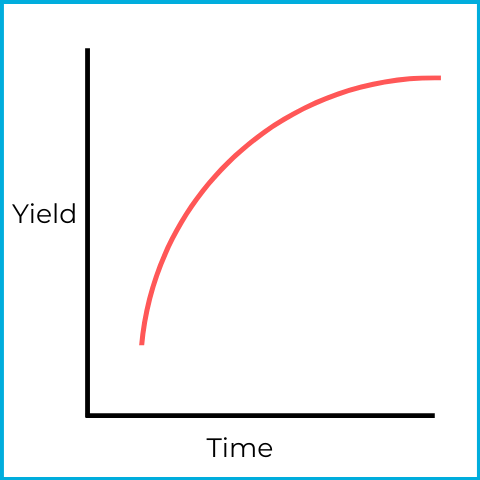
This is a normal (ascending) yield curve. Shorter maturities have lower yields, and longer maturities have higher yields. This reflects the idea that more time generally means more risk exposure.
Sometimes, the yield curve takes on a different shape.
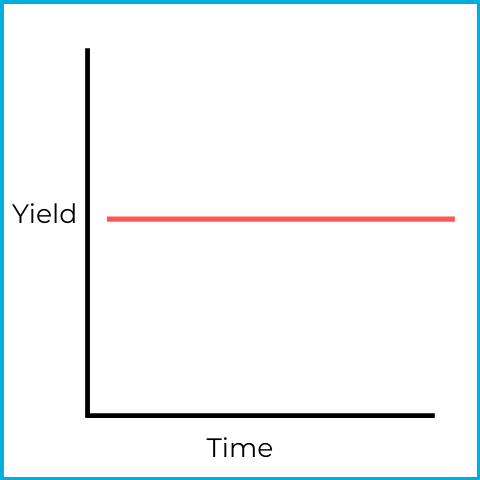
This is a flat yield curve, which signals uncertainty in the bond market. Short-term and long-term securities have similar yields, which is unusual.
One way this can happen is:
- Investors sell short-term securities and buy long-term bonds.
- Lower demand for short-term securities pushes their prices down and yields up.
- Higher demand for long-term bonds pushes their prices up and yields down.
Together, these moves can flatten the curve.
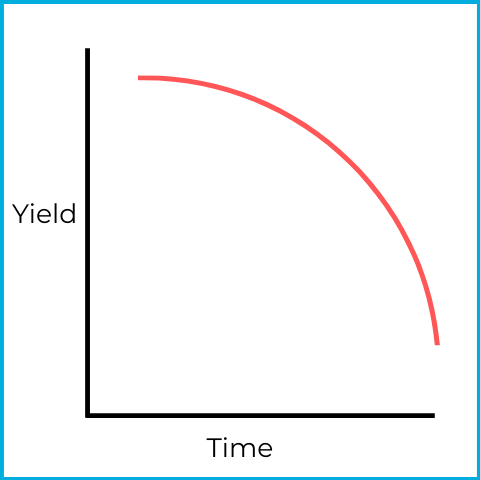
This is an inverted (descending) yield curve, which can signal a pending recession. Short-term securities have higher yields than long-term securities.
An inverted curve often follows the same forces that create a flat curve (the curve may flatten first and then invert). If investors expect a recession, they may sell short-term securities and buy long-term bonds.
Why would investors do that?
- In a recession, the Fed typically tries to lower interest rates.
- Investors may buy long-term bonds to lock in higher coupons before rates fall.
- If interest rates fall, bond prices tend to rise, which creates potential for capital appreciation.
Investors can find yield curves for the overall bond market or for specific sectors (corporate, municipal, U.S. government, etc.). There are also comparative yield curves, sometimes called credit yield spreads, which compare two yield curves - often U.S. government versus corporate.
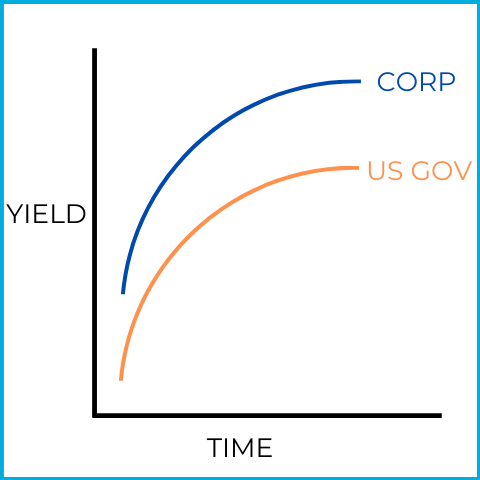
Corporate bonds typically have higher yields than U.S. government securities because they carry more risk. Comparative yield curves focus on the distance between the two curves.
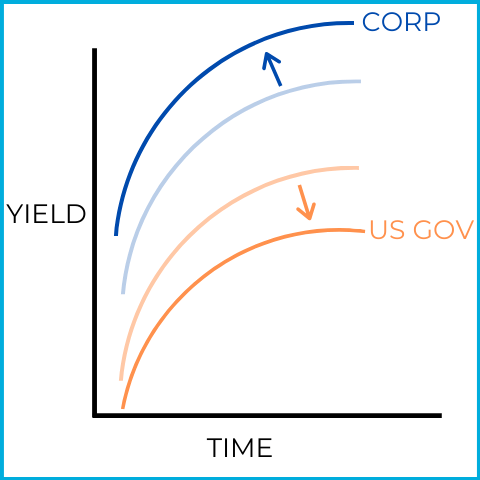
In this picture, the yield curves widen (move further apart), which can signal an economic recession. Investors may sell riskier corporate bonds and buy safer U.S. government securities.
- Lower demand for corporate bonds pushes prices down and yields up.
- Higher demand for U.S. government bonds pushes prices up and yields down.
This shift toward safety is why a widening yield curve can be a sign of an upcoming recession.
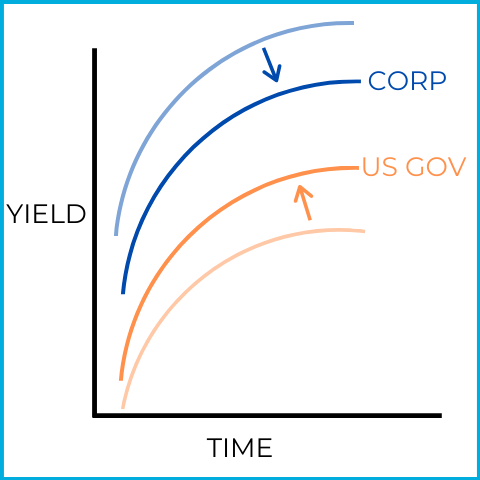
In this picture, the yield curves narrow (move closer together), which can signal economic prosperity (expansion). Investors may sell safer U.S. government bonds and buy riskier corporate bonds.
- Higher demand for corporate bonds pushes prices up and yields down.
- Lower demand for U.S. government bonds pushes prices down and yields up.
This shift toward risk is why a narrowing yield curve can be a sign of economic prosperity.
Leading indicators
Economists classify some indicators as leading because they tend to change before the overall economy changes. Common leading indicators include:
- S&P 500 level
- Average weekly initial claims for unemployment
- Index of new manufacturing orders
- Number of new building permits
- Consumer confidence index
- Interest rate spread between 10 year Treasury notes and fed funds rate
These indicators have a history of shifting before broader economic changes show up in GDP and employment data.
For example, the S&P 500 began declining sharply toward the end of summer 2007. According to the U.S. National Bureau of Economic Research, the Great Recession began in December 2007 and didn’t become a major economic problem until mid-2008. That’s why some economists describe the S&P 500 as a roughly six-month future (leading) economic predictor.
Some leading indicators are intuitive:
- Initial unemployment claims measure how many people are just now losing their jobs. Newly unemployed workers often reduce spending, which can contribute to GDP declines.
- New manufacturing orders and building permits reflect planned future activity. If fewer orders and permits are being issued, production and construction may slow later.
The consumer confidence index measures how optimistic consumers feel about the economy. Higher confidence tends to support spending; lower confidence tends to reduce it.
The interest rate spread between the 10-year Treasury note and the federal funds rate is also used to predict economic declines. In particular, when Treasury note rates fall below the federal funds rate, it can indicate an upcoming recession. You don’t need to interpret this spread in detail for most test questions - what matters most is recognizing it as a leading indicator.
Coincident indicators
A coincident indicator helps describe the economy’s current strength. Common coincident indicators include:
- Number of employees on non-farm payrolls
- Average hours worked
- Personal income levels
- Industrial production levels
- Manufacturing sales
- Unemployment rate
For exam purposes, the key point is what coincident indicators do: they reflect current economic conditions.
Lagging indicators
A lagging indicator provides insight into the economy’s past performance. Common lagging indicators include:
- Changes in CPI levels
- Corporate profits
- Change in labor cost per unit of output
- Average duration of unemployment*
*Keep in mind the differences between initial unemployment claims (a leading indicator), the unemployment rate (a coincident indicator), and the average duration of unemployment (a lagging indicator). Don’t worry too much about analyzing them - focus on which category each one belongs to. Test writers often use similar topics (like different unemployment measures) to check whether you understand these distinctions.
Economic market structures
Economic market structures can strongly affect how prices, competition, and production behave. A structure may exist within one sector (for example, pharmaceuticals) or across broader parts of the economy.
You may see test questions on the basics of these four structures:
- Perfect competition
- Monopolistic competition
- Oligopoly
- Monopoly
Perfect competition
This structure has many buyers and sellers offering virtually identical products. No single participant is large enough to influence prices.
A typical example is a farmer’s market. Vendors may sell similar fruits and vegetables, and price becomes a major factor in demand (the vendor with the lowest price tends to attract more buyers).
Monopolistic competition
Like perfect competition, monopolistic competition has many buyers and sellers. The difference is that products are differentiated.
For example, think about the chips aisle at a grocery store: Doritos, Lays, Ruffles, Sun Chips, and many others. Vendors compete, but demand isn’t based only on price - features like flavor, branding, and product differences matter.
In this structure, if one vendor tried to manipulate prices across the market (pushing all chip prices up or down), it would likely fail because consumers have many alternatives.
Oligopoly
An oligopoly has many buyers but only a small number of sellers (often 3-5). The limited number of sellers is usually due to high barriers to entry.
The airline industry is a common example. American, Southwest, Delta, and United represent roughly 70% of the industry. Starting a competing airline is expensive and difficult.
Because there are few sellers, price manipulation is easier than in more competitive markets.
Monopoly
A monopoly has many buyers but only one dominant seller. Regulations exist to prevent monopolies, but some still occur.
Utility companies are a common example. In many cities, consumers can buy electricity from only one provider (or a government-sponsored organization). With no competition, price manipulation is easy, which is why utilities are typically heavily regulated.