



Sales volume variance
Sales volume variance
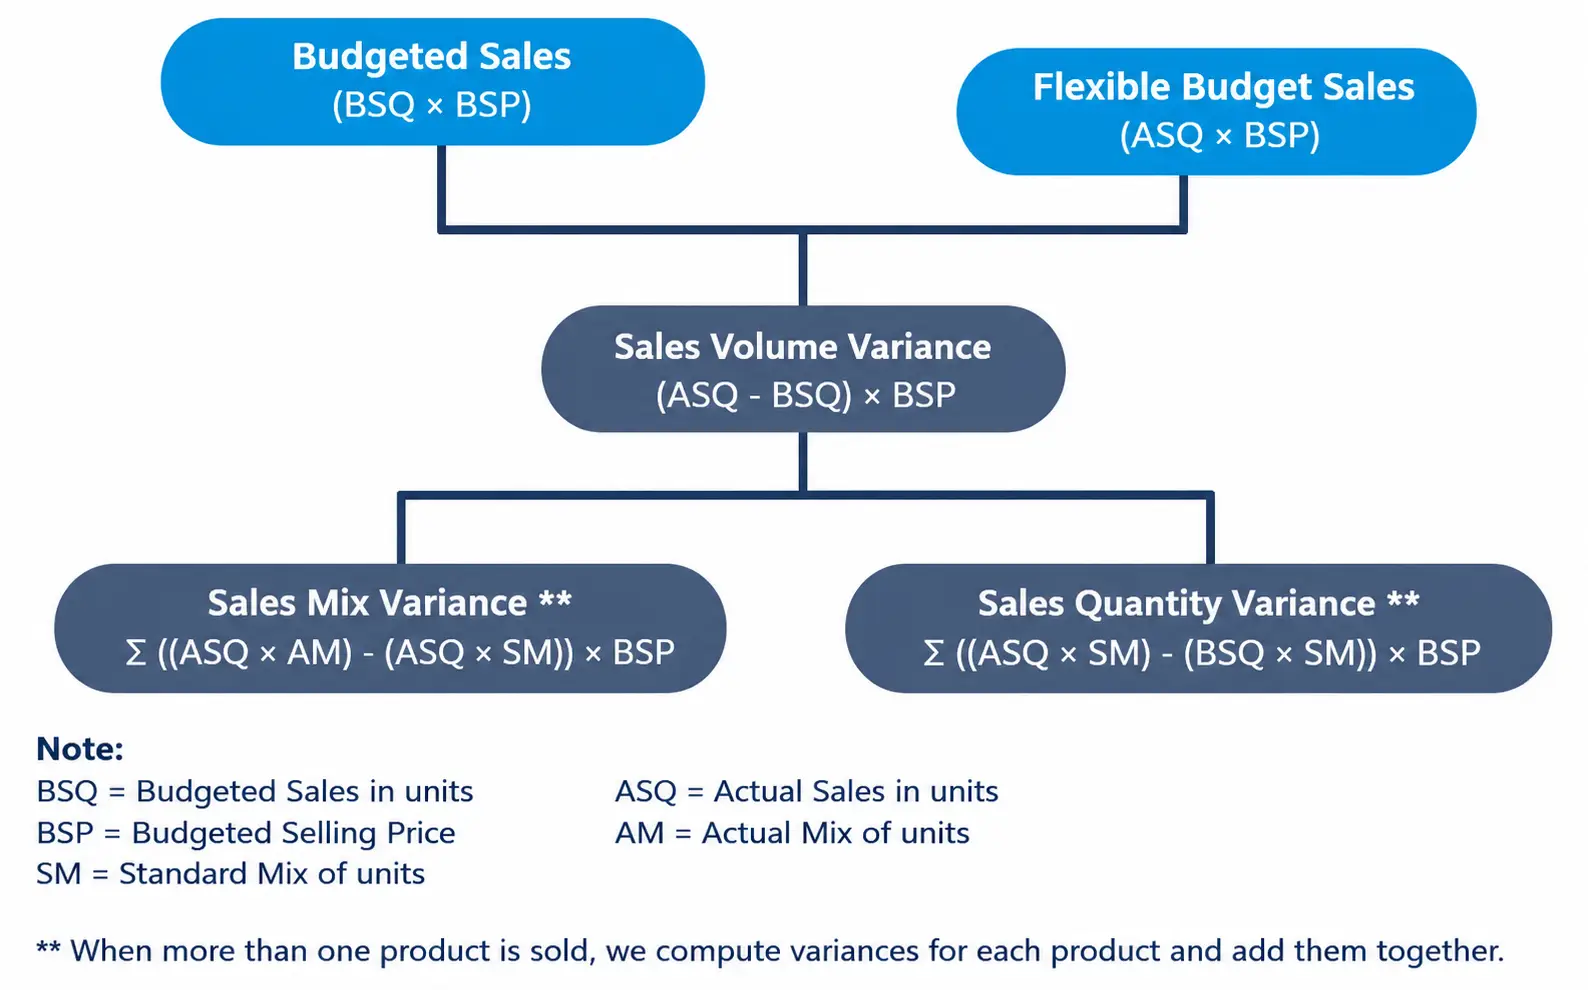
As seen in the total sales variance diagram, the sales volume variance isolates the impact of selling more or fewer units than planned, holding the budgeted selling price per unit constant. It is calculated as:
Taken from the original diagram about the total sales variance, the diagram below further illustrates alternative computations of the sales volume variance:
A favorable sales volume variance occurs when actual sales volume exceeds budgeted sales volume, indicating stronger-than-expected demand or successful sales efforts. Conversely, an unfavorable sales volume variance occurs when actual sales volume falls short of the budget, possibly due to lower demand, market competition, or production constraints.
The sales volume variance can be a straight-forward computation in the exams, but when the company is selling more than one type of product, we can also compute two more types of variances under the volume variance:
- the sales mix variance; and
- the sales quantity variance,
both of which should add up to the sales volume variance.
Sales mix variance
The sales mix variance measures the financial impact of deviations in the proportions of different products sold compared to the planned or standard sales mix. This variance occurs when the actual mix of products sold differs from the expected mix, potentially affecting overall revenue and profitability. It evaluates whether changes in the composition of products sold (i.e. selling more lower-margin products and fewer high-margin products) have a favorable or unfavorable effect on sales revenue. The calculation involves comparing the following two amounts:
- standard revenue for the actual sales mix; and
- standard revenue for the standard sales mix.
Expressed in formula:
It can also be expressed in terms of other formulas:
Where:
- is the budgeted selling price of the product
- is the total actual sales in units (total of all products)
- is the standard mix of products expected to be sold (expressed in %)
- is the actual mix of products sold (expressed in %)
- is the actual units of specific product sold
It is good to note that is equal to for that specific type of product and there is no need to perform computations for this part of the formula.
The formulas above are computed for each type of product sold and added together to form the total sales mix variance.
The sales mix variance is expected to be favorable when the actual sales mix includes a higher proportion of products with higher standard selling prices than expected, as this increases total revenue. Conversely, the variance is unfavorable when the actual sales mix shifts toward a higher proportion of lower-priced products, reducing total revenue compared to expectations.
This variance provides insights into how changes in the composition of products sold affect overall revenue and helps managers adjust sales strategies accordingly.
Sales quantity variance
The sales quantity variance measures the financial impact of deviations in the total number of units sold compared to the budgeted sales quantity. This variance occurs when the actual total sales volume differs from the expected total, regardless of the mix of products sold, potentially affecting overall revenue. It evaluates whether changes in the total quantity sold (i.e. selling more or fewer units than planned) have a favorable or unfavorable effect on sales revenue.
The calculation involves comparing the standard revenue for actual total sales to the standard revenue for budgeted total sales, assuming the standard sales mix. Expressed in formula:
It can also be expressed in terms of other formulas:
Where:
- is the budgeted selling price of the product
- is the total actual sales in units (total of all products)
- is the total budgeted sales in units (total of all products)
- is the standard mix of products expected to be sold (expressed in %)
The formulas above are computed for each type of product sold and added together to form the total sales quantity variance.
The sales quantity variance is expected to be favorable when the total actual sales exceed the budgeted sales, as this increases total revenue. Conversely, the variance is expected to be unfavorable when the total actual sales are lower than budgeted, reducing total revenue compared to expectations. However, you may be asked to compute the sales quantity variance for a specific product in the mix.
Sales margin variances
All the sales variances, which are traditionally calculated based on selling prices, can also be analyzed in terms of sales margin variances by replacing the selling price with the contribution margin (budgeted and actual).
This approach shifts the focus from total revenue to profitability, highlighting how variations in sales mix, quantity, or volume impact the contribution margin and, ultimately, the bottom line. By using contribution margin instead of selling price, managers can better understand the effect of sales variances on operational profitability, enabling more targeted decisions to optimize product performance and cost management.