


Achievable logoAchievable logo
CGMA BA1
Sign in
Sign up
Purchase
Textbook
Practice exams
Support
How it works
Exam catalog
Mountain with a flag at the peak
Textbook
Introduction
1. Goals and decisions of an organization
2. The market system
2.1 Introduction
2.2 Supply
2.3 Demand
2.3.1 Demand for products and changes in demand
2.3.2 Price elasticity of demand
3. The domestic economy
4. Macroeconomics – The international economy
5. Macroeconomics – Index numbers
6. Introduction to the financial context of business entities
7. Foreign currencies
8. Investment appraisal
9. Summarizing and analyzing data
10. Inter-relationships between variables
11. Time series model
Wrapping up
Achievable logoAchievable logo
2.3.1 Demand for products and changes in demand
CGMA BA1
2. The market system
2.3. Demand
Our CGMA course is currently in development and is a work-in-progress.

Demand for products and changes in demand

13 min read
Font
Discuss
Share
Feedback

Demand for Products

Demand is closely related to price. When the price changes, the quantity demanded usually changes too. Other factors can also affect demand, and those are the ones that shift the demand curve.

Expansion and contraction

Definitions
Expansion
An increase in quantity demanded caused by a decrease in the product’s price. This change happens along the same demand curve — the curve itself doesn’t move.
Contraction
A decrease in quantity demanded caused by an increase in the product’s price. This also happens along the same demand curve.
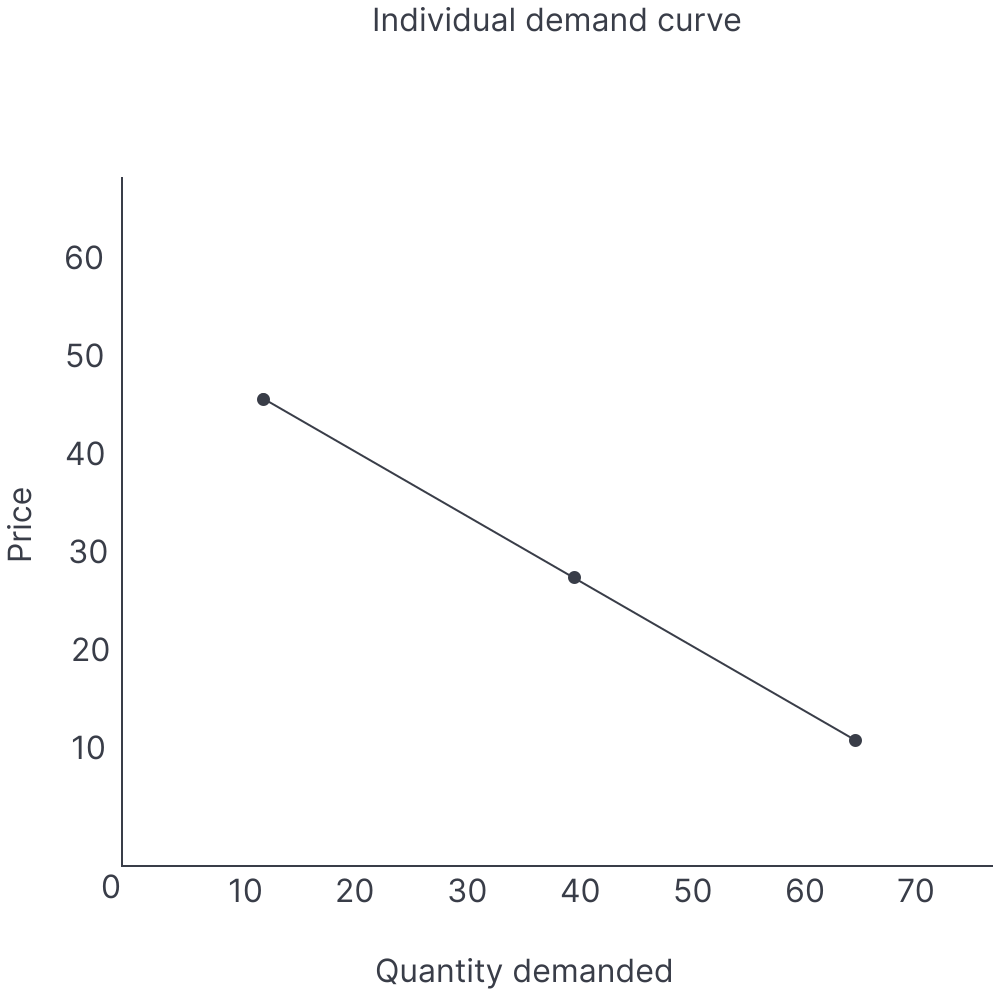
Line graph showing the relationship between demand and the market price.
Individual demand curve

From the graph:

  • When the price is $20, the quantity demanded is about 55 units.
  • If the price falls to $15, the quantity demanded rises to about 60 units.

Because this change happens on the same curve, it’s an expansion in demand (from 55 to 60 units due to the price falling from $20 to $15).

In the opposite direction, if the price rises from $15 to $20, quantity demanded falls from 60 units to 55 units — that’s a contraction in demand.

The key point to remember is that expansion and contraction are caused only by a change in the selling price of that product. No other factor creates expansion or contraction.

Example:

Which one of the following factors will cause contraction or expansion of the overseas boat cruise ticket prices?

A. The overseas are doing mass advertising for their boat cruise tickets.
B. The exchange rates are favorable in a way that customers are finding it cheaper to buy the tickets than before.
C. There are Olympic competitions overseas, which means there will be higher demand for the boat cruise competition.
D. A certain international news journalist has published the rising cruise ship crashes from last year.

Solution:

(spoiler)

B

  • Favorable exchange rates make the tickets cheaper for customers
  • A lower effective price increases quantity demanded along the same curve (expansion)

Shift of the demand curve

Contraction and expansion do not shift the curve — they move along a single curve. A shift happens when demand changes while the product’s price stays the same.

Example:

A plane ticket might still cost $500 from the USA to France, but the Olympics could increase demand for those tickets.

The price is unchanged, but demand rises, so this is not expansion — it’s an increase in demand, shown as a rightward shift of the demand curve.

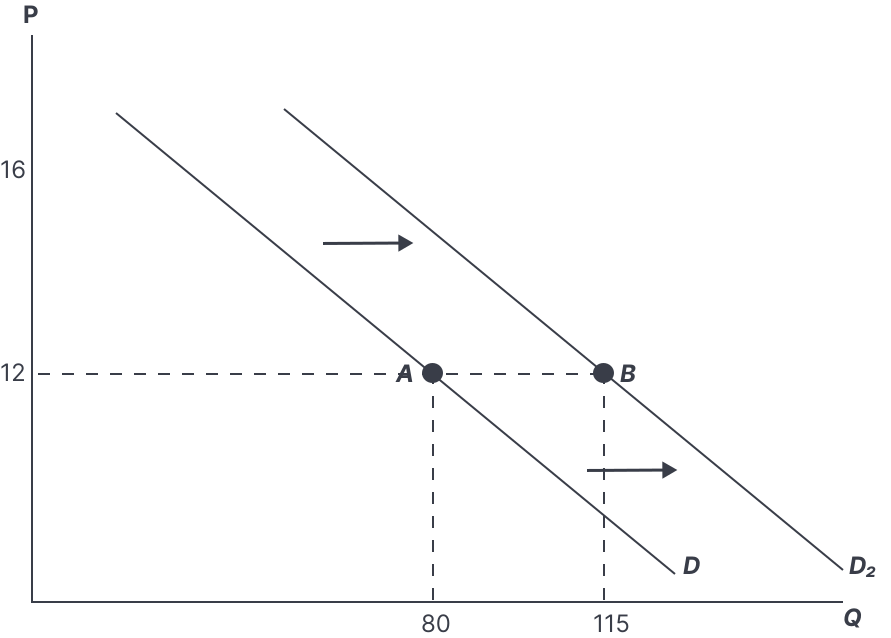
Graph showing the shift of demand from one point to another.
Demand curve with two demand lines

At the same price of $12:

  • demand increases from 80 units to 115 units (a rightward shift), or
  • demand decreases from 115 units to 80 units (a leftward shift).

A shift to the right (outward shift) is considered positive because it increases demand. A shift to the left (inward shift) is considered negative because it decreases demand.

The following factors can cause a shift in demand to the left or to the right.

Increase in income for consumers
If customers earn more, they’re likely to spend more; if they earn less, they’re likely to spend less. The effect depends on the type of good:

  • For some goods, demand rises when income rises (often called superior or normal goods).
  • For other goods, demand can fall when income rises (often called inferior goods).

Example:

When income increases, consumers may buy their own cars; when income decreases, they may rely more on public transport. Keep in mind: these income effects shift demand even if the product’s own price doesn’t change.

Seasonal fluctuations
Many industries have predictable high and low sales periods without changing prices. For example, education product sales may be low in December but high in January and February. Demand changes because of the season, not because of a price change.

Complementary products
Complementary products are used together (for example, cars and wheels/tires). If demand for one product rises, demand for its complement often rises too.

Example:

A car prices fall during a recession and more cars are purchased, demand for car wheels/tires may increase. The wheels/tires aren’t necessarily cheaper — the demand changes because a related product changes.

Substitute products
Substitutes are alternatives customers can switch between. If the price of one product rises, customers may switch to a substitute.

Example:

The price of a BMW increases, some customers might switch to a Benz. During difficult times, customers may prefer cheaper substitutes; when economic conditions are good, customers may prefer premium products.

Notice that the price changes here are for other products, not the product whose demand curve we’re shifting.

Demographic factors
Demand patterns often reflect a country’s population structure. If a country has more children, demand for children’s products tends to increase. If the infant population decreases, demand for infant products tends to decrease.

Natural disasters or diseases
Disasters and disease outbreaks can change demand for certain products.

Example:

April 2020, South Africa had record-low car sales of somewhere between 500–600 cars instead of the usual 4,000 cars due to COVID-19.

At the time this publication is being written, monkeypox is on the rise, which will likely impact travel and holidays if concerns continue to grow.

Not all products fall in demand during disasters or outbreaks. During the COVID-19 period, streaming platforms like Netflix and Disney saw a sharp rise in subscriptions, and hygienic products like hand sanitizers also rose sharply.

Technological awareness
Marketing has always been important for stimulating demand, but it can be especially effective today because technology makes consumers easier to reach. For example, movie producers often market heavily on platforms like TikTok and YouTube. When many consumers view trailers, demand for movie premieres can increase.

Example:

Which of the following would cause a demand curve for hand sanitizers to shift to the left? Select all that apply.

A. An outbreak of monkeypox has caused more people to buy hand sanitizer.
B. A video trend on social media detailing the side effects of using hand sanitizer.
C. A rise in a new brand that offers a similar product to sanitizer.
D. A minister appearing on national television announcing that a certain outbreak is on the decline.
E. The government enforced into law that all schools should have sanitizers at the entrance.
F. Increase in the price of sanitizer.

Solution:

(spoiler)

B, C

  • B reduces demand because it discourages use (leftward shift).
  • C reduces demand because a substitute becomes available (leftward shift).

Elasticity of Demand

Definitions
Price elasticity of demand
Measures how responsive quantity demanded is when the price of that product changes. “Elastic” means stretchable.

Price elasticity of demand=Percentage change in the selling pricePercentage change in quantity demanded​

This matters for managers because changing price doesn’t just change revenue per unit — it can also change the number of units sold.

Sidenote
Assumptions

Certain assumptions must be made to calculate the elasticity of demand:

  • The only factor that causes a volume change is the price.
  • Demand for a product can be calculated.

There are two methods of calculating price elasticity:

  • The average arc method
  • The non-average arc method

Interpreting the result

Before calculating elasticity, it helps to know how to interpret the result.

Definitions
Unit elastic (=−1)
Quantity demanded changes by the same percentage as price, but in the opposite direction.
For example, a 20% decrease in price leads to a 20% increase in demand.
Inelastic (between 0 and −1)
Quantity demanded changes by a smaller percentage than price. This is common for necessities and addictive goods.
For example, consumers continue to buy bread or cigarettes even when prices increase.
Relatively elastic (−1 to −∞)
Quantity demanded changes by a larger percentage than price. This is common for luxury goods.
For example, a small decrease in airfare can lead to a large increase in ticket sales.

Calculating elasticity

Let’s do an example of calculating elasticity, To calculate elasticity, you need to compare how much price changes with how much quantity demanded changes. This is usually done using percentage changes.

In this example, we are given both the original values and the new values, so we can calculate elasticity directly.

Average and non-average arc method

Use both the average arc method and the non-average arc method to calculate the elasticity of demand of the course content.

Example:

KTA sells educational courses online on its sites and its social media platforms. The research team has gathered some information on the demand pattern of the product, and the current demand is 10,000 copies sold for $100. Based on the market research, it’s estimated that the demand for the courses will rise to 15,000 when the price is dropped to $80.

Use both the average arc method and the non-average arc method to calculate the elasticity of demand of the course content.

Average arc method:
The average arc method uses the midpoint of the starting and ending values as the denominator for both quantity and price.

Average quantityAverage price% change in quantity% change in pricePrice elasticity of demand​=210,000+15,000​=12,500=2100+80​=90=12,50015,000−10,000​=0.4=9080−100​=−0.22=−0.220.4​=−1.8​

This means the product is relatively elastic.

Steps taken:

  • Identify the original and new quantity (10,000 to 15,000)
  • Identify the original and new price (100 to 80)
  • Calculate the average quantity and average price
  • Find the percentage change in quantity using the average quantity
  • Find the percentage change in price using the average price
  • Substitute both values into the elasticity formula
  • Divide to calculate elasticity

Now let’s use the non-average arc method to calculate elasticity.

Non-average arc method:
The non-average arc method uses the starting values (before the change) as the denominator.

% change in quantity% change in price​=10,00015,000−10,000​=0.5=10080−100​=−0.2​

Price elasticity of demand​=−0.20.5​​

Price elasticity of demand​=−0.20.5​=−2.5​

Steps taken:

  • Identify the original and new quantity (10,000 to 15,000)
  • Identify the original and new price (100 to 80)
  • Find the percentage change in quantity using the starting quantity
  • Find the percentage change in price using the starting price
  • Substitute both values into the elasticity formula
  • Divide to calculate elasticity
Sidenote
When to use non-average arc method

If a question doesn’t state which method to use, use the non-average arc method.

A CIMA BA1 question can also ask you to do the reverse calculation, for example asking you to calculate the new quantity demanded.

Example:

KTA’s price elasticity of demand was −2.5, and its current demand is 10,000 units. The current price is $100. If the price was to be dropped to $80, how much would be the quantity demanded?

% change in price−0.2x​x​=10080−100​=−0.2=−2.5=−2.5×−0.2=0.5​

The percentage change in quantity demanded is 0.5 (or 50%). Now find the new quantity:

10,000x−10,000​x−10,000x​=0.5=0.5⋅10,000=(0.5×10,000)+10,000=15,000 copies​

Steps taken:

  • Calculate the percentage change in price
  • Use elasticity to find percentage change in quantity
  • Apply the change to the original quantity

What causes price elasticity of demand?

Necessities
Necessities tend to have more inelastic demand. That doesn’t mean demand never changes when price changes — it means the percentage change in quantity demanded is relatively small compared with the percentage change in price.

Example:

The price of sugar could fall by 20% while quantity demanded rises by 2%. That’s still price inelastic.

Availability of substitutes

  • If a product has close substitutes, a price rise can lead to a large drop in quantity demanded because customers switch to alternatives.

In some industries there may be no substitutes. For example, in power industries (e.g., electricity in developing countries), a parastatal company may produce electricity for the whole country. If it raises or lowers price, demand may not change much because there is no competition.

Income spent on a product

  • The larger the share of income spent on a product, the more sensitive demand tends to be to price changes. Plane tickets or cruises are expensive, so a 10% price drop can noticeably increase demand. A pen is cheap, so a price rise may not change demand much.

Why managers need to understand price elasticity

Managers need to know when to increase and decrease prices in order to increase the profitability of the organization.

Sidenote
Key rules:
  • If a good is price elastic, a decrease in the selling price will increase revenue, but an increase in the selling price will decrease revenue.
  • If a product is price inelastic, an increase in the selling price will increase revenue, but a decrease in the selling price will decrease revenue.

Using the earlier example:

  • At $100 and 10,000 copies: sales revenue =$1,000,000
  • At $80 and 15,000 copies: sales revenue =$1,200,000

The elasticity of demand was −2.5, which indicates relatively elastic demand, so the price decrease increased total revenue.

Price elasticity summary

Overall, price elasticity helps managers predict how customers will respond to price changes. By understanding whether demand is elastic or inelastic, managers can make more informed pricing decisions that maximize revenue and avoid unintended losses. Instead of guessing, they can use elasticity to choose pricing strategies that align with how customers actually behave.

Expansion and contraction of demand

  • Expansion: quantity demanded increases as price decreases (movement along demand curve)
  • Contraction: quantity demanded decreases as price increases (movement along demand curve)
  • Only changes in product’s own price cause expansion/contraction

Shifts of the demand curve

  • Demand curve shifts when demand changes at the same price (not caused by product’s own price)
  • Rightward shift: increase in demand; Leftward shift: decrease in demand
  • Causes of shifts:
    • Changes in consumer income (normal vs. inferior goods)
    • Seasonal fluctuations
    • Changes in demand for complementary or substitute products
    • Demographic changes
    • Natural disasters/disease outbreaks
    • Technological awareness/marketing

Elasticity of demand

  • Price elasticity of demand: responsiveness of quantity demanded to price changes
    • Formula: Percentage change in pricePercentage change in quantity demanded​
  • Interpretation:
    • Unit elastic: −1
    • Inelastic: between 0 and −1
    • Elastic: less than −1 (e.g., −2.5)
  • Calculation methods:
    • Average (arc) method: uses averages of starting and ending values
    • Non-average method: uses starting values as denominator

Determinants of price elasticity

  • Necessities: more inelastic demand
  • Availability of substitutes: more substitutes = more elastic demand
  • Proportion of income spent: higher proportion = more elastic demand

Managerial implications of elasticity

  • Elastic demand: price decrease increases revenue; price increase decreases revenue
  • Inelastic demand: price increase increases revenue; price decrease decreases revenue
  • Managers use elasticity to set pricing strategies for profitability

Sign up for free to take 5 quiz questions on this topic

Previous
Next  | 2.3.2 Price elasticity of demand
All rights reserved ©2016 - 2026 Achievable, Inc.

Demand for products and changes in demand

Demand for Products

Demand is closely related to price. When the price changes, the quantity demanded usually changes too. Other factors can also affect demand, and those are the ones that shift the demand curve.

Expansion and contraction

Definitions
Expansion
An increase in quantity demanded caused by a decrease in the product’s price. This change happens along the same demand curve — the curve itself doesn’t move.
Contraction
A decrease in quantity demanded caused by an increase in the product’s price. This also happens along the same demand curve.

From the graph:

  • When the price is $20, the quantity demanded is about 55 units.
  • If the price falls to $15, the quantity demanded rises to about 60 units.

Because this change happens on the same curve, it’s an expansion in demand (from 55 to 60 units due to the price falling from $20 to $15).

In the opposite direction, if the price rises from $15 to $20, quantity demanded falls from 60 units to 55 units — that’s a contraction in demand.

The key point to remember is that expansion and contraction are caused only by a change in the selling price of that product. No other factor creates expansion or contraction.

Example:

Which one of the following factors will cause contraction or expansion of the overseas boat cruise ticket prices?

A. The overseas are doing mass advertising for their boat cruise tickets.
B. The exchange rates are favorable in a way that customers are finding it cheaper to buy the tickets than before.
C. There are Olympic competitions overseas, which means there will be higher demand for the boat cruise competition.
D. A certain international news journalist has published the rising cruise ship crashes from last year.

Solution:

(spoiler)

B

  • Favorable exchange rates make the tickets cheaper for customers
  • A lower effective price increases quantity demanded along the same curve (expansion)

Shift of the demand curve

Contraction and expansion do not shift the curve — they move along a single curve. A shift happens when demand changes while the product’s price stays the same.

Example:

A plane ticket might still cost $500 from the USA to France, but the Olympics could increase demand for those tickets.

The price is unchanged, but demand rises, so this is not expansion — it’s an increase in demand, shown as a rightward shift of the demand curve.

At the same price of $12:

  • demand increases from 80 units to 115 units (a rightward shift), or
  • demand decreases from 115 units to 80 units (a leftward shift).

A shift to the right (outward shift) is considered positive because it increases demand. A shift to the left (inward shift) is considered negative because it decreases demand.

The following factors can cause a shift in demand to the left or to the right.

Increase in income for consumers
If customers earn more, they’re likely to spend more; if they earn less, they’re likely to spend less. The effect depends on the type of good:

  • For some goods, demand rises when income rises (often called superior or normal goods).
  • For other goods, demand can fall when income rises (often called inferior goods).

Example:

When income increases, consumers may buy their own cars; when income decreases, they may rely more on public transport. Keep in mind: these income effects shift demand even if the product’s own price doesn’t change.

Seasonal fluctuations
Many industries have predictable high and low sales periods without changing prices. For example, education product sales may be low in December but high in January and February. Demand changes because of the season, not because of a price change.

Complementary products
Complementary products are used together (for example, cars and wheels/tires). If demand for one product rises, demand for its complement often rises too.

Example:

A car prices fall during a recession and more cars are purchased, demand for car wheels/tires may increase. The wheels/tires aren’t necessarily cheaper — the demand changes because a related product changes.

Substitute products
Substitutes are alternatives customers can switch between. If the price of one product rises, customers may switch to a substitute.

Example:

The price of a BMW increases, some customers might switch to a Benz. During difficult times, customers may prefer cheaper substitutes; when economic conditions are good, customers may prefer premium products.

Notice that the price changes here are for other products, not the product whose demand curve we’re shifting.

Demographic factors
Demand patterns often reflect a country’s population structure. If a country has more children, demand for children’s products tends to increase. If the infant population decreases, demand for infant products tends to decrease.

Natural disasters or diseases
Disasters and disease outbreaks can change demand for certain products.

Example:

April 2020, South Africa had record-low car sales of somewhere between 500–600 cars instead of the usual 4,000 cars due to COVID-19.

At the time this publication is being written, monkeypox is on the rise, which will likely impact travel and holidays if concerns continue to grow.

Not all products fall in demand during disasters or outbreaks. During the COVID-19 period, streaming platforms like Netflix and Disney saw a sharp rise in subscriptions, and hygienic products like hand sanitizers also rose sharply.

Technological awareness
Marketing has always been important for stimulating demand, but it can be especially effective today because technology makes consumers easier to reach. For example, movie producers often market heavily on platforms like TikTok and YouTube. When many consumers view trailers, demand for movie premieres can increase.

Example:

Which of the following would cause a demand curve for hand sanitizers to shift to the left? Select all that apply.

A. An outbreak of monkeypox has caused more people to buy hand sanitizer.
B. A video trend on social media detailing the side effects of using hand sanitizer.
C. A rise in a new brand that offers a similar product to sanitizer.
D. A minister appearing on national television announcing that a certain outbreak is on the decline.
E. The government enforced into law that all schools should have sanitizers at the entrance.
F. Increase in the price of sanitizer.

Solution:

(spoiler)

B, C

  • B reduces demand because it discourages use (leftward shift).
  • C reduces demand because a substitute becomes available (leftward shift).

Elasticity of Demand

Definitions
Price elasticity of demand
Measures how responsive quantity demanded is when the price of that product changes. “Elastic” means stretchable.

Price elasticity of demand=Percentage change in the selling pricePercentage change in quantity demanded​

This matters for managers because changing price doesn’t just change revenue per unit — it can also change the number of units sold.

Sidenote
Assumptions

Certain assumptions must be made to calculate the elasticity of demand:

  • The only factor that causes a volume change is the price.
  • Demand for a product can be calculated.

There are two methods of calculating price elasticity:

  • The average arc method
  • The non-average arc method

Interpreting the result

Before calculating elasticity, it helps to know how to interpret the result.

Definitions
Unit elastic (=−1)
Quantity demanded changes by the same percentage as price, but in the opposite direction.
For example, a 20% decrease in price leads to a 20% increase in demand.
Inelastic (between 0 and −1)
Quantity demanded changes by a smaller percentage than price. This is common for necessities and addictive goods.
For example, consumers continue to buy bread or cigarettes even when prices increase.
Relatively elastic (−1 to −∞)
Quantity demanded changes by a larger percentage than price. This is common for luxury goods.
For example, a small decrease in airfare can lead to a large increase in ticket sales.

Calculating elasticity

Let’s do an example of calculating elasticity, To calculate elasticity, you need to compare how much price changes with how much quantity demanded changes. This is usually done using percentage changes.

In this example, we are given both the original values and the new values, so we can calculate elasticity directly.

Average and non-average arc method

Use both the average arc method and the non-average arc method to calculate the elasticity of demand of the course content.

Example:

KTA sells educational courses online on its sites and its social media platforms. The research team has gathered some information on the demand pattern of the product, and the current demand is 10,000 copies sold for $100. Based on the market research, it’s estimated that the demand for the courses will rise to 15,000 when the price is dropped to $80.

Use both the average arc method and the non-average arc method to calculate the elasticity of demand of the course content.

Average arc method:
The average arc method uses the midpoint of the starting and ending values as the denominator for both quantity and price.

Average quantityAverage price% change in quantity% change in pricePrice elasticity of demand​=210,000+15,000​=12,500=2100+80​=90=12,50015,000−10,000​=0.4=9080−100​=−0.22=−0.220.4​=−1.8​

This means the product is relatively elastic.

Steps taken:

  • Identify the original and new quantity (10,000 to 15,000)
  • Identify the original and new price (100 to 80)
  • Calculate the average quantity and average price
  • Find the percentage change in quantity using the average quantity
  • Find the percentage change in price using the average price
  • Substitute both values into the elasticity formula
  • Divide to calculate elasticity

Now let’s use the non-average arc method to calculate elasticity.

Non-average arc method:
The non-average arc method uses the starting values (before the change) as the denominator.

% change in quantity% change in price​=10,00015,000−10,000​=0.5=10080−100​=−0.2​

Price elasticity of demand​=−0.20.5​​

Price elasticity of demand​=−0.20.5​=−2.5​

Steps taken:

  • Identify the original and new quantity (10,000 to 15,000)
  • Identify the original and new price (100 to 80)
  • Find the percentage change in quantity using the starting quantity
  • Find the percentage change in price using the starting price
  • Substitute both values into the elasticity formula
  • Divide to calculate elasticity
Sidenote
When to use non-average arc method

If a question doesn’t state which method to use, use the non-average arc method.

A CIMA BA1 question can also ask you to do the reverse calculation, for example asking you to calculate the new quantity demanded.

Example:

KTA’s price elasticity of demand was −2.5, and its current demand is 10,000 units. The current price is $100. If the price was to be dropped to $80, how much would be the quantity demanded?

% change in price−0.2x​x​=10080−100​=−0.2=−2.5=−2.5×−0.2=0.5​

The percentage change in quantity demanded is 0.5 (or 50%). Now find the new quantity:

10,000x−10,000​x−10,000x​=0.5=0.5⋅10,000=(0.5×10,000)+10,000=15,000 copies​

Steps taken:

  • Calculate the percentage change in price
  • Use elasticity to find percentage change in quantity
  • Apply the change to the original quantity

What causes price elasticity of demand?

Necessities
Necessities tend to have more inelastic demand. That doesn’t mean demand never changes when price changes — it means the percentage change in quantity demanded is relatively small compared with the percentage change in price.

Example:

The price of sugar could fall by 20% while quantity demanded rises by 2%. That’s still price inelastic.

Availability of substitutes

  • If a product has close substitutes, a price rise can lead to a large drop in quantity demanded because customers switch to alternatives.

In some industries there may be no substitutes. For example, in power industries (e.g., electricity in developing countries), a parastatal company may produce electricity for the whole country. If it raises or lowers price, demand may not change much because there is no competition.

Income spent on a product

  • The larger the share of income spent on a product, the more sensitive demand tends to be to price changes. Plane tickets or cruises are expensive, so a 10% price drop can noticeably increase demand. A pen is cheap, so a price rise may not change demand much.

Why managers need to understand price elasticity

Managers need to know when to increase and decrease prices in order to increase the profitability of the organization.

Sidenote
Key rules:
  • If a good is price elastic, a decrease in the selling price will increase revenue, but an increase in the selling price will decrease revenue.
  • If a product is price inelastic, an increase in the selling price will increase revenue, but a decrease in the selling price will decrease revenue.

Using the earlier example:

  • At $100 and 10,000 copies: sales revenue =$1,000,000
  • At $80 and 15,000 copies: sales revenue =$1,200,000

The elasticity of demand was −2.5, which indicates relatively elastic demand, so the price decrease increased total revenue.

Price elasticity summary

Overall, price elasticity helps managers predict how customers will respond to price changes. By understanding whether demand is elastic or inelastic, managers can make more informed pricing decisions that maximize revenue and avoid unintended losses. Instead of guessing, they can use elasticity to choose pricing strategies that align with how customers actually behave.

Key points

Expansion and contraction of demand

  • Expansion: quantity demanded increases as price decreases (movement along demand curve)
  • Contraction: quantity demanded decreases as price increases (movement along demand curve)
  • Only changes in product’s own price cause expansion/contraction

Shifts of the demand curve

  • Demand curve shifts when demand changes at the same price (not caused by product’s own price)
  • Rightward shift: increase in demand; Leftward shift: decrease in demand
  • Causes of shifts:
    • Changes in consumer income (normal vs. inferior goods)
    • Seasonal fluctuations
    • Changes in demand for complementary or substitute products
    • Demographic changes
    • Natural disasters/disease outbreaks
    • Technological awareness/marketing

Elasticity of demand

  • Price elasticity of demand: responsiveness of quantity demanded to price changes
    • Formula: Percentage change in pricePercentage change in quantity demanded​
  • Interpretation:
    • Unit elastic: −1
    • Inelastic: between 0 and −1
    • Elastic: less than −1 (e.g., −2.5)
  • Calculation methods:
    • Average (arc) method: uses averages of starting and ending values
    • Non-average method: uses starting values as denominator

Determinants of price elasticity

  • Necessities: more inelastic demand
  • Availability of substitutes: more substitutes = more elastic demand
  • Proportion of income spent: higher proportion = more elastic demand

Managerial implications of elasticity

  • Elastic demand: price decrease increases revenue; price increase decreases revenue
  • Inelastic demand: price increase increases revenue; price decrease decreases revenue
  • Managers use elasticity to set pricing strategies for profitability

More from Demand

  • Price elasticity of demand