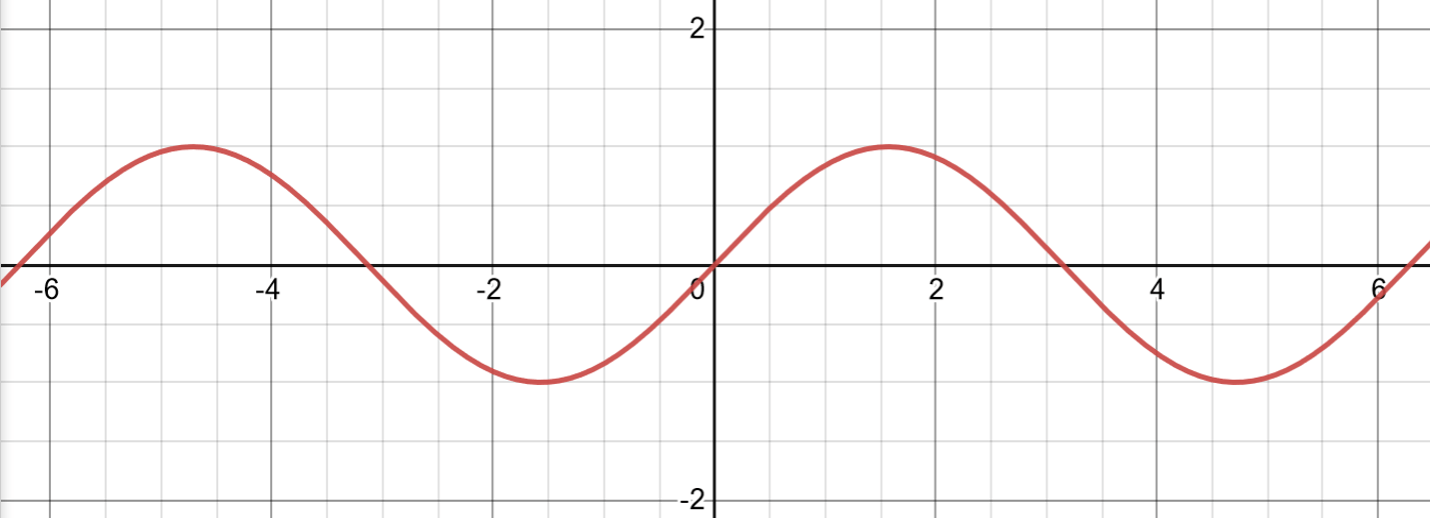
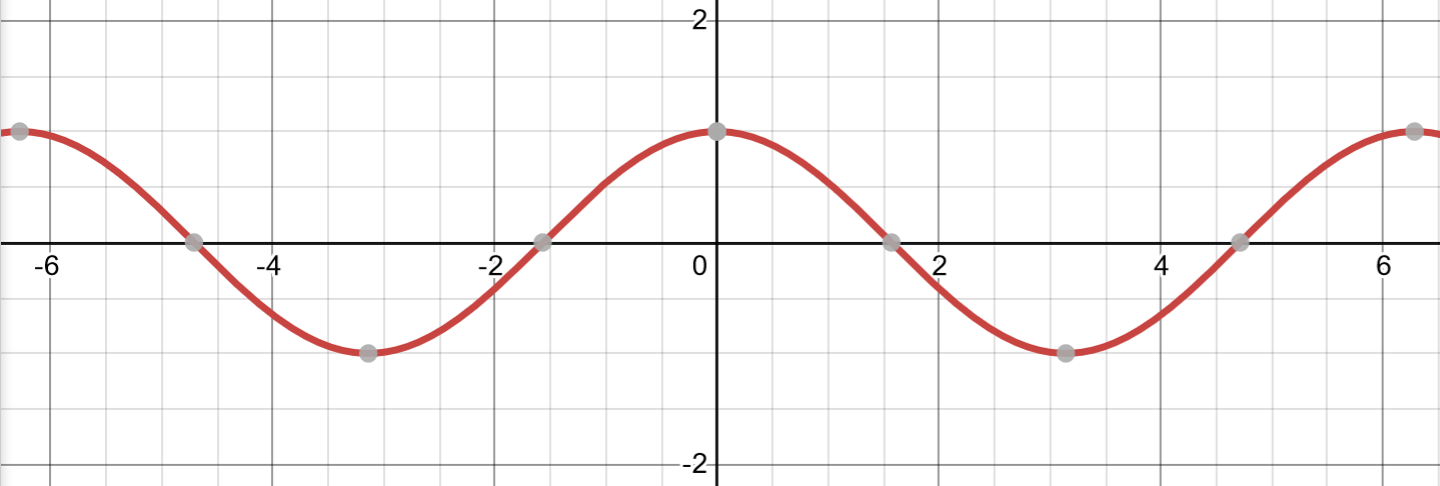
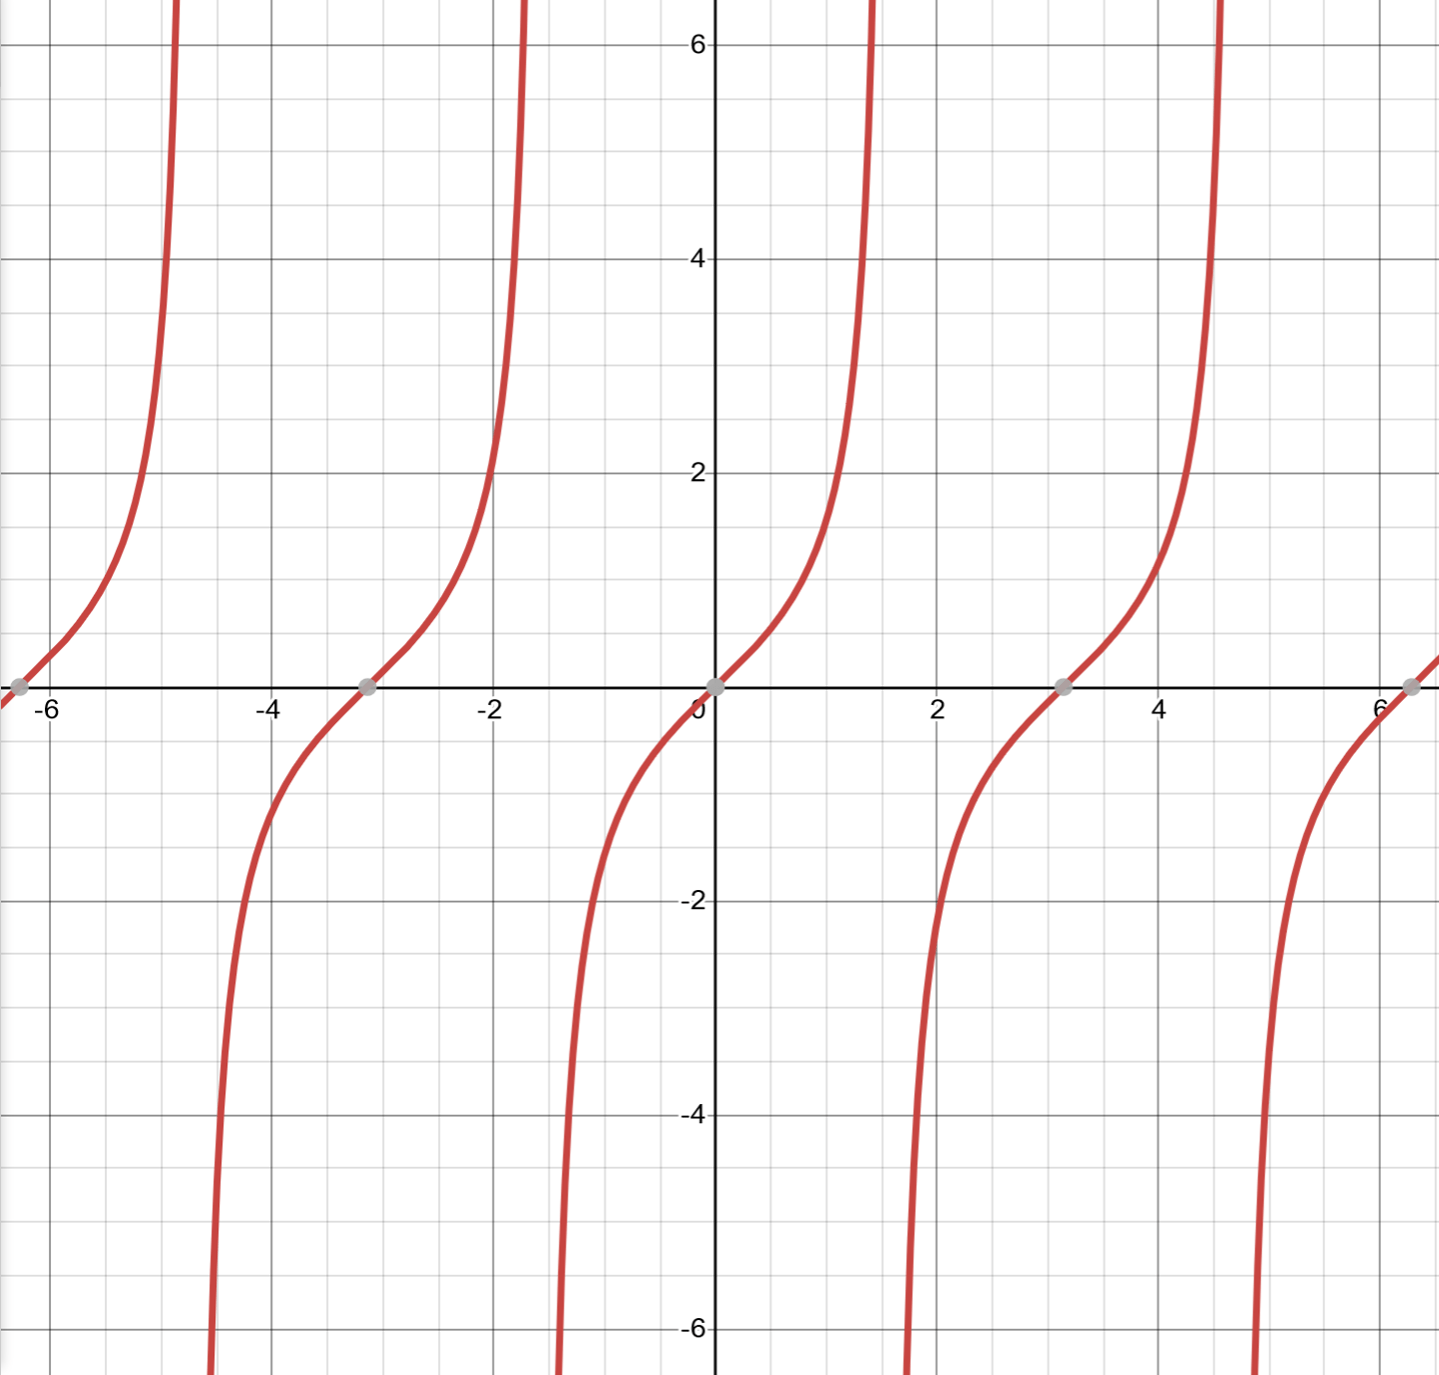
The following graphs show the parent functions for , , and . Sine and cosine graphs are often called waves because of their repeating pattern. You’ll study the details of these wave-like characteristics more later.

A sine curve looks like a wave, so it has wave-like properties such as amplitude and period.
The amplitude of a wave is the vertical distance from the -axis (the midline) to a peak. The distance is the same to a peak above the axis and to a peak below the axis. For the parent function , the amplitude is .
Amplitude tells you the maximum and minimum values of the graph. Since the amplitude of is , its maximum value is and its minimum value is .
The period of a wave is the horizontal distance needed to complete one full cycle of the pattern. For a sine graph, a helpful way to remember one cycle is:
“middle-high-middle-low-middle.”
This means the curve starts on the -axis, rises to , returns to the -axis, drops to , and returns to the -axis.
In the example above, one period begins at and ends at , so the period is . The halfway point of the period is at .

The parent cosine graph has the same amplitude as the parent sine graph: . That means the maximum value of is and the minimum value is .
The period is also . The main difference is where the cycle starts. A cosine cycle can be remembered as:
“high-middle-low-middle-high.”
It begins at when , decreases to , then increases back to .

The graph of looks very different from sine and cosine. It isn’t wave-shaped. Instead, it consists of repeating curves that look somewhat like pieces of a cubic function.
Notice the vertical asymptotes that separate each curve. If you need a refresher on asymptotes, review the chapter Nonlinear functions and graphs.
Starting at the origin, the curves intersect the -axis at intervals of in both the positive and negative directions. The vertical asymptotes also occur at intervals of in both directions, but they start at .
You’ll often see sine and cosine functions that differ from their parent functions. In those cases, you need to find the amplitude and period from the equation (without relying on a graph).
You can find the amplitude of a sine or cosine wave by looking at the number multiplied in front of the function.
Here is another example:
Find the amplitude of the following function:
The amplitude of the function is . This is also the maximum value of the function. The minimum value is .
To find the period, figure out what value you need to multiply by so that the coefficient of inside the function becomes . For the parent functions, the inside is just , so the coefficient is , and you multiply by to get .
Here is an example of finding the period:
Find the period of the following function:
Find what value you need to multiply by so that the coefficient of becomes . The current coefficient is .
The period of the function is .
Trigonometric identities are equations that show relationships between trigonometric functions. For the ACT, you only need to know this one:
The in this identity can be any expression, as long as it is exactly the same in both functions. For example:
Sign up for free to take 3 quiz questions on this topic