


Achievable logoAchievable logo
CMA Part 1
Sign in
Sign up
Purchase
Textbook
Practice exams
Support
How it works
Exam catalog
Mountain with a flag at the peak
Textbook
1. External financial reporting decisions
2. Planning, budgeting, and forecasting
3. Performance management
4. Cost management
5. Internal control
6. Technology and analytics
Achievable logoAchievable logo
6.3.4.3 Time series analysis
Achievable CMA Part 1
6. Technology and analytics
6.3. Data analytics
6.3.4. Types of data analytics
Our CMA Part 1 course is currently in development and is a work-in-progress.

Time series analysis

5 min read
Font
Discuss
Share
Feedback

Learning outcome statements

The learning outcome statements relevant for this section are:

  1. demonstrate an understanding of time series analyses, including trend, cyclical, seasonal, and irregular patterns
  2. identify and explain the benefits and limitations of time series analysis
  3. explain how to use predictive analytics techniques to draw insights and make recommendations

Definition of time series analysis

Definitions
Time series analysis
A statistical method used to examine data points gathered over consistent time intervals to identify patterns, trends, and fluctuations. It is commonly used in forecasting, financial modeling, and operational decision-making.

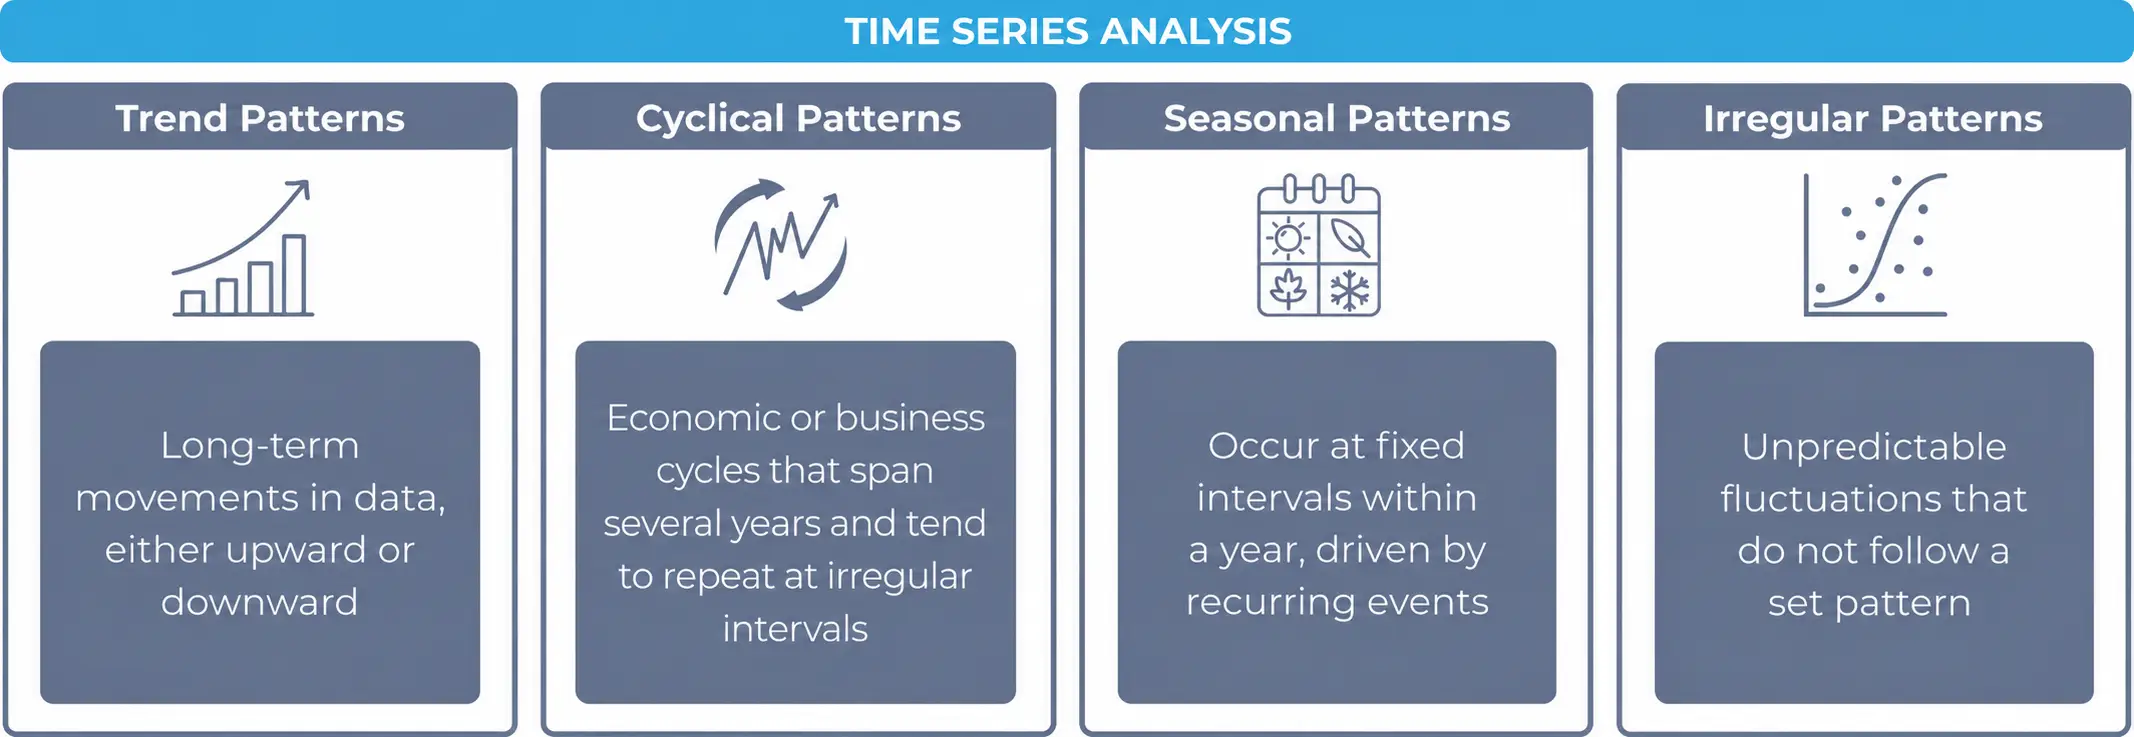
The four key patterns observed in a time series analysis include:

Describing four time series patterns: trend, cyclical, seasonal, and irregular.
Time Series Patterns

1. Trend patterns

These represent long-term movements in data, either upward or downward. A trend can be:

  • increasing,
  • decreasing, or
  • stable over time.

Organizations analyze trend patterns to anticipate market demands and adjust strategies accordingly.

For example, stock prices tend to rise in a growing economy due to increased investor confidence and economic expansion. Conversely, declining birth rates may indicate demographic shifts that affect future workforce availability and economic growth.

2. Cyclical patterns

These reflect economic or business cycles that span several years and tend to repeat at irregular intervals. Unlike seasonal patterns, cyclical movements are influenced by macroeconomic factors such as inflation rates, government policies, and global trade. Businesses use cyclical pattern analysis to prepare for downturns and capitalize on periods of growth.

For example, the housing market experiences cycles of expansion and contraction depending on interest rates, housing supply, and economic stability.

3. Seasonal patterns

These occur at fixed intervals within a year, driven by recurring events such as holidays, weather conditions, or cultural trends. Understanding seasonal variations allows businesses to optimize production schedules, manage supply chains efficiently, and align marketing campaigns with consumer demand.

For example, retailers experience a surge in sales during the holiday season, prompting them to stock up on inventory and increase marketing efforts. Similarly, utility companies anticipate higher electricity consumption in the summer months due to air conditioning usage.

4. Irregular (residual) patterns

These are unpredictable fluctuations that do not follow a set pattern and are often the result of unexpected events. External shocks such as natural disasters, political instability, pandemics, or financial crises can cause sudden disruptions in market behavior. Since irregular patterns cannot be easily predicted, businesses incorporate risk management strategies to mitigate their impact.

For instance, a global pandemic may lead to sharp declines in travel and hospitality revenues while increasing demand for e-commerce and remote work solutions.

Benefits and limitations of time series analysis

Benefits

  • Recognition of trends and cycles: Time series analysis allows organizations to identify long-term trends and cyclical behaviors in the data. By understanding these trends, businesses can develop strategies for sustainable growth and anticipate economic shifts before they occur.
  • Improved forecasting accuracy: By analyzing historical patterns, time series models help predict future values with a higher degree of accuracy. This is particularly useful for inventory management, budgeting, and production planning in industries such as retail, manufacturing, and logistics.
  • Seasonal demand planning: Many industries experience seasonal fluctuations in demand. Time series analysis helps businesses adjust their marketing strategies, staffing, and supply chain logistics accordingly. For instance, e-commerce companies ramp up operations during the holiday season based on past sales trends.
  • Early detection of anomalies: Businesses can detect irregular patterns in data that might indicate operational inefficiencies, fraud, or sudden market changes. Financial institutions use time series analysis to detect unusual transaction patterns that could signal fraudulent activities.

Limitations

  • Dependence on historical data: Time series models assume that past patterns will continue into the future, which may not always hold true, especially in dynamic industries affected by rapid technological advancements or shifting consumer preferences.
  • Complexity in identifying patterns: Differentiating between trend, cyclical, seasonal, and irregular patterns requires expertise in statistical modeling. Without proper analysis, businesses may misinterpret data and make flawed predictions.
  • Influence of external factors: Unexpected external events such as financial crises, policy changes, or natural disasters can disrupt established trends, making time series forecasts unreliable. For instance, the COVID-19 pandemic dramatically altered consumer behavior in ways that historical data could not predict.
  • Computational and data requirements: Effective time series forecasting often requires large datasets and sophisticated statistical tools, increasing the cost and technical requirements for implementation.
  • Difficulty in accounting for irregular events: While time series analysis can capture trends and seasonality, it struggles to account for sudden, unpredictable events such as market crashes or regulatory changes. These anomalies can significantly impact the accuracy of forecasts, making risk mitigation strategies essential.

Time series analysis

  • Examines data points over consistent time intervals
  • Identifies patterns: trend, cyclical, seasonal, irregular
  • Used for forecasting, financial modeling, operational decisions

Trend patterns

  • Long-term movements: increasing, decreasing, or stable
  • Help anticipate market demands and strategic planning

Cyclical patterns

  • Reflect business/economic cycles over several years
  • Influenced by macroeconomic factors (inflation, policy, trade)
  • Used to prepare for downturns and growth periods

Seasonal patterns

  • Occur at fixed yearly intervals
  • Driven by holidays, weather, cultural trends
  • Enable optimized production, supply chain, and marketing

Irregular (residual) patterns

  • Unpredictable, caused by unexpected events (e.g., disasters, crises)
  • Not easily forecasted; require risk management strategies

Benefits of time series analysis

  • Identifies trends and cycles for strategic planning
  • Improves forecasting accuracy for operations and budgeting
  • Supports seasonal demand planning
  • Enables early anomaly detection (e.g., fraud, inefficiencies)

Limitations of time series analysis

  • Relies on historical data; may not predict future shifts
  • Requires expertise to distinguish pattern types
  • Vulnerable to disruptions from external events
  • Needs large datasets and advanced statistical tools
  • Struggles to account for sudden, irregular events

Sign up for free to take 6 quiz questions on this topic

Previous
Next  | 6.3.4.4 Exploratory data analysis
All rights reserved ©2016 - 2026 Achievable, Inc.

Time series analysis

Learning outcome statements

The learning outcome statements relevant for this section are:

  1. demonstrate an understanding of time series analyses, including trend, cyclical, seasonal, and irregular patterns
  2. identify and explain the benefits and limitations of time series analysis
  3. explain how to use predictive analytics techniques to draw insights and make recommendations

Definition of time series analysis

Definitions
Time series analysis
A statistical method used to examine data points gathered over consistent time intervals to identify patterns, trends, and fluctuations. It is commonly used in forecasting, financial modeling, and operational decision-making.

The four key patterns observed in a time series analysis include:

1. Trend patterns

These represent long-term movements in data, either upward or downward. A trend can be:

  • increasing,
  • decreasing, or
  • stable over time.

Organizations analyze trend patterns to anticipate market demands and adjust strategies accordingly.

For example, stock prices tend to rise in a growing economy due to increased investor confidence and economic expansion. Conversely, declining birth rates may indicate demographic shifts that affect future workforce availability and economic growth.

2. Cyclical patterns

These reflect economic or business cycles that span several years and tend to repeat at irregular intervals. Unlike seasonal patterns, cyclical movements are influenced by macroeconomic factors such as inflation rates, government policies, and global trade. Businesses use cyclical pattern analysis to prepare for downturns and capitalize on periods of growth.

For example, the housing market experiences cycles of expansion and contraction depending on interest rates, housing supply, and economic stability.

3. Seasonal patterns

These occur at fixed intervals within a year, driven by recurring events such as holidays, weather conditions, or cultural trends. Understanding seasonal variations allows businesses to optimize production schedules, manage supply chains efficiently, and align marketing campaigns with consumer demand.

For example, retailers experience a surge in sales during the holiday season, prompting them to stock up on inventory and increase marketing efforts. Similarly, utility companies anticipate higher electricity consumption in the summer months due to air conditioning usage.

4. Irregular (residual) patterns

These are unpredictable fluctuations that do not follow a set pattern and are often the result of unexpected events. External shocks such as natural disasters, political instability, pandemics, or financial crises can cause sudden disruptions in market behavior. Since irregular patterns cannot be easily predicted, businesses incorporate risk management strategies to mitigate their impact.

For instance, a global pandemic may lead to sharp declines in travel and hospitality revenues while increasing demand for e-commerce and remote work solutions.

Benefits and limitations of time series analysis

Benefits

  • Recognition of trends and cycles: Time series analysis allows organizations to identify long-term trends and cyclical behaviors in the data. By understanding these trends, businesses can develop strategies for sustainable growth and anticipate economic shifts before they occur.
  • Improved forecasting accuracy: By analyzing historical patterns, time series models help predict future values with a higher degree of accuracy. This is particularly useful for inventory management, budgeting, and production planning in industries such as retail, manufacturing, and logistics.
  • Seasonal demand planning: Many industries experience seasonal fluctuations in demand. Time series analysis helps businesses adjust their marketing strategies, staffing, and supply chain logistics accordingly. For instance, e-commerce companies ramp up operations during the holiday season based on past sales trends.
  • Early detection of anomalies: Businesses can detect irregular patterns in data that might indicate operational inefficiencies, fraud, or sudden market changes. Financial institutions use time series analysis to detect unusual transaction patterns that could signal fraudulent activities.

Limitations

  • Dependence on historical data: Time series models assume that past patterns will continue into the future, which may not always hold true, especially in dynamic industries affected by rapid technological advancements or shifting consumer preferences.
  • Complexity in identifying patterns: Differentiating between trend, cyclical, seasonal, and irregular patterns requires expertise in statistical modeling. Without proper analysis, businesses may misinterpret data and make flawed predictions.
  • Influence of external factors: Unexpected external events such as financial crises, policy changes, or natural disasters can disrupt established trends, making time series forecasts unreliable. For instance, the COVID-19 pandemic dramatically altered consumer behavior in ways that historical data could not predict.
  • Computational and data requirements: Effective time series forecasting often requires large datasets and sophisticated statistical tools, increasing the cost and technical requirements for implementation.
  • Difficulty in accounting for irregular events: While time series analysis can capture trends and seasonality, it struggles to account for sudden, unpredictable events such as market crashes or regulatory changes. These anomalies can significantly impact the accuracy of forecasts, making risk mitigation strategies essential.
Key points

Time series analysis

  • Examines data points over consistent time intervals
  • Identifies patterns: trend, cyclical, seasonal, irregular
  • Used for forecasting, financial modeling, operational decisions

Trend patterns

  • Long-term movements: increasing, decreasing, or stable
  • Help anticipate market demands and strategic planning

Cyclical patterns

  • Reflect business/economic cycles over several years
  • Influenced by macroeconomic factors (inflation, policy, trade)
  • Used to prepare for downturns and growth periods

Seasonal patterns

  • Occur at fixed yearly intervals
  • Driven by holidays, weather, cultural trends
  • Enable optimized production, supply chain, and marketing

Irregular (residual) patterns

  • Unpredictable, caused by unexpected events (e.g., disasters, crises)
  • Not easily forecasted; require risk management strategies

Benefits of time series analysis

  • Identifies trends and cycles for strategic planning
  • Improves forecasting accuracy for operations and budgeting
  • Supports seasonal demand planning
  • Enables early anomaly detection (e.g., fraud, inefficiencies)

Limitations of time series analysis

  • Relies on historical data; may not predict future shifts
  • Requires expertise to distinguish pattern types
  • Vulnerable to disruptions from external events
  • Needs large datasets and advanced statistical tools
  • Struggles to account for sudden, irregular events

More from Types of data analytics

  • Introduction to types of data analytics
  • Regression and statistical methods
  • Exploratory data analysis
  • Sensitivity analysis
  • Simulation models