



Regression and statistical methods
Learning outcome statements
The learning outcome statements relevant for this section are:
- demonstrate an understanding of multiple regression and logistic regression and recognize when these techniques are appropriate
- calculate the result of multiple regression equations as applied to a specific situation
- demonstrate an understanding of the coefficient of determination (R squared) and the correlation coefficient
- identify and explain the benefits and limitations of regression analysis
- define standard error of the estimate, goodness of fit, and confidence interval
- explain how to use predictive analytics techniques to draw insights and make recommendations
Defining a multiple regression equation
Multiple regression involves more than one independent variable. The equation for multiple regression is:
Where:
- Y = dependent variable (the outcome being explained)
- a = intercept (value of Y when all X’s are zero)
- b1, b2, … bn = coefficients (slopes showing the impact of each independent variable on Y)
- X1, X2, … Xn = independent variables (factors that influence Y)
- ε = error term (variation not explained by the model)
When to use multiple regression in data analytics
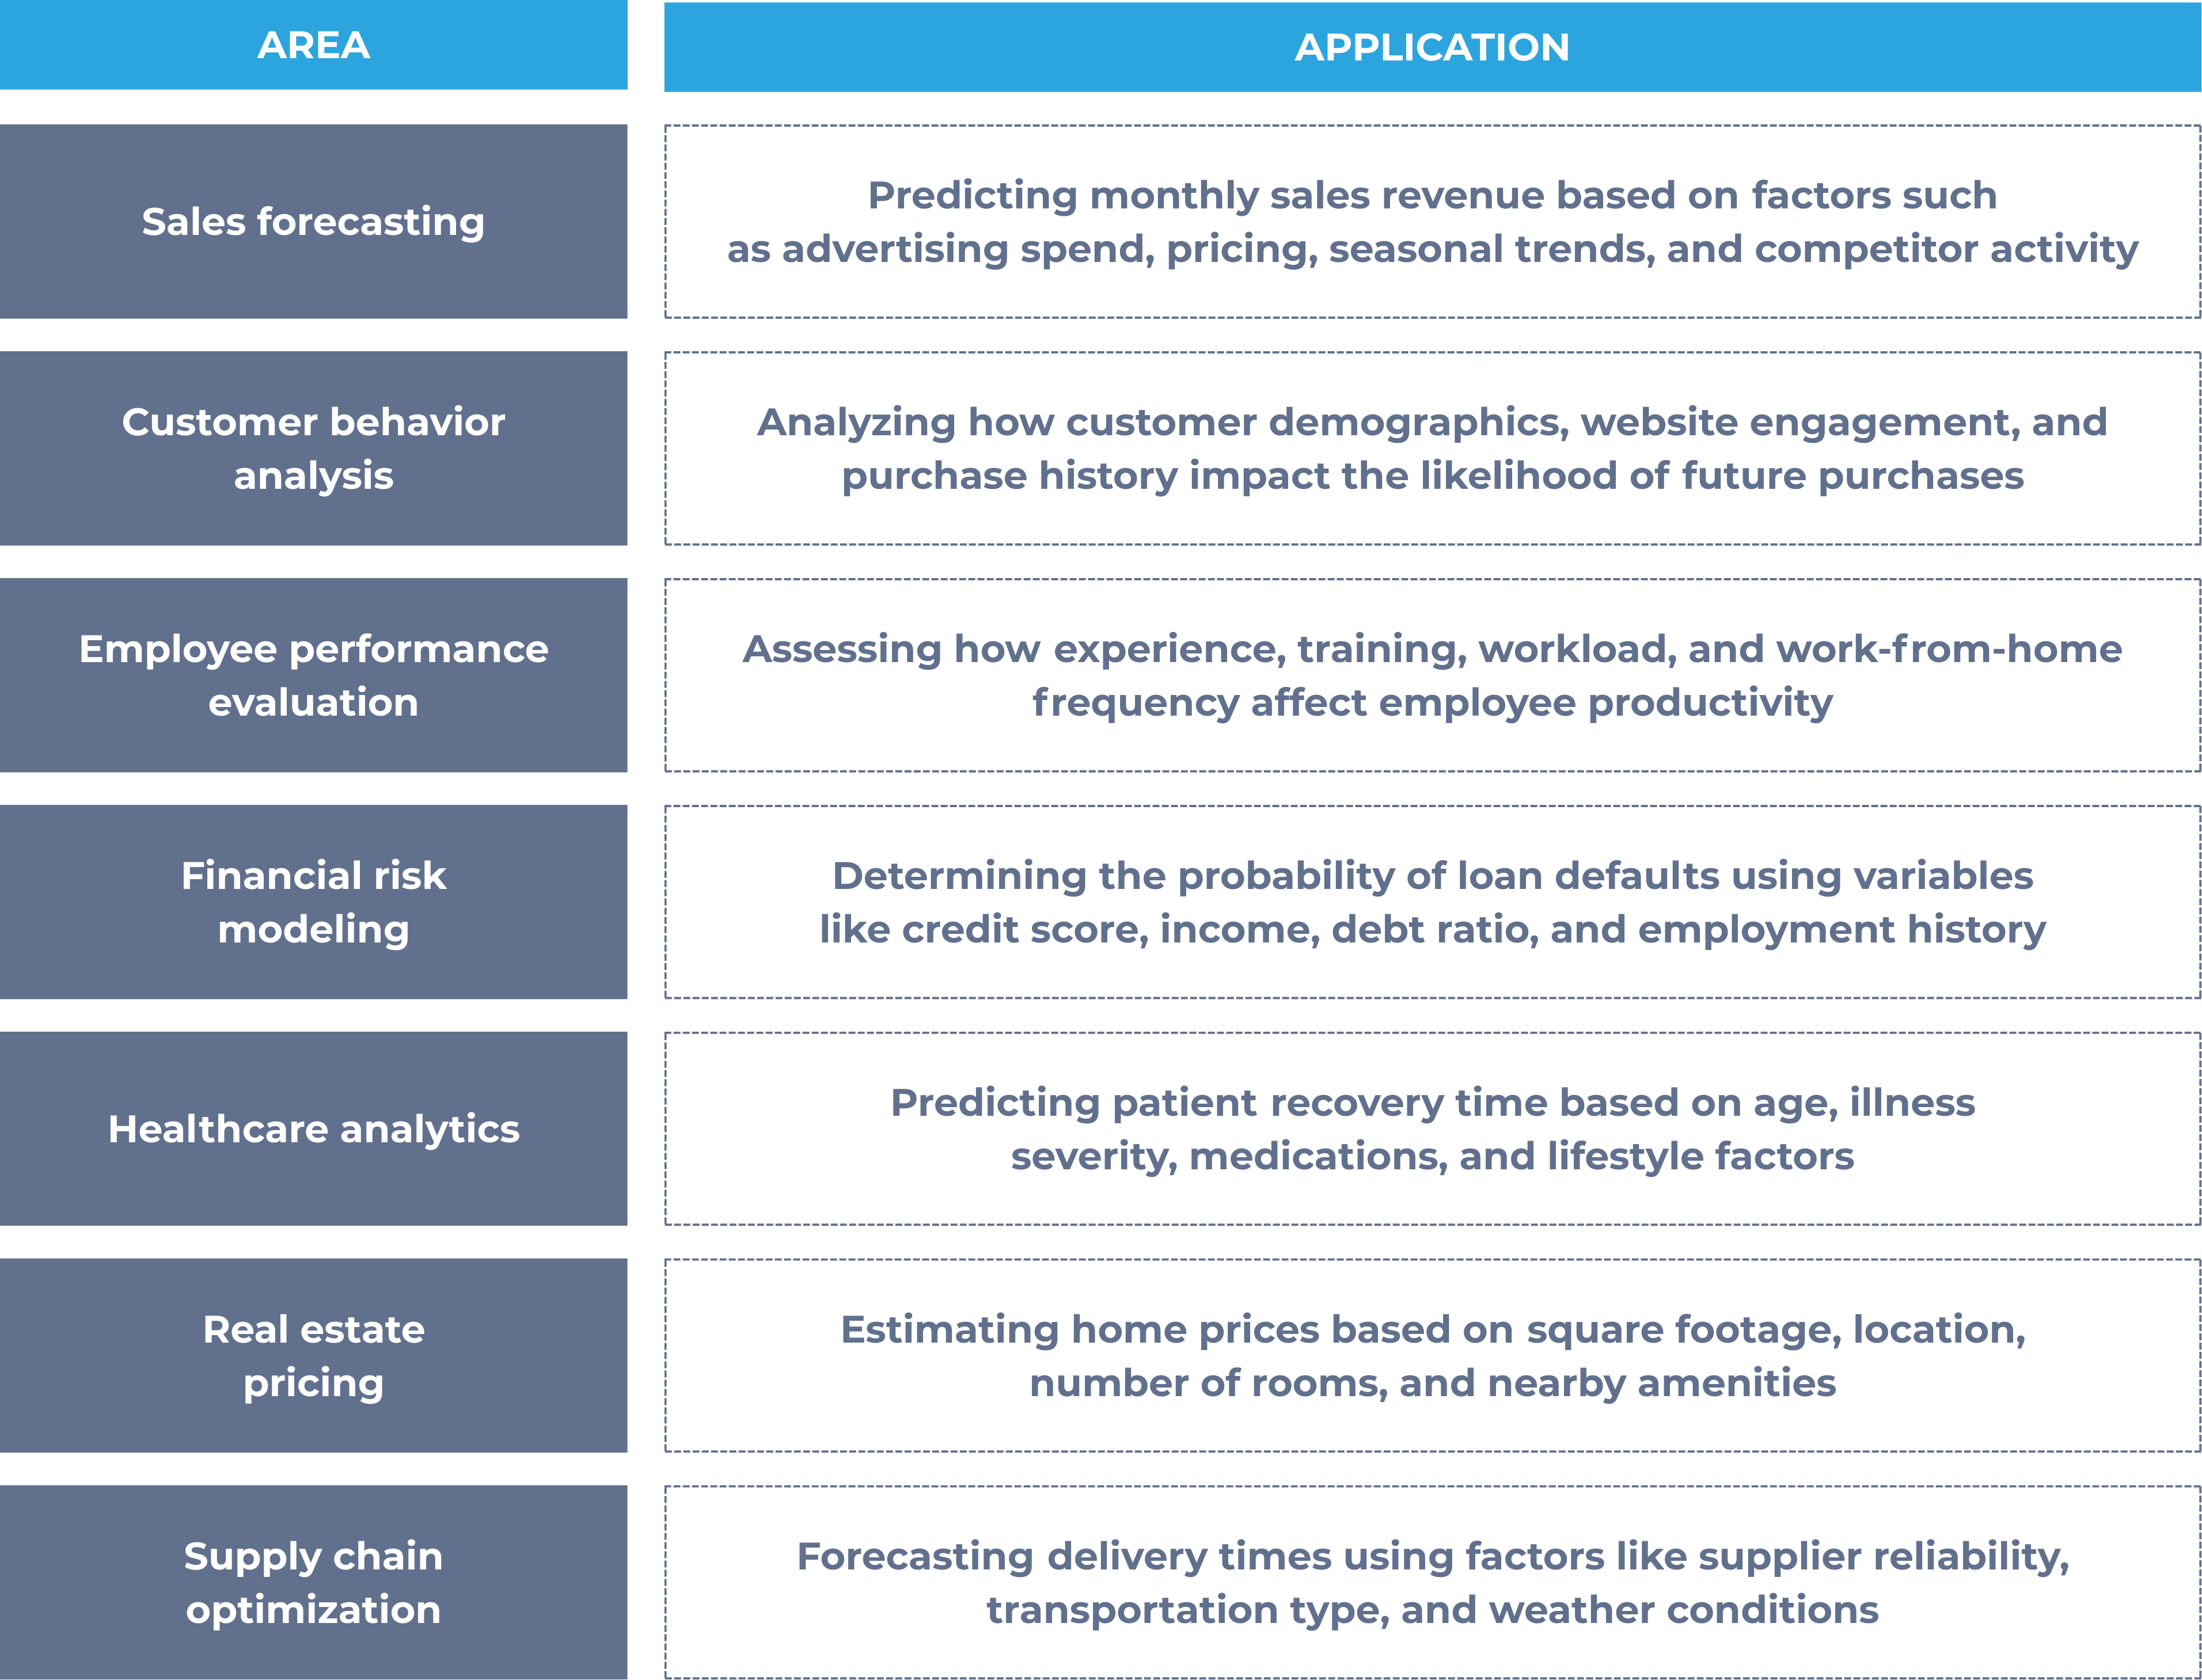
Multiple regression is used when a dependent variable is influenced by multiple factors, allowing analysts to measure relationships and make predictions. Below are common applications of multiple regression:
Multiple regression is appropriate when multiple independent variables influence an outcome, helping businesses and analysts improve predictions, optimize strategies, and make data-driven decisions.
Benefits and shortcomings of regression analysis
Coefficient of determination (R²) and correlation coefficient
In data analytics, understanding relationships between variables is critical for making informed predictions and decisions. Two key statistical measures used for this purpose are:
- coefficient of determination (R²) and
- correlation coefficient
Correlation coefficient
The measures the strength and direction of a linear relationship between two variables. It ranges from
- indicates a perfect positive correlation, meaning as one variable increases, the other also increases.
- indicates a perfect negative correlation, meaning as one variable increases, the other decreases.
- suggests no linear correlation between the variables.
In data analytics, correlation helps determine whether a relationship exists between two variables, such as marketing spend and revenue.
Coefficient of determination (R²)
The tells us how well the independent variable(s) explain the variability of the dependent variable. It ranges from :
- means the independent variable explains none of the variation in the dependent variable.
- means the independent variable explains 100% of the variation.
In data analytics, a higher value indicates a better model fit, meaning the independent variables are strong predictors of the dependent variable.
For example, in sales forecasting, if an R² value is 0.85, it means 85% of the variation in sales can be explained by the independent variables (such as advertising spend, promotions, and seasonality). This helps businesses evaluate the reliability of their predictive models.
Standard error of the estimate (SEE), goodness of fit, and confidence interval
In data analytics, these statistical concepts help evaluate how well a model fits data and how reliable predictions are. These concepts play a crucial role in data analytics by ensuring models are statistically valid, reducing uncertainty, and improving decision-making based on data-driven insights.
Standard error of the estimate (SEE)
The SEE measures the accuracy of predictions in a regression model. A lower SEE means that the predicted values are closer to the actual values, indicating a better model fit. It is useful in data analytics to assess the reliability of predictive models, such as forecasting customer demand based on past sales data.
Goodness of fit
This term refers to how well a statistical model matches the observed data. is a commonly used measure of goodness of fit. A model with poor goodness of fit may lead to inaccurate insights and poor decision-making. In financial risk modeling, analysts assess the goodness of fit to determine if a model accurately predicts stock price movements.
Confidence interval (CI)
A confidence interval (CI) is a statistical range that estimates where a true population parameter (such as a mean or regression coefficient) is likely to fall, given a specified level of confidence (e.g., 95%). It reflects the degree of uncertainty around an estimate rather than providing a single point value.
For example, if revenue is forecasted to increase by $10 million with a 95% CI of ±$1 million, it means we can be 95% confident that the actual increase will fall between $9 million and $11 million.