


This browser is too old to run Achievable.

Update it, or open this page in a current version of Chrome, Safari, Firefox or Edge. On an iPhone or iPad, update iOS: every browser there runs on the version of Safari that comes with it.

Achievable logoAchievable logo
CMA Part 1
Sign in
Sign up
Purchase
Textbook
Practice exams
Support
How it works
Resources
Exam catalog
Mountain with a flag at the peak
Textbook
Introduction
1. External financial reporting decisions
2. Planning, budgeting, and forecasting
3. Performance management
3.1 Cost and variance measures
3.2 Responsibility centers and reporting segments
3.3 Performance measures
3.3.1 Profitability analysis
3.3.2 Calculating and evaluating profitability
3.3.3 Return on investment (ROI) and Residual Income (RI)
3.3.4 Investment base and calculation issues for ROI and RI
3.3.5 Key Performance Indicators (KPIs) and the Balanced Scorecard
4. Cost management
5. Internal control
6. Technology and analytics
Wrapping up
Achievable logoAchievable logo
3.3.5 Key Performance Indicators (KPIs) and the Balanced Scorecard
Achievable CMA Part 1
3. Performance management
3.3. Performance measures
Our CMA Part 1 course is currently in development and is a work-in-progress.

Key Performance Indicators (KPIs) and the Balanced Scorecard

9 min read
Font
Discuss
Share
Feedback

The learning outcome statements relevant for this section are:

  1. define critical success factors (CSFs) and KPIs and discuss the importance of these measures in evaluating an organization
  2. define the concept of a balanced scorecard and identify its components
  3. identify and describe the perspectives of a balanced scorecard, including financial, customer, internal process, and learning and growth
  4. identify and describe the characteristics of an effective balanced scorecard
  5. demonstrate an understanding of a strategy map and the role it plays
  6. analyze and interpret a balanced scorecard and evaluate performance based on the analysis
  7. recommend performance measures and a periodic reporting methodology given operational goals and actual results

Critical success factors (CSFs) and key performance indicators (KPIs)

Definitions
Critical success factors (CSFs)
These represent the essential elements or activities that an organization must achieve to meet its strategic objectives. These factors are specific to an organization’s mission, vision, and goals, and they provide the foundation for achieving competitive advantage. For instance, a CSF for a manufacturing company might be maintaining high product quality, while a CSF for a retail organization might be exceptional customer service.
Key performance indicators (KPIs)
These are measurable values that track progress toward achieving CSFs. They are quantifiable metrics used to evaluate success in meeting specific objectives. For example, a KPI for product quality could be the defect rate, and a KPI for customer service might be the average response time to customer inquiries. Together, CSFs and KPIs provide a structured way to monitor and evaluate organizational performance.

CSFs and KPIs are essential for evaluating an organization because they bridge the gap between strategic goals and operational performance. By focusing on CSFs, organizations can prioritize the activities that directly impact their success. KPIs, in turn, provide the tools to measure progress and identify areas for improvement. These measures help organizations ensure alignment between day-to-day operations and long-term strategic objectives, enabling timely decision-making and resource allocation.

The balanced scorecard

Definitions
Balanced scorecard (BSC)
A strategic management tool that provides a comprehensive framework for evaluating organizational performance. Unlike traditional performance measures that focus solely on financial outcomes, the BSC integrates both financial and non-financial metrics to provide a holistic view of an organization’s performance.

The balanced scorecard is typically organized into four key components or perspectives:

  1. Financial perspective: Focuses on financial outcomes such as revenue growth, cost management, and profitability, ensuring that the organization’s strategic goals translate into financial success.
  2. Customer perspective: Evaluates customer satisfaction, retention, and acquisition metrics to ensure that the organization is meeting customer needs and expectations.
  3. Internal process perspective: Measures the efficiency and effectiveness of internal operations that drive value creation, such as production processes, innovation, and quality control.
  4. Learning and growth perspective: Focuses on the organization’s capacity for long-term improvement through employee development, knowledge management, and fostering innovation.

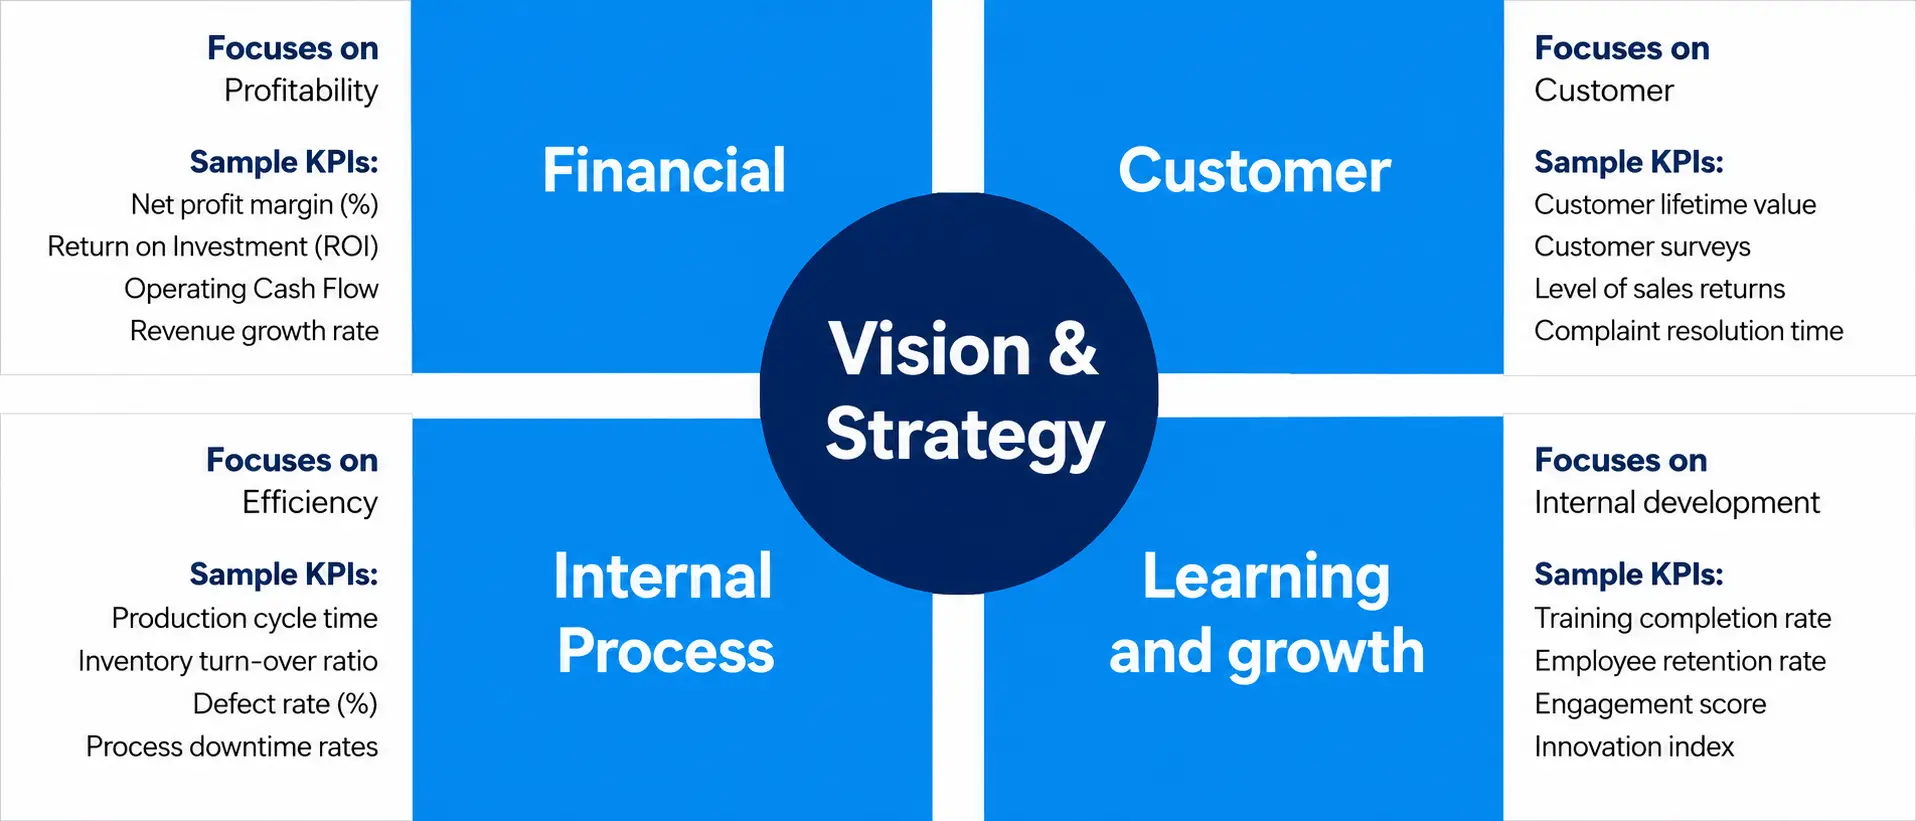
The illustration below highlights the various dimensions of the balanced scorecard, each accompanied by specific goals and KPIs. It emphasizes that the company’s strategy and objectives serve as the central focus, guiding all performance measures.

Four-quadrant diagram of balanced scorecard perspectives around vision and strategy with sample KPIs.
Balanced Scorecard Perspectives
Achievable

By linking these perspectives, the balanced scorecard enables organizations to align their performance metrics with their strategic objectives, ensuring that every aspect of the business contributes to overall success.

Characteristics of an effective balanced scorecard

An effective balanced scorecard (BSC) is more than just a collection of metrics; it is a strategic tool designed to drive organizational success. For a BSC to be effective, it must exhibit several key characteristics that ensure alignment, clarity, and actionable insights:

  • Alignment with strategic objectives: Each metric within the BSC should directly support the company’s mission and goals, ensuring that all activities contribute to achieving desired outcomes. Misaligned metrics can lead to wasted resources and conflicting priorities.
  • Balanced representation: The BSC must provide a balanced representation of performance across its four perspectives: financial, customer, internal process, and learning and growth. This balance ensures that no single aspect of the organization is emphasized at the expense of others, promoting holistic improvement and sustainability.
  • Measurable and actionable metrics: Metrics within the BSC must be clear and quantifiable, allowing for consistent tracking and comparison over time. Actionable metrics enable managers to make informed decisions and implement changes that drive improvements.
  • Timely and accurate data: An effective BSC incorporates timely and accurate data. Regular updates ensure that the organization can respond quickly to changes and maintain a dynamic approach to performance management. Without accurate and current data, the BSC loses its relevance and effectiveness.
  • Mix of leading and lagging indicators: An effective BSC links measures by cause and effect. Lagging (outcome) measures such as profit or market share show results after the fact, while leading (driver) measures such as training hours or defect rate predict those results and give managers time to act. Keeping the total number of measures limited keeps attention on the few that actually drive strategy.

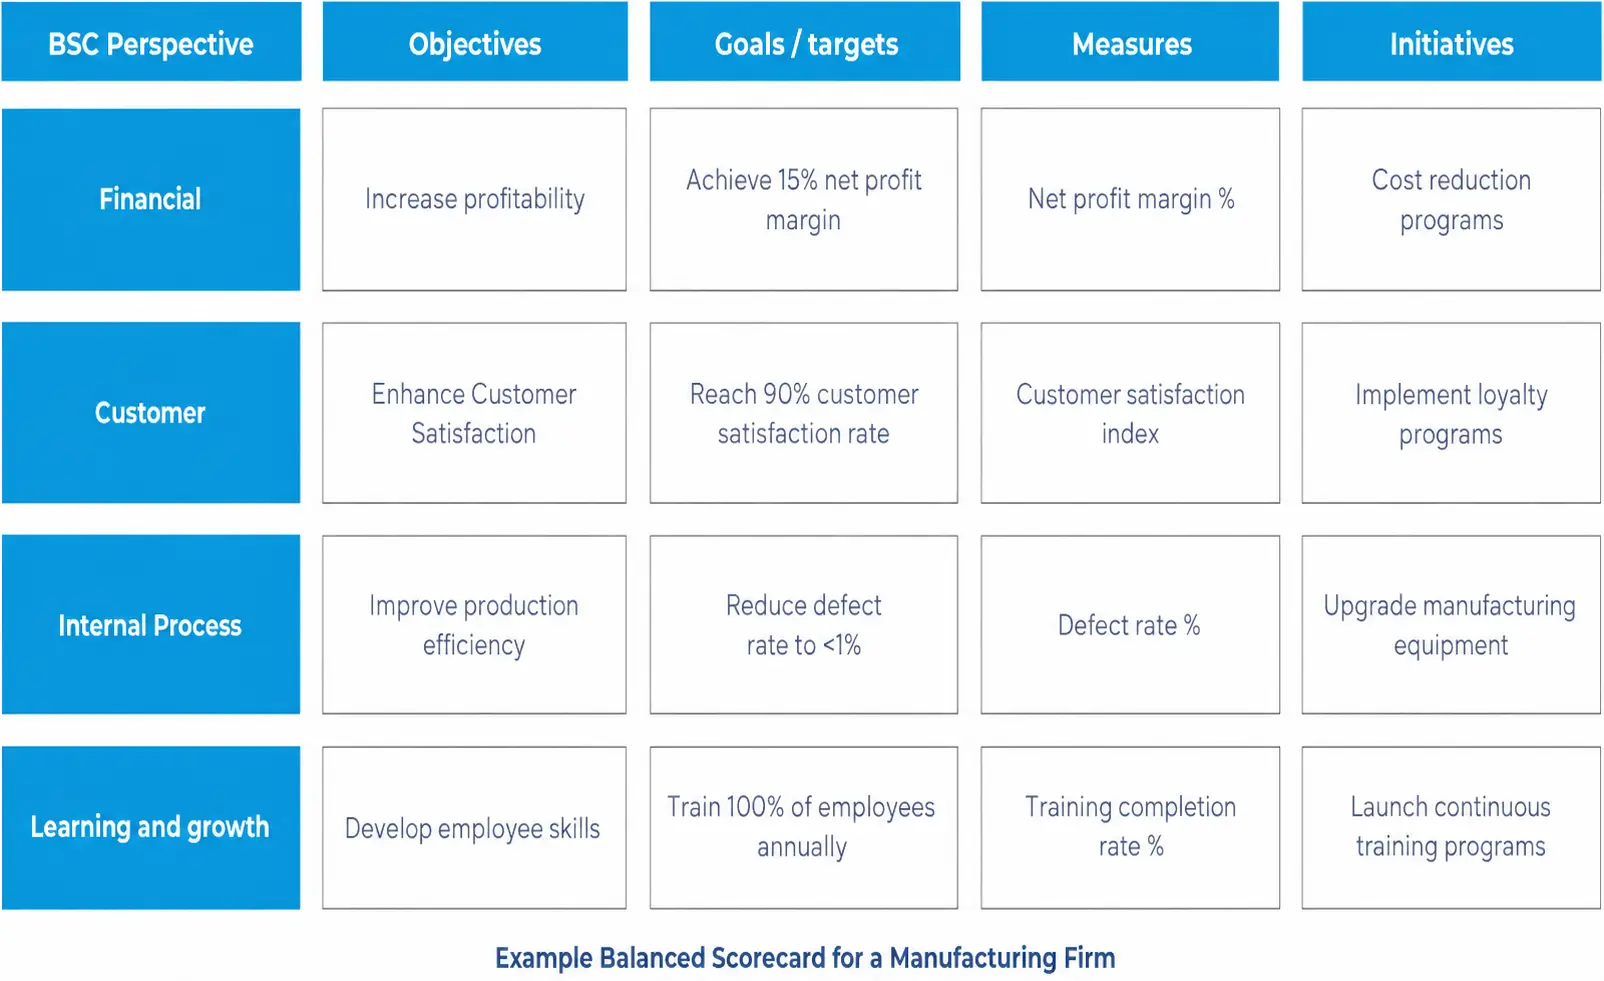
Below is an example of a balanced scorecard (BSC) for a manufacturing firm, typically organized in a table format to show the integration of strategy and metrics across perspectives:

Example of a balanced scorecard for a manufacturing firm listing objectives, goals, measures, and initiatives.
Manufacturing Balanced Scorecard
Achievable

This table aligns the organization’s strategy with actionable goals, measurable metrics, and specific initiatives, ensuring every perspective contributes to the overall success of the manufacturing firm. Note that actual balanced scorecards are typically more detailed and comprehensive, encompassing a broader range of metrics and initiatives to fully capture organizational performance.

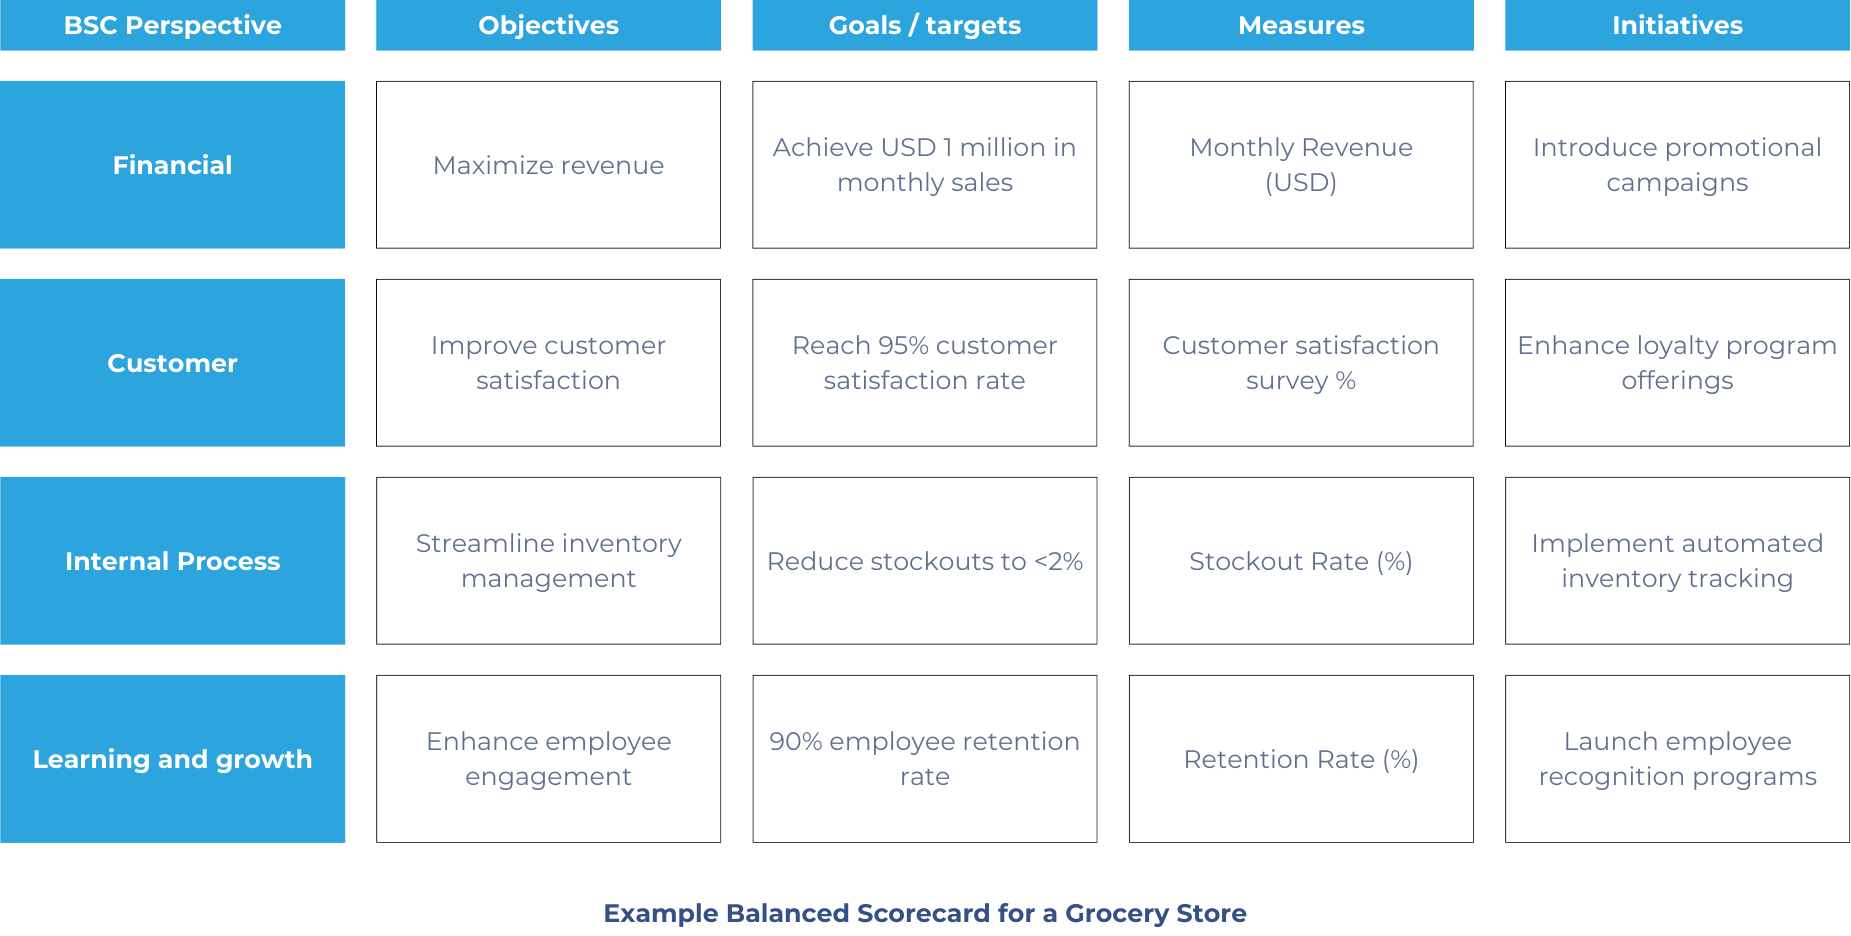
Below is another example of a balanced scorecard (BSC) for a grocery store, structured to reflect its unique operational focus:

Grocery store balanced scorecard listing objectives, goals, measures, and initiatives for each perspective.
Balanced Scorecard for Grocery Store
Achievable

This example demonstrates how a grocery store can align its strategic objectives with actionable goals and measures, ensuring all operations contribute to customer satisfaction, operational efficiency, and financial success. As with all balanced scorecards, actual implementations are often more detailed and tailored to specific organizational needs.

Example: Evaluating performance from a scorecard

A manufacturing firm’s balanced scorecard reports the following results for the quarter:

Perspective Measure Target Actual Met?
Learning and growth Training hours per employee 40 22 No
Internal process Defect rate 1% 2.5% No
Customer Customer satisfaction 90% 82% No
Financial Operating margin 12% 9% No

Answer: Tracing the results through the scorecard’s cause-and-effect chain points to a single root cause spreading through the business: employees received barely half of their planned training hours, and the defect rate more than doubled its target as a result. Those defects dragged customer satisfaction down, which in turn pulled operating margin three points below target. The financial measure alone would not reveal why margin fell short - only tracing it back through the non-financial perspectives does. The recommended corrective action is restoring the training program, since it’s the measure furthest upstream in the chain.

Recommending measures and reporting frequency

  • Start from each operational goal and ask what drives it; that driver becomes the measure to track.
  • Report operational, leading measures (training hours, defect rate, response time) daily or weekly to the managers who control the underlying process.
  • Report strategic and financial, lagging measures monthly or quarterly to senior management.
  • Present actuals against targets, highlight variances, and explain them by exception rather than reporting on every measure in equal depth.

Strategy map

Definitions
Strategy map
A visual representation of the strategic objectives and relationships within a balanced scorecard framework. It connects the four perspectives of the balanced scorecard by illustrating how specific goals interlink to achieve the organization’s overall strategy.

A strategy map provides a cause-and-effect view of how objectives in one perspective influence outcomes in another. For example, investments in employee training and development (learning and growth perspective) can lead to improved operational efficiency (internal process perspective), resulting in higher customer satisfaction (customer perspective) and ultimately better financial performance (financial perspective). This interconnected structure ensures that every objective supports the organization’s strategic vision.

Benefits of using a strategy map

  • Alignment: Ensures that all goals and activities align with the organization’s strategic priorities, reducing misaligned efforts.
  • Clarity: Offers a clear and concise visualization of how different objectives and activities contribute to overall success.
  • Focus: Helps managers prioritize initiatives and allocate resources effectively by understanding the key drivers of success.
  • Communication: Enhances communication across the organization by providing a shared framework for understanding and implementing strategy.

Example application

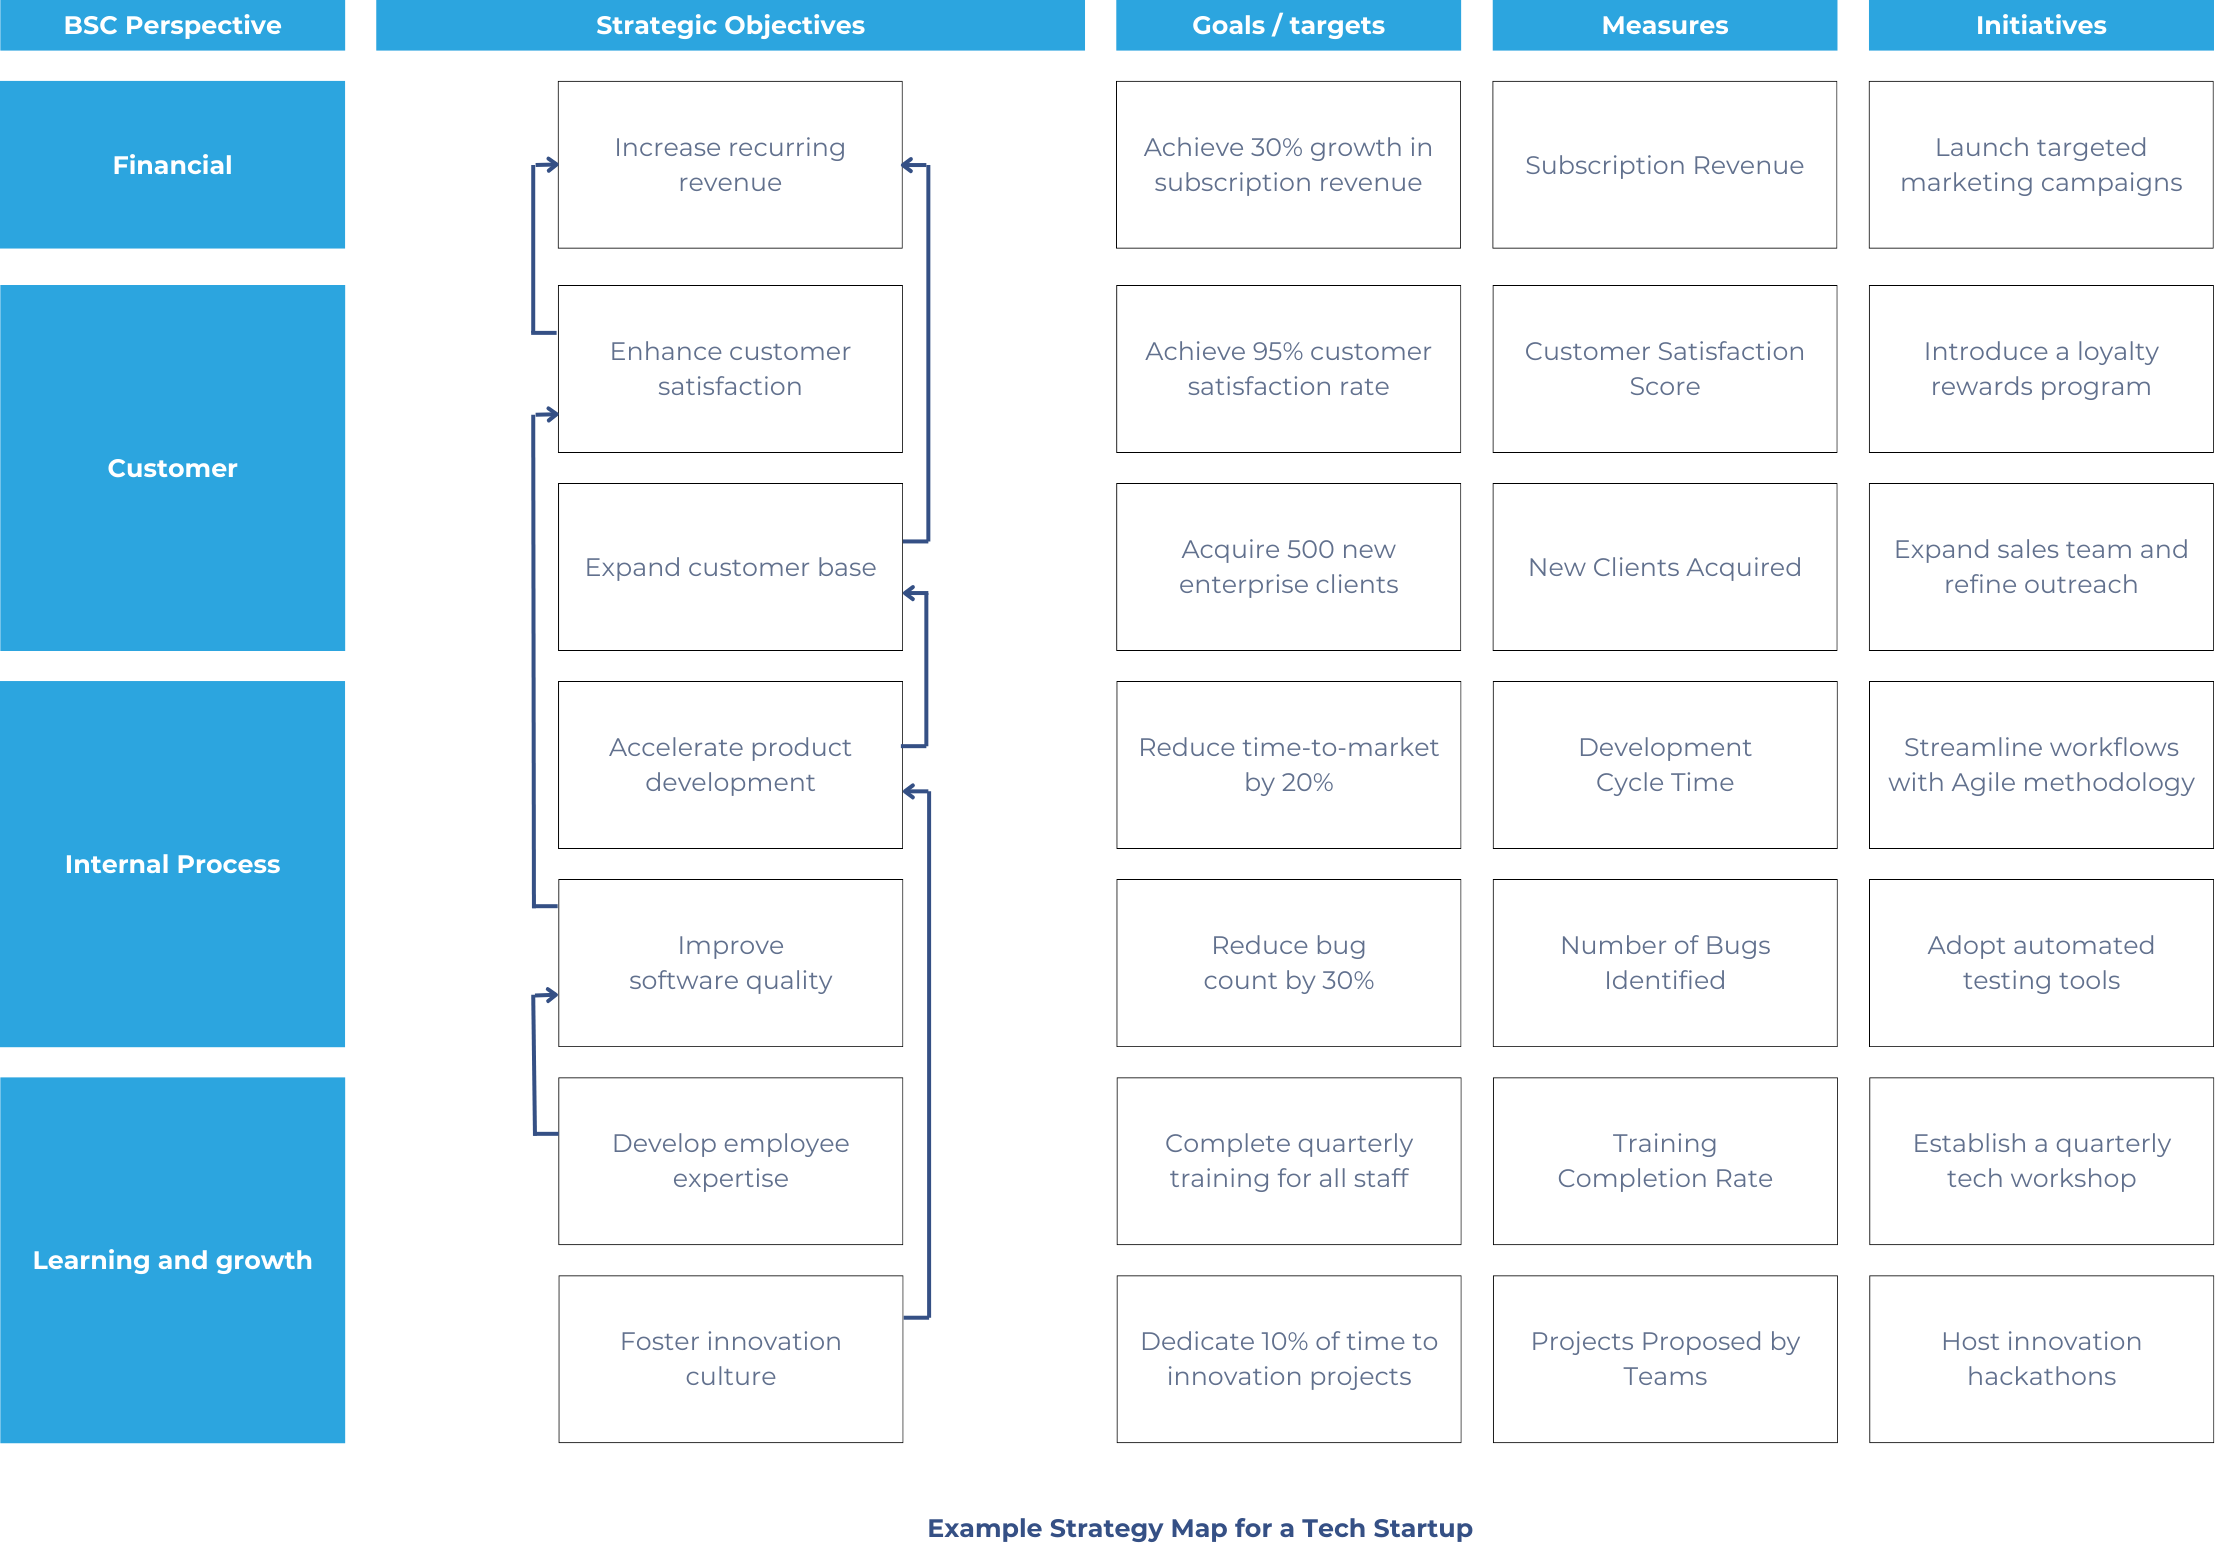
Consider an organization that prioritizes innovation. Its strategy map might show how investments in research and development (learning and growth perspective) lead to process improvements (internal process perspective), which enable the creation of cutting-edge products (customer perspective) and drive revenue growth (financial perspective). By linking these goals visually, the strategy map provides a roadmap for achieving the organization’s objectives.

Strategy map linking learning and growth objectives through internal process and customer objectives to financial outcomes.
Strategy Map Example
Achievable

CSFs and KPIs

  • Critical success factors (CSFs): essential activities/elements an organization must achieve to meet strategic objectives (e.g., product quality, customer service)
  • Key performance indicators (KPIs): quantifiable metrics that track progress toward CSFs (e.g., defect rate, response time)
  • Together they bridge strategic goals and operational performance, enabling alignment and timely decision-making

Balanced scorecard (BSC) overview

  • Strategic management tool combining financial and non-financial metrics for a holistic performance view
  • Four perspectives:
    • Financial: revenue, cost, profitability outcomes
    • Customer: satisfaction, retention, acquisition
    • Internal process: efficiency/effectiveness of operations driving value
    • Learning and growth: employee development, innovation, long-term capacity
  • Strategy/objectives sit at the center, guiding all four perspectives

Characteristics of an effective BSC

  • Aligned with strategic objectives; avoids wasted/conflicting efforts
  • Balanced across all four perspectives (no single area dominates)
  • Measurable, actionable, and based on timely, accurate data
  • Mixes leading (driver) indicators like training hours/defect rate with lagging (outcome) indicators like profit/market share
  • Keeps total measures limited to focus attention on key strategy drivers

Analyzing and interpreting a scorecard

  • Trace missed targets through the cause-and-effect chain, starting from learning & growth and moving to financial
  • Example: low training hours → high defect rate → low customer satisfaction → low operating margin
  • Root cause typically lies in the most upstream (leading) measure; corrective action should target that driver first
  • Financial results alone don’t explain “why” — non-financial perspectives provide the explanation

Recommending measures and reporting

  • Identify the driver behind each operational goal to select the right measure
  • Report leading/operational measures (training hours, defect rate) frequently (daily/weekly) to process managers
  • Report lagging/financial measures monthly or quarterly to senior management
  • Present actual vs. target, highlight variances, and report by exception rather than equal depth for all measures

Strategy map

  • Visual tool showing cause-and-effect links between the four BSC perspectives
  • Typical flow: learning & growth → internal process → customer → financial outcomes
  • Benefits: alignment, clarity, focus (prioritization/resource allocation), and improved organizational communication
  • Example: R&D investment → process improvement → innovative products → revenue growth

Sign up for free to take 11 quiz questions on this topic

Previous
Next  | 4.1.1 Cost behavior, cost objects, and cost pools
All rights reserved ©2016 - 2026 Achievable, Inc.

Key Performance Indicators (KPIs) and the Balanced Scorecard

The learning outcome statements relevant for this section are:

  1. define critical success factors (CSFs) and KPIs and discuss the importance of these measures in evaluating an organization
  2. define the concept of a balanced scorecard and identify its components
  3. identify and describe the perspectives of a balanced scorecard, including financial, customer, internal process, and learning and growth
  4. identify and describe the characteristics of an effective balanced scorecard
  5. demonstrate an understanding of a strategy map and the role it plays
  6. analyze and interpret a balanced scorecard and evaluate performance based on the analysis
  7. recommend performance measures and a periodic reporting methodology given operational goals and actual results

Critical success factors (CSFs) and key performance indicators (KPIs)

Definitions
Critical success factors (CSFs)
These represent the essential elements or activities that an organization must achieve to meet its strategic objectives. These factors are specific to an organization’s mission, vision, and goals, and they provide the foundation for achieving competitive advantage. For instance, a CSF for a manufacturing company might be maintaining high product quality, while a CSF for a retail organization might be exceptional customer service.
Key performance indicators (KPIs)
These are measurable values that track progress toward achieving CSFs. They are quantifiable metrics used to evaluate success in meeting specific objectives. For example, a KPI for product quality could be the defect rate, and a KPI for customer service might be the average response time to customer inquiries. Together, CSFs and KPIs provide a structured way to monitor and evaluate organizational performance.

CSFs and KPIs are essential for evaluating an organization because they bridge the gap between strategic goals and operational performance. By focusing on CSFs, organizations can prioritize the activities that directly impact their success. KPIs, in turn, provide the tools to measure progress and identify areas for improvement. These measures help organizations ensure alignment between day-to-day operations and long-term strategic objectives, enabling timely decision-making and resource allocation.

The balanced scorecard

Definitions
Balanced scorecard (BSC)
A strategic management tool that provides a comprehensive framework for evaluating organizational performance. Unlike traditional performance measures that focus solely on financial outcomes, the BSC integrates both financial and non-financial metrics to provide a holistic view of an organization’s performance.

The balanced scorecard is typically organized into four key components or perspectives:

  1. Financial perspective: Focuses on financial outcomes such as revenue growth, cost management, and profitability, ensuring that the organization’s strategic goals translate into financial success.
  2. Customer perspective: Evaluates customer satisfaction, retention, and acquisition metrics to ensure that the organization is meeting customer needs and expectations.
  3. Internal process perspective: Measures the efficiency and effectiveness of internal operations that drive value creation, such as production processes, innovation, and quality control.
  4. Learning and growth perspective: Focuses on the organization’s capacity for long-term improvement through employee development, knowledge management, and fostering innovation.

The illustration below highlights the various dimensions of the balanced scorecard, each accompanied by specific goals and KPIs. It emphasizes that the company’s strategy and objectives serve as the central focus, guiding all performance measures.

By linking these perspectives, the balanced scorecard enables organizations to align their performance metrics with their strategic objectives, ensuring that every aspect of the business contributes to overall success.

Characteristics of an effective balanced scorecard

An effective balanced scorecard (BSC) is more than just a collection of metrics; it is a strategic tool designed to drive organizational success. For a BSC to be effective, it must exhibit several key characteristics that ensure alignment, clarity, and actionable insights:

  • Alignment with strategic objectives: Each metric within the BSC should directly support the company’s mission and goals, ensuring that all activities contribute to achieving desired outcomes. Misaligned metrics can lead to wasted resources and conflicting priorities.
  • Balanced representation: The BSC must provide a balanced representation of performance across its four perspectives: financial, customer, internal process, and learning and growth. This balance ensures that no single aspect of the organization is emphasized at the expense of others, promoting holistic improvement and sustainability.
  • Measurable and actionable metrics: Metrics within the BSC must be clear and quantifiable, allowing for consistent tracking and comparison over time. Actionable metrics enable managers to make informed decisions and implement changes that drive improvements.
  • Timely and accurate data: An effective BSC incorporates timely and accurate data. Regular updates ensure that the organization can respond quickly to changes and maintain a dynamic approach to performance management. Without accurate and current data, the BSC loses its relevance and effectiveness.
  • Mix of leading and lagging indicators: An effective BSC links measures by cause and effect. Lagging (outcome) measures such as profit or market share show results after the fact, while leading (driver) measures such as training hours or defect rate predict those results and give managers time to act. Keeping the total number of measures limited keeps attention on the few that actually drive strategy.

Below is an example of a balanced scorecard (BSC) for a manufacturing firm, typically organized in a table format to show the integration of strategy and metrics across perspectives:

This table aligns the organization’s strategy with actionable goals, measurable metrics, and specific initiatives, ensuring every perspective contributes to the overall success of the manufacturing firm. Note that actual balanced scorecards are typically more detailed and comprehensive, encompassing a broader range of metrics and initiatives to fully capture organizational performance.

Below is another example of a balanced scorecard (BSC) for a grocery store, structured to reflect its unique operational focus:

This example demonstrates how a grocery store can align its strategic objectives with actionable goals and measures, ensuring all operations contribute to customer satisfaction, operational efficiency, and financial success. As with all balanced scorecards, actual implementations are often more detailed and tailored to specific organizational needs.

Example: Evaluating performance from a scorecard

A manufacturing firm’s balanced scorecard reports the following results for the quarter:

Perspective Measure Target Actual Met?
Learning and growth Training hours per employee 40 22 No
Internal process Defect rate 1% 2.5% No
Customer Customer satisfaction 90% 82% No
Financial Operating margin 12% 9% No

Answer: Tracing the results through the scorecard’s cause-and-effect chain points to a single root cause spreading through the business: employees received barely half of their planned training hours, and the defect rate more than doubled its target as a result. Those defects dragged customer satisfaction down, which in turn pulled operating margin three points below target. The financial measure alone would not reveal why margin fell short - only tracing it back through the non-financial perspectives does. The recommended corrective action is restoring the training program, since it’s the measure furthest upstream in the chain.

Recommending measures and reporting frequency

  • Start from each operational goal and ask what drives it; that driver becomes the measure to track.
  • Report operational, leading measures (training hours, defect rate, response time) daily or weekly to the managers who control the underlying process.
  • Report strategic and financial, lagging measures monthly or quarterly to senior management.
  • Present actuals against targets, highlight variances, and explain them by exception rather than reporting on every measure in equal depth.

Strategy map

Definitions
Strategy map
A visual representation of the strategic objectives and relationships within a balanced scorecard framework. It connects the four perspectives of the balanced scorecard by illustrating how specific goals interlink to achieve the organization’s overall strategy.

A strategy map provides a cause-and-effect view of how objectives in one perspective influence outcomes in another. For example, investments in employee training and development (learning and growth perspective) can lead to improved operational efficiency (internal process perspective), resulting in higher customer satisfaction (customer perspective) and ultimately better financial performance (financial perspective). This interconnected structure ensures that every objective supports the organization’s strategic vision.

Benefits of using a strategy map

  • Alignment: Ensures that all goals and activities align with the organization’s strategic priorities, reducing misaligned efforts.
  • Clarity: Offers a clear and concise visualization of how different objectives and activities contribute to overall success.
  • Focus: Helps managers prioritize initiatives and allocate resources effectively by understanding the key drivers of success.
  • Communication: Enhances communication across the organization by providing a shared framework for understanding and implementing strategy.

Example application

Consider an organization that prioritizes innovation. Its strategy map might show how investments in research and development (learning and growth perspective) lead to process improvements (internal process perspective), which enable the creation of cutting-edge products (customer perspective) and drive revenue growth (financial perspective). By linking these goals visually, the strategy map provides a roadmap for achieving the organization’s objectives.

Key points

CSFs and KPIs

  • Critical success factors (CSFs): essential activities/elements an organization must achieve to meet strategic objectives (e.g., product quality, customer service)
  • Key performance indicators (KPIs): quantifiable metrics that track progress toward CSFs (e.g., defect rate, response time)
  • Together they bridge strategic goals and operational performance, enabling alignment and timely decision-making

Balanced scorecard (BSC) overview

  • Strategic management tool combining financial and non-financial metrics for a holistic performance view
  • Four perspectives:
    • Financial: revenue, cost, profitability outcomes
    • Customer: satisfaction, retention, acquisition
    • Internal process: efficiency/effectiveness of operations driving value
    • Learning and growth: employee development, innovation, long-term capacity
  • Strategy/objectives sit at the center, guiding all four perspectives

Characteristics of an effective BSC

  • Aligned with strategic objectives; avoids wasted/conflicting efforts
  • Balanced across all four perspectives (no single area dominates)
  • Measurable, actionable, and based on timely, accurate data
  • Mixes leading (driver) indicators like training hours/defect rate with lagging (outcome) indicators like profit/market share
  • Keeps total measures limited to focus attention on key strategy drivers

Analyzing and interpreting a scorecard

  • Trace missed targets through the cause-and-effect chain, starting from learning & growth and moving to financial
  • Example: low training hours → high defect rate → low customer satisfaction → low operating margin
  • Root cause typically lies in the most upstream (leading) measure; corrective action should target that driver first
  • Financial results alone don’t explain “why” — non-financial perspectives provide the explanation

Recommending measures and reporting

  • Identify the driver behind each operational goal to select the right measure
  • Report leading/operational measures (training hours, defect rate) frequently (daily/weekly) to process managers
  • Report lagging/financial measures monthly or quarterly to senior management
  • Present actual vs. target, highlight variances, and report by exception rather than equal depth for all measures

Strategy map

  • Visual tool showing cause-and-effect links between the four BSC perspectives
  • Typical flow: learning & growth → internal process → customer → financial outcomes
  • Benefits: alignment, clarity, focus (prioritization/resource allocation), and improved organizational communication
  • Example: R&D investment → process improvement → innovative products → revenue growth

More from Performance measures

  • Profitability analysis
  • Calculating and evaluating profitability
  • Return on investment (ROI) and Residual Income (RI)
  • Investment base and calculation issues for ROI and RI